1342
Quantitative ΔR1 and PK Mapping Supports Tumor Habitat Delineation and Anti-Angiogenic Response Prediction of Vestibular Schwannoma1DIIDS, University of Manchester, Manchester, United Kingdom, 2Dept. of Neurosurgery, Manchester Academic Health Science Centre, Manchester Academic Health Science Centre, Salford, United Kingdom, 3Geoffrey Jefferson Brain Research Centre, University of Manchester, Salford, United Kingdom, 4Division of Neuroscience and Experimental Psychology, University of Manchester, Manchester, United Kingdom, 5Division of Cancer Sciences, University of Manchester, Manchester, United Kingdom, 6Dept. of Neuroradiology, Manchester Academic Health Science Centre, Manchester, United Kingdom
Synopsis
Keywords: Head & Neck/ENT, Tumor
In this study we sought to undertake histogram and habitat analyses of tumoural DCE-MRI derived microvascular kinetic parameters and quantitative relaxation rate changes (ΔqR1) in patients with sporadic and neurofibromatosis type 2 (NF2) related vestibular schwannoma (VS). We demonstrate that within imaged VS tumours there is considerable intratumoural heterogeneity in DCE-MRI derived microvascular metrics and ΔqR1, with distinct intratumoural regions or habitats displaying high Ktrans, vp and ΔqR1 values respectively. We furthermore demonstrate within a cohort of NF2-related VS undergoing anti-angiogenic (bevacizumab) therapy that both pre-treatment Ktrans and ΔqR1 are predictive of later tumour volumetric response at 90 days post-treatment.Introduction
Dynamic contrast enhanced MRI (DCE-MRI) derived microvascular parameters have demonstrable value in interrogating and monitoring brain tumor microenvironment and anti-angiogenic therapy response. Many brain tumors, however, show considerable intratumoral heterogeneity in their microvasculature1 and DCE-MRI microvascular metrics. Even histologically benign brain tumors such as vestibular schwannoma (VS) show considerable intratumoral microvascular heterogeneity2,3 and this heterogeneity can impact on both the cellular architecture of these tumors but also their anti-angiogenic therapy response. The purpose of this study was to use histogram analyses of tumor microvascular kinetic parameters and quantitative relaxation rate changes (ΔqR1) in a cohort of patients with VS. Through this we sought to define specific distribution characteristics that may be relevant to the performance of VS habitat analysis; and secondly explore the role of habitat analysis and ΔqR1 mapping in the prediction and monitoring anti-angiogenic treatment effects in these tumors.Materials and Methods
Study population: Fourteen patients with sporadic vestibular schwannoma (VS) and twelve patients with neurofibromatosis type 2 (NF2) related VS undergoing treatment with the anti-angiogenic agent bevacizumab (Avastin ©). Ethical approvals were in place.Data acquisition and analysis: All patients were imaged at 1.5T. Patients with sporadic VS were imaged once prior to treatment with surgery/stereotactic radiosurgery, NF2 patients were scanned twice: pre-treatment (day 0) and 3 months (day 90) following treatment with bevacizumab. Data acquisition and analysis is shown in Figure 1. DCE-MRI data was acquired using a dual injection, dual temporal resolution technique (DTR)4. A low dose (2-3 ml) of a macrocyclic GBCA (gadoterate meglumine; Dotarem, Guerbet S.A.) was initially injected during acquisition of a high temporal resolution (HT) DCE series. A full dose (= 0.2 mL/kg × weight − dose of prebolus) was then administered during a high spatial resolution (FDHS) DCE series. For longitudinal relaxation rate (R1) mapping, variable flip-angle (VFA) acquisitions were undertaken before both the HT and HS series (Figure 1). Delta quantitative R1 maps were derived using ΔqR1 = qR1bsln - qR1N, where R1N is the quantitative native tissue R1 and R1bsln is the baseline tissue R1 after the pre-bolus injection.
Microvascular kinetic parameter maps were generated from the low dose HT datasets using the extended Tofts model (ETM). High spatial resolution maps of Ktrans and vp were also generated using the ETM and a previously published DCE-MRI analysis technique, termed LEGATOS (LEvel and rescale the Gadolinium contrast concentrations curves of high-Temporal TO high Spatial DCE-MRI)5. For each tumor region-of-interest (ROI), histograms of ΔqR1 and kinetic parameter voxelwise values were generated, with high perfusion and high permeability (HPP) habitats defined as voxels above the median of the Ktrans and vp histograms. For the NF2-related VS cohort the relationship of ΔqR1 and HT Ktrans and tumor volumetric (%) change at day 90 post-treatment was compared using scatterplot and linear regression analyses.
Results
Histograms of voxelwise Ktrans, vp, ve and ΔdR1 values for a sporadic VS are shown in Figure 2. Habitat calculation was based on the biomarkers’ voxel distribution, with both Ktrans and vp showing highly right-skewed distributions, whose right tails may be modeled as a mixture of Gaussian functions.Figure 3 shows representative images from a sporadic VS displaying both the tumor subregion with high perfusion and high vascular permeability (HHP) and the region displaying high ΔqR1 respectively. As can be seen there was a close correspondence between the tumor subregion displaying high ΔqR1 and HHP.
The intertumor relationship between mean tumor Ktrans and ΔqR1 values for the NF2-related VS cohort is shown in Figure 4. Whilst there was no correlation between tumor Ktrans values and ΔqR1 across the whole tumor ROI (R2=0.08, P=0.21), within the HHP subregion only, a significant correlation was observed (R2=0.23, p=0.03). For both the whole tumor volume and HHP tumor subregion, a correlation was observed of both pre-treatment ΔqR1 (Figure 5A) and mean tumor Ktrans (Figure 5B) with tumor volumetric response at day 90 after treatment.
Discussion and conclusion
Our results demonstrate that within VS there is intratumoral heterogeneity in DCE-MRI derived microvascular metrics and ΔqR1, with tumor subregions displaying high Ktrans, vp and ΔqR1 values respectively. These results agree with previous tissue studies demonstrating histological heterogeneity in VS with distinct intratumoral regions of high and low vascularity respectively2.Use of quantitative T1 mapping for detecting subtle GBCA leakage (not detectable through visual assessment alone) and monitoring anti-VEGF therapy has been previously investigated6–12. Studies in high grade glioma have demonstrated that ΔqT1 mapping detects subtle GBCA leakage within surrounding peritumoral edema, potentially reflecting tumor infiltration into this region8, and that quantitative T1 mapping has increased sensitivity for detecting progression in patients undergoing bevacizumab therapy8. In our cohort of NF2-related VS we demonstrated that both higher baseline Ktrans and higher ΔqR1 were associated with greater tumor volumetric response at 90 days, and a key benefit of ΔqR1 as a predictive biomarker is that its derivation does not require fitting with kinetic models and is obtainable following just a low dose GBCA injection. Further studies should be undertaken to better understand histopathological correlates of these ΔqR1 changes in these tumors and the role of quantitative T1 mapping in VS treatment response prediction.
Acknowledgements
The work was supported by funding from Cancer Research UK (CRUK) and the Engineering and Physical Sciences Research council (ESPRC) through the Cancer Imaging Centres grant (C8742/A18097).
References
1. Waqar M et al. Early Therapeutic Interventions for Newly Diagnosed Glioblastoma: Rationale and Review of the Literature. Curr Oncol Rep 2022; 24: 311–324.
2. Lewis D et al. The microenvironment in sporadic and neurofibromatosis type II–related vestibular schwannoma: the same tumor or different? A comparative imaging and neuropathology study. J Neurosurg 2020; 134: 1–11.
3. Lewis D et al. Detection of early changes in the post-radiosurgery vestibular schwannoma microenvironment using multinuclear MRI. Sci Rep 2021; 11: 15712.
4. Li K-L et al. An improved coverage and spatial resolution-using dual injection dynamic contrast-enhanced (ICE-DICE) MRI: A novel dynamiccontrast-enhanced technique for cerebral tumors. Magn Reson Med 2012; 68: 452–462.
5. Li K-L et al. The LEGATOS technique: A new tissue-validated dynamic contrast-enhanced MRI method for whole-brain, high-spatialresolution parametric mapping. Magn Reson Med 2021. doi:10.1002/mrm.28842.
6. Han SH et al. Gaussian mixture model-based classification of dynamic contrast enhanced MRI data for identifying diverse tumor microenvironments: preliminary results. NMR Biomed 2013; 26: 519–532.
7. Nöth U et al. Quantitative T1 mapping indicates tumor infiltration beyond the enhancing part of glioblastomas. NMR Biomed 2020; 33: e4242.
8. Lescher S et al. Quantitative T1 and T2 mapping in recurrent glioblastomas under bevacizumab: earlier detection of tumor progression compared to conventional MRI. Neuroradiology 2015; 57: 11–20.
9. Blystad I et al. Quantitative MRI using relaxometry in malignant gliomas detects contrast enhancement in peritumoral oedema. Sci Rep 2020; 10: 17986.
10. Domayer SE et al. Delayed gadolinium-enhanced MRI of cartilage in the ankle at 3 T: feasibility and preliminary results after matrix-associated autologous chondrocyte implantation. J Magn Reson Imaging 2010; 31: 732–739.
11. Keller S et al. Native T1 Mapping Magnetic Resonance Imaging as a Quantitative Biomarker for Characterization of the Extracellular Matrix in a Rabbit Hepatic Cancer Model. Biomedicines 2020; 8.
12. Damadian R. Tumor detection by nuclear magnetic resonance. Science 1971; 171: 1151–1153.
Figures
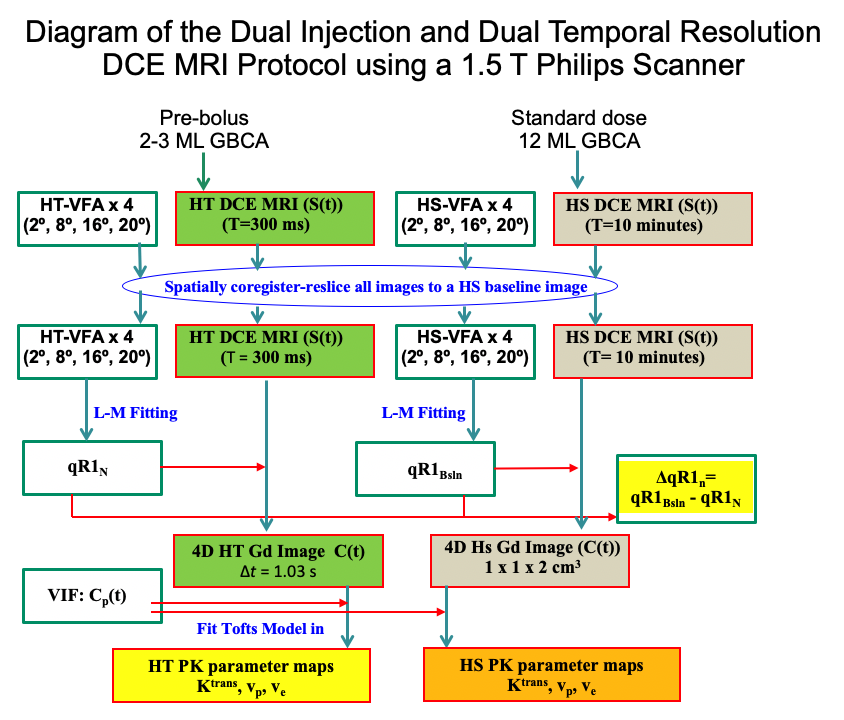
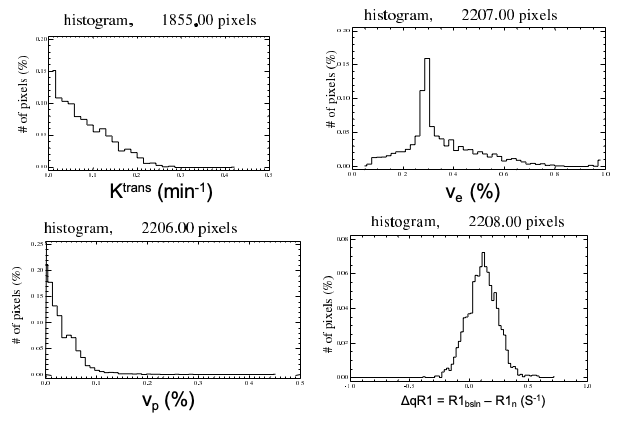
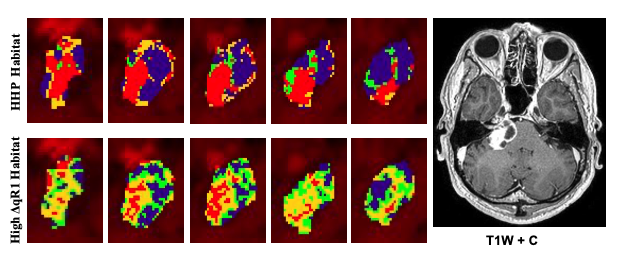
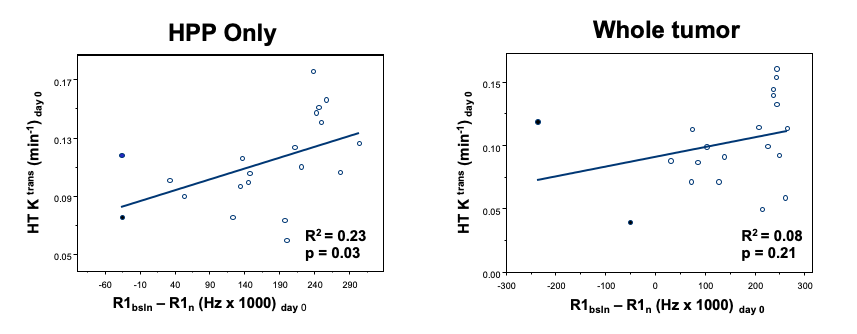
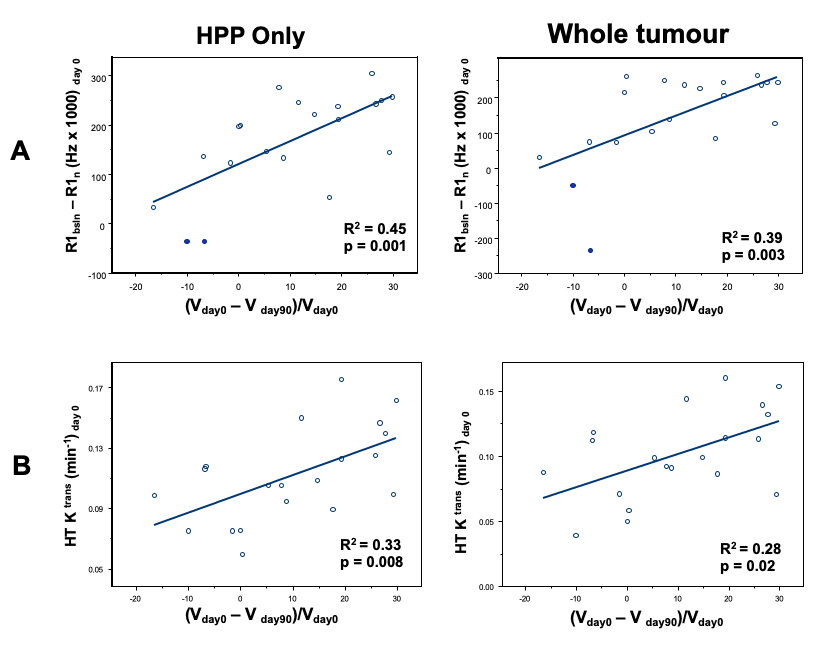
Figure 5. Plots of Correlations: A: The correlation between mean pre-treatment (day 0) tumor ΔqR1 and the tumor volume (%) change at day 90 post bevacizumab treatment. Correlation in the HHP tumor subregion (left) and the whole tumor ROI (right) shown.
B: The correlation between mean pre-treatment (day 0) tumor Ktrans and the tumor volume (%) change at day 90 post bevacizumab treatment. Correlation in the HHP tumor subregion (left) and the whole tumor ROI (right) shown. The results of linear regression are reported as adjusted R2 estimates.