1341
Identifiy geniculate ganglion venous malformation from geniculate ganglion schwannoma using dynamic contrast-enhanced MRI
Mengda Jiang1, Yongchuan Chai2, Yang Song3, and Xiaofeng Tao1
1Department of Radiology, Shanghai Ninth People’s Hospital, affiliated to Shanghai Jiaotong Universit, ShangHai, China, 2Department of Otolaryngology, Head & Neck Surgery, Shanghai Ninth People’s Hospital, affiliated to Shanghai Jiaotong University School of Medicine, Shanghai, China, 3MR Scientific Marketing, Siemens Healthcare, Shanghai, China
1Department of Radiology, Shanghai Ninth People’s Hospital, affiliated to Shanghai Jiaotong Universit, ShangHai, China, 2Department of Otolaryngology, Head & Neck Surgery, Shanghai Ninth People’s Hospital, affiliated to Shanghai Jiaotong University School of Medicine, Shanghai, China, 3MR Scientific Marketing, Siemens Healthcare, Shanghai, China
Synopsis
Keywords: Head & Neck/ENT, Nerves, Geniculate Ganglion, Facial Nerve
To evaluate the CT and MRI findings to identify geniculate ganglion venous malformation (GGVM) and geniculate ganglion schwannoma (GGS). Clinical data, lesion size, involvement of facial nerve (FN) segment, signal intensity, homogeneity, the enhancement pattern on DCE-MRI, characteristics of bone destruction on HRCT were evaluated. Lesion size, involvement of FN segment, T1W and T2W intensity, and homogeneity on DCE-MRI were statistically different between them. For regression model, the “honeycomb” sign and “point-to-side” enhancement pattern were independent risk factor (AUC=0.975, accuracy=97.70%, sensitivity=95%, specificity=100%, PPV=100%, NPV=95.80%).Introduction
Geniculate ganglion venous malformation (GGVM) and geniculate ganglion schwannoma (GGS) are two rare, slow-growing, benign primary lesions located at the same site (1). The primary lesions in the temporal bone resulting in facial paralysis are rare, and GGVM and GGS are the most common causes among them (2, 3). Although GGVM and GGS share the same pathological site and both cause facial paralysis, the management strategies between them are completely different. Previous studies have shown the differential diagnosis of GGVM and GGS is mainly based on conventional MRI and high-resolution CT (HRCT) (1). In this study, dynamic contrast-enhanced (DCE) MRI combined with temporal bone HRCT and conventional MRI were studied for the first time to establish an imaging diagnosis system to distinguish these two distinct lesions.Maerials and Methods
CT/MRI image data of 20 GGVM and 23 GGS were confirmed by postoperative pathology from January 2016 to January May 2021. The inclusion and exclusion criteria were shown in Figure 1. Histopathologic analysis was performed by a neuropathologist.HRCT was performed with a 128-slice spiral CT scanner (Siemens, SOMATOM Definition Flash, Erlangen, Germany). The parameters were: 120keV, 120mAs, pitch 0.8, and a collimation width of 0.6 mm, using bone reconstruction algorithm. All MRI examinations were performed on a 3T scanner (Magnetom Verio, Siemens Healthcare, Erlangen, Germany) with head and neck coils. Detailed sequence parameters are presented in Table 2.
Images were independently evaluated by two radiologists experience in head and neck imaging blinded to pathology results. Location, size, configuration, signal intensity, homogeneity, enhancement pattern of the lesion, and the segment involved score (include internal auditory canal [IAC], labyrinthine segment [LS], tympanic segment [TS] and vertical segment [VS], get one point for each segment involved) on CT and MRI were assessed.
The “point-to-side” enhancement means that on early imaging of DCE-MRI. The “side-to-side” pattern included gradually heterogeneous enhancement or gradually homogeneous enhancement of the whole lesion. The maximum diameter of the lesion in the axial or coronal contrast-enhanced T1WI images was measured. The gray matter was considered as the reference to determine the signal intensity in MRI. The criteria of involvement segment of FN on CT and MRI image were compared to the contralateral normal anatomy. A segment was considered abnormal if it was widened by ≥20% compared to the contralateral segment. On MRI asymmetrically enhancing and enlarged segments of the nerve contiguous with the masses were considered to be involved with the tumor.
Descriptive statistics were used to summarize all study variables and were presented as mean±SD or median and interquartile range. For categorical/continuous variables, a chi-squared test or Fisher test/two-tailed student’s t-test or Mann-Whitney test was performed. A multi-factor regression model was constructed to find the possibility and method of differentiating the GGVM and GGS. The diagnostic performance was evaluated by the area under the ROC curve (AUC), the sensitivity, specificity, positive predictive value (PPV), negative predictive value (NPV) and accuracy were obtained at the same time. P<0.05 was considered statistically significant.
Results
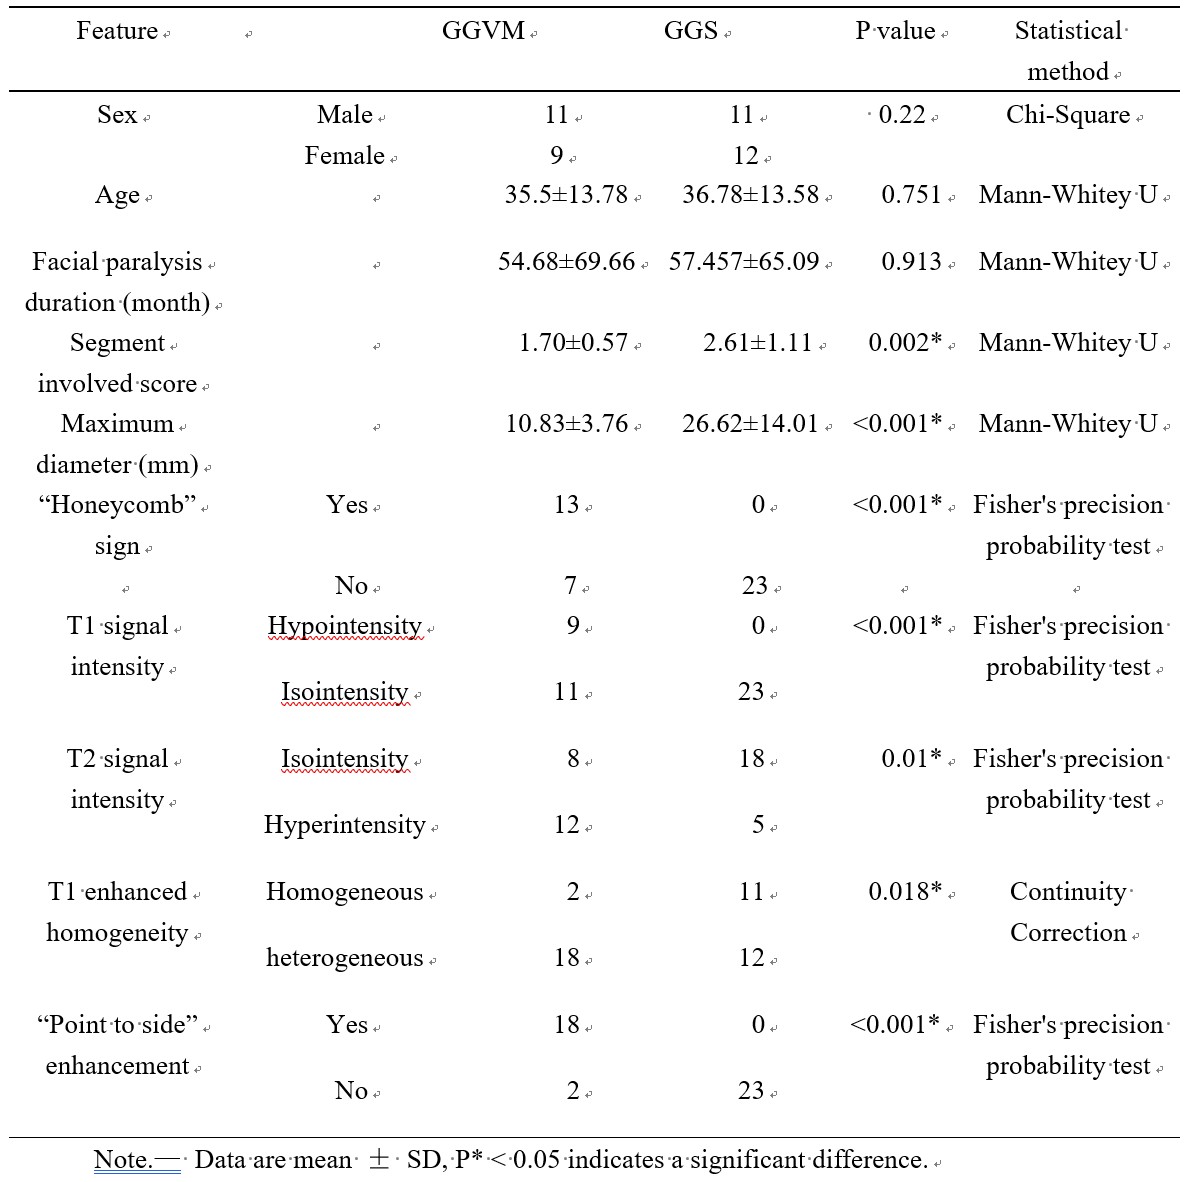
Most findings were summarized in Table 1. The maximum diameter of GGSs was significantly larger than GGVMs (P < 0.001). In addition, there was a significant difference between GGVMs and GGSs regarding “honeycomb” sign on HRCT (P<0.001), T1 signal intensity (P<0.001), T2 signal intensity (P=0.01), T1 enhanced homogeneity (P=0.0018).Notably, we observed a characteristic “point to side” enhancement pattern in GGVMs with or without honeycomb sign, which was described as that the enhancement of the contrast media presented a time-dependent “point-to-side” spread on DCE-MRI (Figure 2). Clinical data and imaging features based logistic regression model was useful in distinguishing GGVMs and GGSs (AUC=0.975, accuracy=97.70%, sensitivity=95%, specificity=100%, PPV=100%, NPV=95.80%).
Discussion and Conclusion
Clinical intervention on GGVMs after accurate diagnosis is extremely significant for the preservation of FN integrity. Our results showed the clinical data and imaging features based logistic regression model was useful in distinguishing GGVMs and GGSs.Most of the literature describes GGVM with such "honeycomb" bone changes as ossifying hemangioma. Based on this, we can call it ossifying GGVM, and that without “honeycomb” sign is defined as non-ossifying GGVM. In our study, 65.0% (13/20) GGVMs presented the specific "honeycomb" sign while none of GGSs had this change. However, on HRCT, 35.0% of GGVMs were similar to those of GGSs.
To our best knowledge, DCE-MRI was first reported to differentiate these two lesions originate from GG. Our work showed that the temporal spread pattern of the contrast agent was in a “point-to-side” pattern from the GGVM patients except for two small lesions, while a “side-to-side” spread pattern was observed in all GGS patients. We believe that DCE-MRI plays a valuable role in the differentiation of venous malformations and other tumors.
The present study does comprise some limitations. Firstly, all analyses were based on retrospective data. Secondly, whilst this study presents one of the largest number of cases in the literature, it was still a small patient population due to the low incidence of GGVM and GGS.
In conclusion, GGVM and GGS harbor different CT and MR imaging feature especially the “honeycomb” sign on HRCT and the enhancement pattern on MRI. The DCE-MRI provides unique diagnostic value.
Acknowledgements
No acknowledgement found.References
1. Guerin JB, Takahashi EA, Lane JI, et al. Facial nerve venous malformation: A radiologic and histopathologic review of 11 cases. Laryngoscope Investig Otolaryngol 2019; 4:347-352.
2. Pulec JL. Facial nerve neuroma. Ear Nose Throat J 1994; 73:721-722, 725-739, 743-752.
3. Saito H, Baxter A. Undiagnosed intratemporal facial nerve neurilemomas. Arch Otolaryngol. 1972; 95:415-419.
Figures
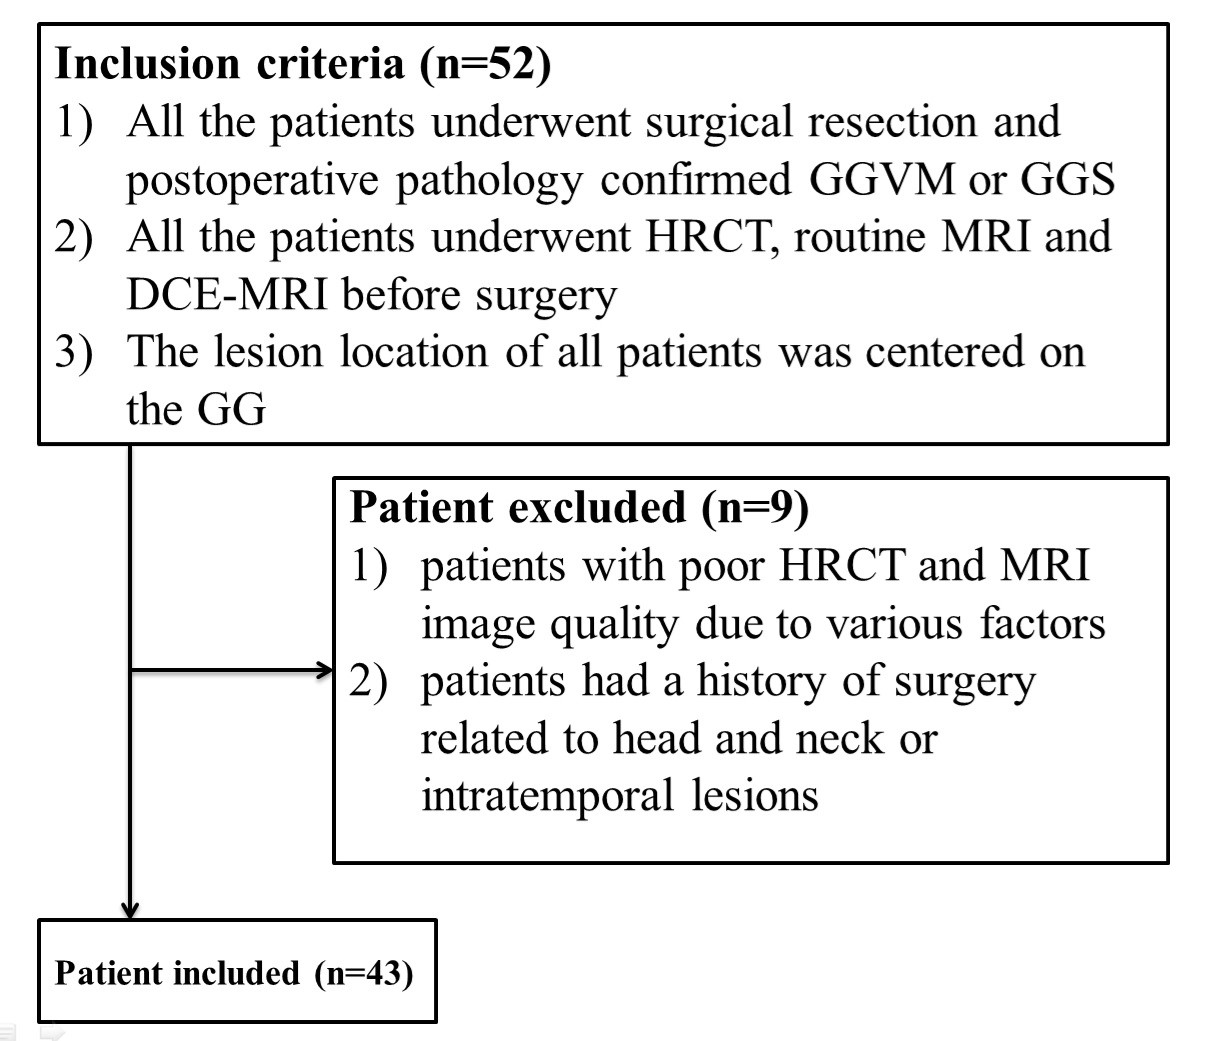
Figure 1. Diagram shows the
patient selection process. GGVM = geniculate
ganglion venous malformation, GGS = geniculate ganglion
schwannoma.
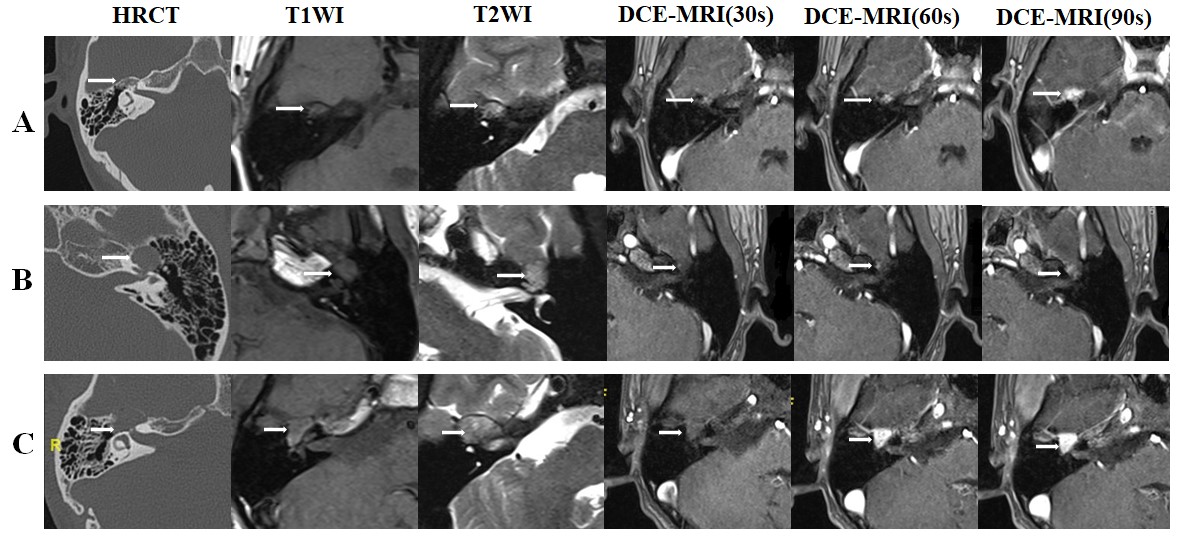
Figure 2. Imaging findings of
GGVM and GGS. (A) Images in a 49-year-old
woman with ossifying GGVM. (B) Images
in a 37-year-old man with non-ossifying GGVM. (C) Images in a 20-year-old woman with GGS. GGVM = geniculate ganglion venous malformation, GGS = geniculate
ganglion schwannoma.
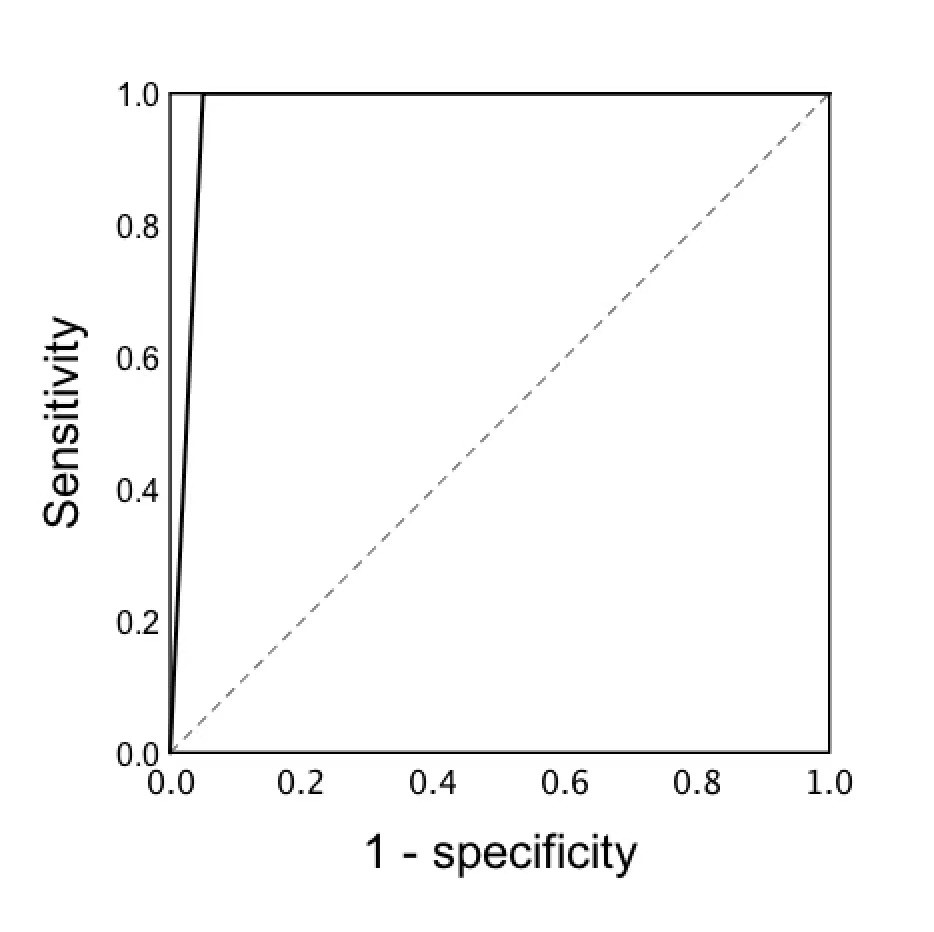
Figure 3. Receiver operating
characteristic curves for predicting GGVM and GGS. GGVM = geniculate ganglion venous malformation, GGS = geniculate
ganglion schwannoma.
Table
1. Clinical data and imaging features of geniculate
ganglion venous malformation and schwannoma.
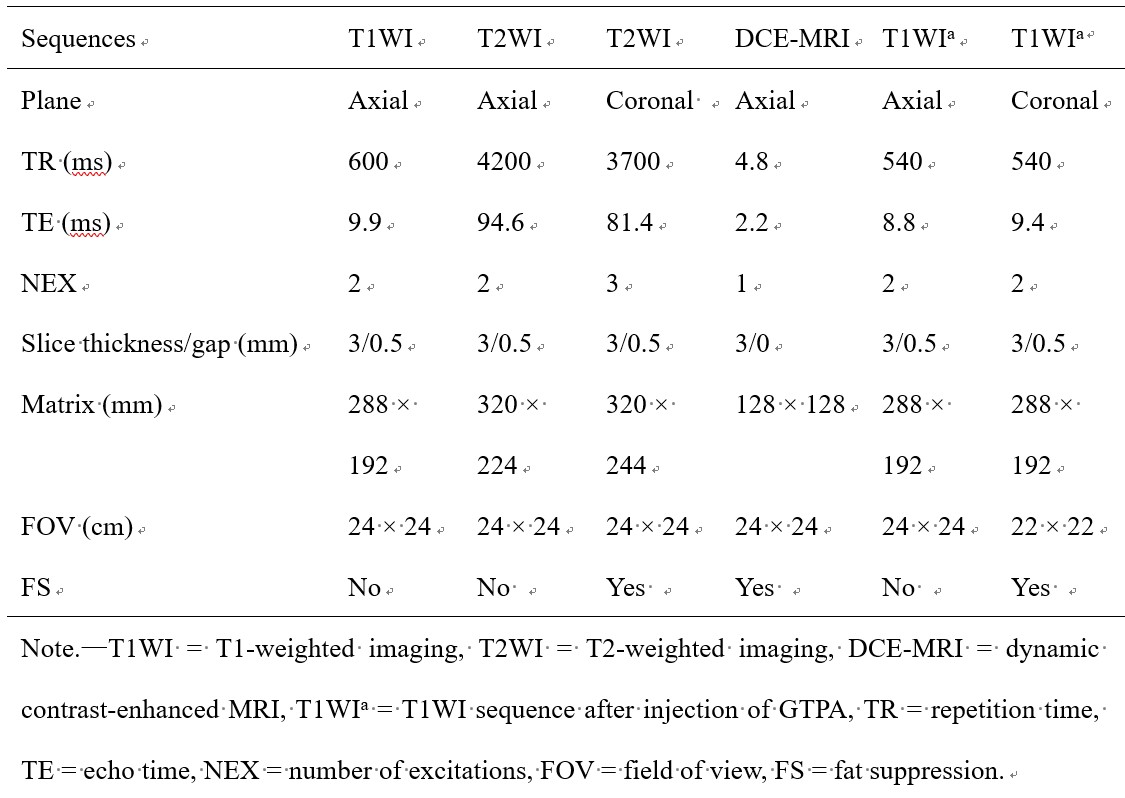
Table 2. Detailed
sequence parameters of the MRI protocol.
DOI: https://doi.org/10.58530/2023/1341