1338
Apparent diffusion coefficient histogram analysis of adenoid cystic carcinoma: correlation with histopathology and the prediction of survival1Radiology, Shanghai Ninth People’s Hospital,Shanghai Jiao Tong University School of Medicine, Shanghai, China, 2MR Scientific Marketing, Siemens Healthcare. Shanghai, China, Shanghai, China
Synopsis
Keywords: Head & Neck/ENT, Cancer
The aim of this retrospective study is to explore the value of histogram analysis of apparent diffusion coefficient (ADC) values for distinguishing different subtypes of adenoid cystic carcinoma (ACC) and prediction of survival. Receiver operating characteristic curve analysis was used to determine the best differentiating parameters. The ADC_10th percentile values achieved highest diagnostic efficacy with an AUC of 0.821. The multivariable Cox proportional hazards model found that radiomic signature and tumor stage were significant predictors in ACC patients. Histogram analysis of ADC values may be helpful for differentiating the subtypes of ACC, leading to improved targeted treatment and reduced morbidity.Introduction
Adenoid cystic carcinoma (ACC) is a rare malignancy that mainly rises from major and minor salivary glands, which was described as “one of the most biologically destructive and unpredictable tumors of the head and neck”, for having a distinct natural history characterized by slow-growing but high frequency of local recurrence, perineural spread, and development of distant metastasis1, 2. The current study aimed to analyze the DWI histogram to construct a diagnosed model for distinguishing different subtypes of ACC. The usefulness of this model in predicting the survival of ACC was also assessed.Method
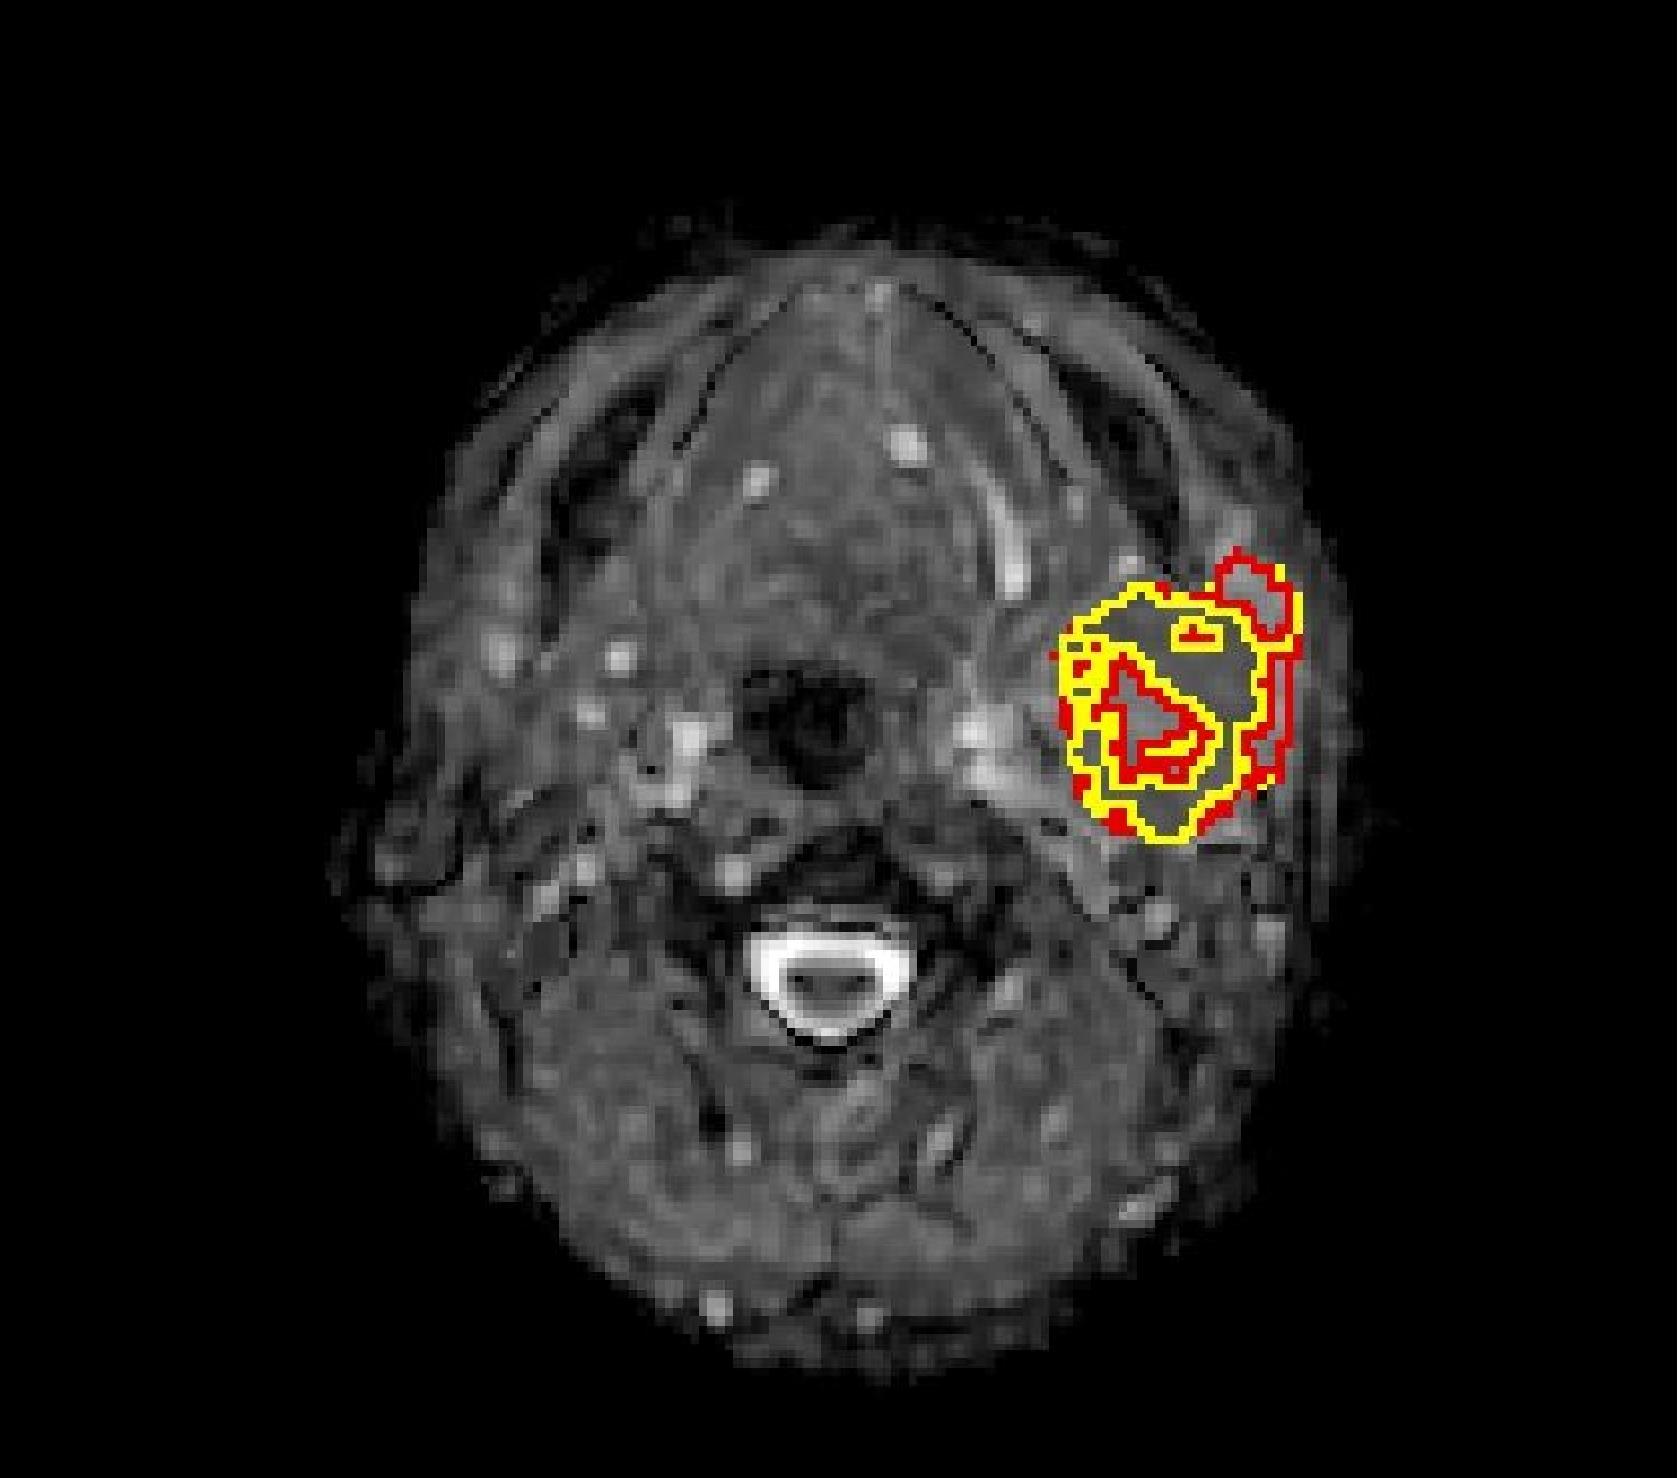
MRI data of our institution were retrospectively reviewed. Inclusion criteria were (1) Primary ACC located in the head and neck region; (2) diagnosis of cases was confirmed by surgical pathology and pathological subtype were diagnosed; (3) all cases underwent the MR examinations within 2 weeks before surgery. And exclusion criteria were (1) patients who had received any treatment (biopsy, neoadjuvant chemotherapy, or prior radiotherapy) before the MR exam; (2) those who had other head and neck tumors previously or recurrent disease; (3) poor image quality because of artifacts. In most ACCs, all three patterns coexist and are interleaved in such a manner that diagnosis depends on the pathologist’s subjective interpretation. According to the definition, low-grade ACC consists of Perzin grade I (predominantly tubular, no solid) and II (predominantly cribriform, <30% solid). High-grade ACC thus consists of Perzin grade III (>30% solid component). Specimens were subdivided into low- and high-grade ACC for analysis. All MR images were obtained from 3T MR scanners (Ingenia, Philips Medical Systems; MAGNETOM Vida, Siemens) with a 16-channel head and neck coil. Pre-enhancement MR sequences included axial T1WI[YS1] , axial and coronal T2WI, and diffusion weighted imaging (DWI). DWI images were obtained by using a spin-echo echo-planar imaging sequence with b values of 0 and 800 sec/mm2. Axial and coronal post-enhancement T1WI were obtained after administration of gadopentetate dimeglumine at a dose of 0.1 mmol/kg of body weight at an injection rate of 2 ml/s. The corresponding ADC map of were constructed by a monoexponentially fitting model with the b values of 0 and 800 sec/mm2. The preprocess and the feature extraction were implemented by PyRadiomics 3.0.1 and followed the Image biomarker standardization initiative (IBSI). All cases were resampled into an inner resolution of 0.56mmx0.56mm by a fit-to-original-grid approach and the ROI was re-segmented part by a 3-sigma approach. Considering the sequence is not quantitative, we normalized the sequence for each case respectively by Z-score. For the histogram analysis of ADC maps, we used the Ostu threshold algorithm to estimate the cut-off value for splitting the high- and low-ADC sub-regions. The 10%, 50%, 90%, the mean value of ADC values of each region were estimated. Then we used these features to develop the machine learning model to estimate the prediction of the ACC subtypes. Cox regression with multivariable analysis were used to construct the survival signature.Result
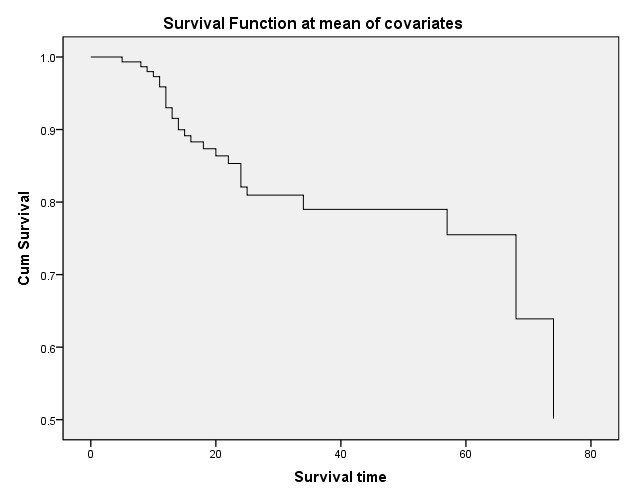
The final study population was comprised of 107 cases (41 men, 66 women; mean age, 52.4 ± 13.5 years). The gender and the T stage were found significant differences between low- and high-grade groups with the X2=4.757 (P=0.029) and X2=7.713 (P=0.007), respectively. The median OS time was 27 months for all patients (range, 5–78 days). During the follow-up period, 27 patients (25.2%) had experienced a confirmed death. The ADC values of all cases were distributed in a nearly normal fashion and the cut-off value was 1.3 × 10⁻³mm/s (figure 1). Based on the ROC analyses, the ADC_10th percentile and ADC_50th percentile values achieved higher diagnostic efficacy with an AUC of 0.821 and 0.804, a sensitivity of 94.4% and 83.3%, and specificity of 61.7% and 68.5%, for differentiating the low-grade group from a high-grade group at the cutoff value of 0.92 × 10⁻³mm2/s and 1.10 × 10⁻³mm2/s, respectively. Cox proportional hazards model found that radiomic signature and tumor stage were significant predictors in ACC patients (radiomic signature: HR: 3.13, 95% CI:1.95–5.24, P < 0.001; stage: HR: 3.25, 95% CI: 1.01–2.35, P = 0.042).Discussion
In this study, the results revealed significant differences in several radiomics features of DWI that could be used to predict the histological subgroup of ACC. The combination of radiomics parameters of DWI significantly improved the differentiating ability of subtypes than radiomics parameters of DWI alone, which could potentially be used in clinical practice regarding the ACC evaluation before treatment. A diagnostic model was found useful not only in the diagnosis of the histopathological subgroup of ACC but also in the prediction of survival rate.Conclusion
Histogram analysis of ADC values may be helpful for differentiating the subtypes of ACC, leading to improved targeted treatment and reduced morbidity.Acknowledgements
NoneReferences
1. Coca-Pelaz A, Rodrigo JP, Bradley PJ, et al (2015) Adenoid cystic carcinoma of the head and neck--An update. Oral oncology 51:652-661
2. Bjorndal K, Krogdahl A, Therkildsen MH, et al (2012) Salivary gland carcinoma in Denmark 1990-2005: outcome and prognostic factors. Results of the Danish Head and Neck Cancer Group (DAHANCA). Oral oncology 48:179-185
3. Spiro RH, Huvos AG (1992) Stage means more than grade in adenoid cystic carcinoma. The American Journal of Surgery 164:623-628
4. He S, Li P, Zhong Q, et al (2017) Clinicopathologic and prognostic factors in adenoid cystic carcinoma of head and neck minor salivary glands: A clinical analysis of 130 cases. American journal of otolaryngology 38:157-162
5. Abdel Razek AAK, Elkhamary SM, Nada N (2019) Correlation of apparent diffusion coefficient with histopathological parameters of salivary gland cancer. International journal of oral and maxillofacial surgery 48:995-1000
6. Gencturk M, Ozturk K, Caicedo-Granados E, Li F, Cayci Z (2019) Application of diffusion-weighted MR imaging with ADC measurement for distinguishing between the histopathological types of sinonasal neoplasms. Clinical imaging 55:76-82
Figures