1337
Application of IVIM, DKI, FROC and CTRW in vascular normalization induced by recombinant human endostatin in nasopharyngeal carcinoma.
Lixuan Huang1, Hao Ren2, Zongxiang Yang1, Yao Hu1, Huiting Zhang3, and Liling Long1
1The First Affliated Hospital of Guangxi Medical University, Nanning, China, 2Guangxi Medical University Kaiyuan Langdong Hospital, Nanning, China, 3MR Scientific Marketing, Siemens Healthineers Ltd., Wuhan, China
1The First Affliated Hospital of Guangxi Medical University, Nanning, China, 2Guangxi Medical University Kaiyuan Langdong Hospital, Nanning, China, 3MR Scientific Marketing, Siemens Healthineers Ltd., Wuhan, China
Synopsis
Keywords: Cancer, Diffusion/other diffusion imaging techniques
This study explored the vascular normalization induced by recombinant human endostatin (RHES) in nasopharyngeal carcinoma (NPC) based on IVIM, DKI, FROC and CTRW. Results showed that the DKI_D, CTRW_alpha, and FROC_D had a significant difference between prior-treatment and Day 5 in RHES group, FROC_mu in Day 5 and CTRW_alpha in post-treatment were statistically significant in two groups, and DKI_K with decreased trend with the progress of RHES + IC treatment. These results suggest that the four diffusion models can detect the noninvasively monitor the vascular normalization induced by RHES in NPC.Introduction/Purpose
Recombinant human endostatin (RHES) under the brand name of Endostar (ES) is a broad-spectrum anti-angiogenic targeted drug. The previous study had reported that following administration of the antiangiogenic agents, a unique “window” occurred, where irregular vessels inside the tumor were normalized1. Thus, the tumor blood flow increased, providing a valuable yet transient opportunity for improved delivery of the oxygen and chemotherapeutic agents that may enhance the curative effect2. Although the “vascular normalization window” induced by RHES in NPC has been proven in animal experiments3, only a limited number of studies have conducted the clinical evaluation of vascular normalization. Due to DWI can reflect the microenvironment changes, it has been a powerful method to detect the NPC. Moreover, the advanced diffusion models, such as intro-voxel incoherent movement (IVIM), diffusion kurtosis imaging (DKI), had showed the high ability in detecting NPC4-5. Recently, the novel advanced diffusion models, fractional order calculus (FROC) and continuous-time random walk (CTRW) models, had been proposed and showed high sensitivities in brain tumor6. In this preliminary study, we explored the vascular normalization induced by recombinant human endostatin in NPC based on the above four diffusion models,and provided the theoretical basis for clinical treatment.Methods
This prospective study was approved by the Ethics Committee and informed consents were obtained from all patients. A total of 32 patients with stage III–IVA NPC were enrolled, and were divided into RHES and Control groups. The patients in the RHES group were administered RHES plus induction chemotherapy (IC) intravenously, while the patients in the Control group were administered only IC. The age, sex, pathologic type, TN staging of all patients were collected (Table 1). All patients underwent MRI examination on the 3T MR Scanner (MAGNETOM Prisma; Siemens Healthcare, Erlangen, Germany). Each patient completed MR examinations at three time points, prior-treatment, on 5 days after treatment (Day 5), and the end of treatment. Besides the routine MRI sequence such as T2w, T1w and CE-T1w, a multi-b DWI was also performed. Imaging parameters of multi-b DWI were as follows: TR/TE = 4000/61 ms, FOV = 200 x 200 mm, slice thickness=3mm, b value= 0, 10, 20, 30, 50, 100, 150, 200, 600, 1000, 1500, 2000 s/mm2, scan time=5min10s. The parameters of IVIM (using b value from 0 to 1000 s/mm2 ), DKI (using b 0, 200, 600,1000, 1500, and 2000 s/mm2), FROC (using all b values), and CTRW models (using all b value) were calculated, including diffusion coefficient from all the four models (IVIM_D, DKI_D, FROC_D, and CTRW_D), pseudo- diffusion coefficient and its fraction in diffusion from IVIM (IVIM_D* and IVIM_f), mean, axis, and radial kurtosis from DKI (DKI_MK, DKI_AK, DKI_RK), alpha and beta from CTRW (CTRW_alpha and CTRW_beta), and β and μ from FROC (FROC_beta and FROC_mu). One-way ANOVA was used to assess the differences of parameters among the three time points. p<0.05 was considered to be significantly different.Result
In RHES group, compared with in prior-treatment, DKI_D, FROC_D, and CTRW_alpha in Day 5 were statistically significant (p<0.05); and DKI_D, CTRW_D, FROC_D, IVIM_D, ADC, DKI_K, IVIM_f, and CTRW_alpha in post-treatment were statistically significant (p<0.05), as shown in Table 2. In Control group, ADC, CTRW_beta in Day 5 and CTRW_D in post-treatment were statistically significant compared with in prior-treatment (p<0.05); and CTRW_beta and FROC_beta were statistically significant between Day 5 and post-treatment, as shown in Table 3. In addition, compared with Control group, FROC_mu in Day 5 and CTRW_alpha in post-treatment was statistically significant at the same timepoints of the treatment in RHES group (Table 4).Discussion and Conclusion
In this study, we investigated the value for the quantitative parameters for vascular normalization induced by recombinant human endostatin in NPC based on the different diffusion models. Results showed that the DKI_D, FROC_D, and CTRW_alpha had a significant difference between prior-treatment and Day 5 in RHES group, FROC_mu in Day 5 and CTRW_alpha in post-treatment were statistically significant between the RHES and Control groups, meaning that they are sensitive biomarkers for detecting the change of tumor microenvironment, which may cause by vascular normalization of tumor. In addition, although no significant difference in DKI_K was found between prior- and Day 5 in RHES group, the decreased trend was evident. The tumor microenvironment sustained improvement with the progress of RHES + IC treatment. The decreased mean kurtosis with progress also suggested the reduction of tumor internal tissue heterogeneity. In conclusion, our study suggested that the four diffusion models can detect the noninvasively monitor the vascular normalization induced by RHES in NPC.Acknowledgements
We sincerely thank the participants in this study.References
[1] Lin MI, Sessa WC. Antiangiogenic therapy: creating a unique “window” of opportunity. Cancer Cell. 2004;6(6):529–531. [2] Yang Z, et al. Clinical evaluation of vascular normalization induced by recombinant human endostatin in nasopharyngeal carcinoma via dynamic contrast-enhanced ultrasonography. Onco Targets Ther. 2018; 11, 7909-7917. [3] Peng F, Xu Z, Wang J, et al. Recombinant human endostatin normalizes tumor vasculature and enhances radiation response in xenografted human nasopharyngeal carcinoma models. PLoS One. 2012;7(4): e34646. [4] Lai, V., et al., Intravoxel incoherent motion MR imaging in nasopharyngeal carcinoma: comparison and correlation with dynamic contrast enhanced MR imaging. Oncotarget, 2017. 8(40): 68472-68482. [5] Yi, S., et al., Differentiation of Low- and High-Grade Pediatric Brain Tumors with High b-Value Diffusion-weighted MR Imaging and a Fractional Order Calculus Model. Radiology, 2015. 277(2): 489-96. [6]. Chen, W., et al., Differentiation of salivary gland tumor using diffusion-weighted imaging with a fractional order calculus model. Br J Radiology, 2020. 93(1113): 20200052.Figures
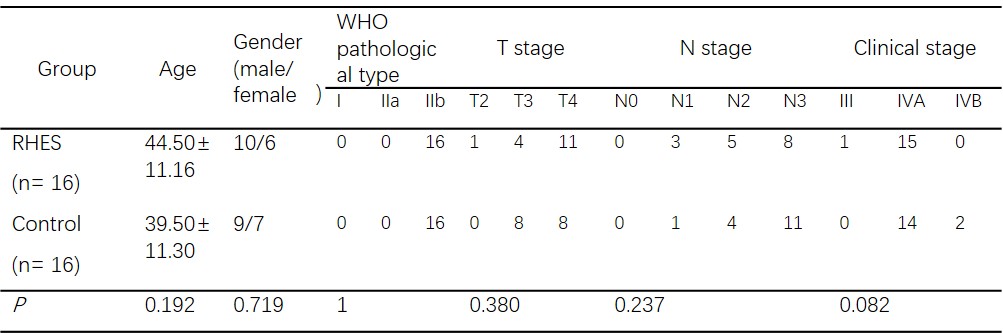
Table 1. Characteristics of patients (a: Pathology
types according to the 2005 classification of WHO criteria; b: T staging and N
staging according to the eighth edition of UICC/AJCC staging system for NPC).
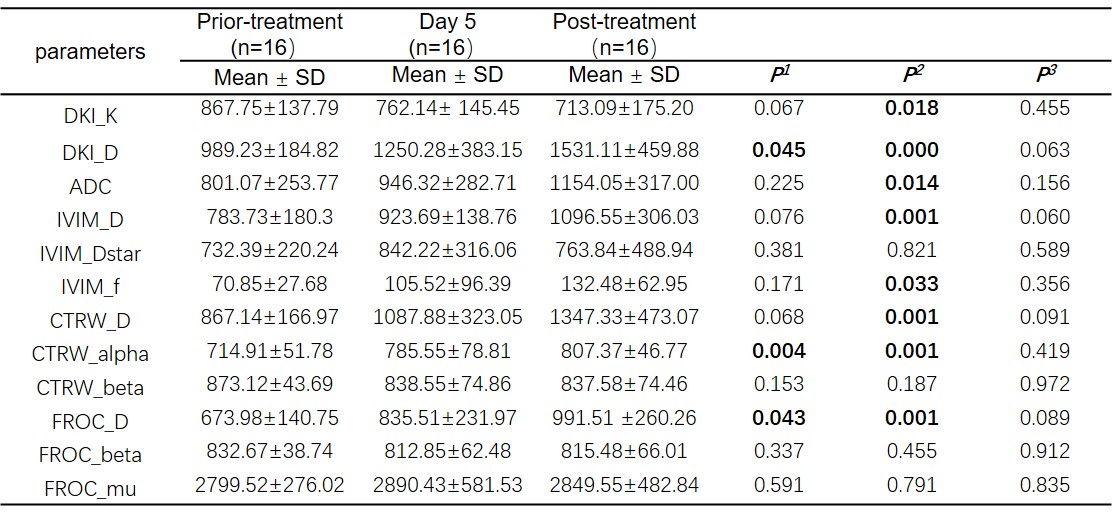
Table 2. Comparison of parameters for different timepoints of the treatment
in RHES group. (P1: Comparison
between prior-treatment and Day 5; P2:
Comparison between prior-treatment and post-treatment; P3:
Comparison between Day 5 and post-treatment. D from all models and ADC: × 10-6 mm2/s,
IVIM_Dstar: × 10-5 mm2/s, FROC_mu: × 10-6 mm)
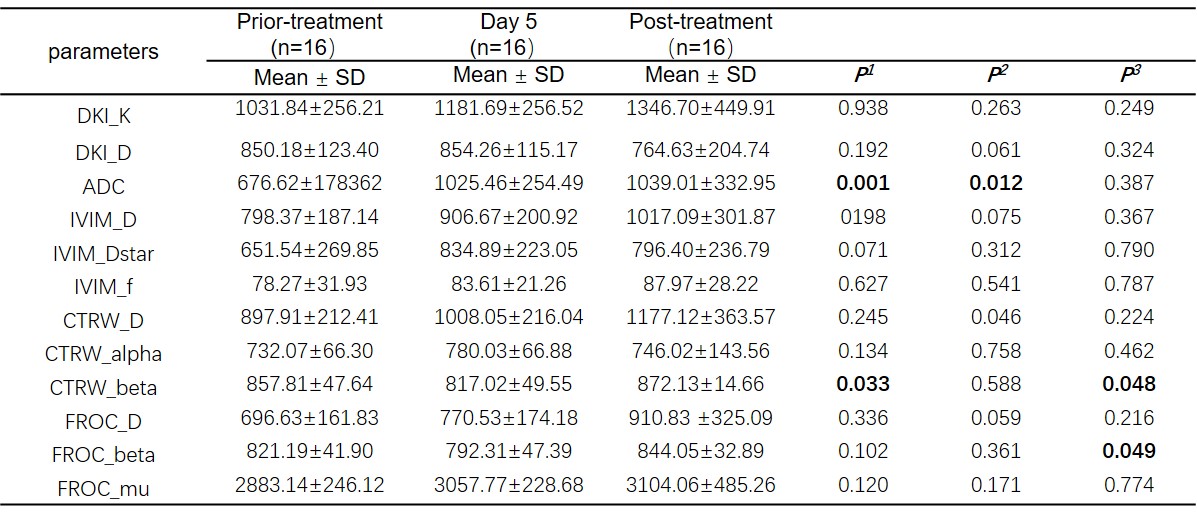
Table 3. Comparison of
parameters for different timepoints of the treatment in Control group. (P1: Comparison
between prior-treatment and Day 5; P2:
Comparison between prior-treatment and post-treatment; P3:
Comparison between Day 5 and post-treatment. D from all models and ADC: × 10-6
mm2/s, IVIM_Dstar: × 10-5 mm2/s,
FROC_mu: × 10-6 mm)
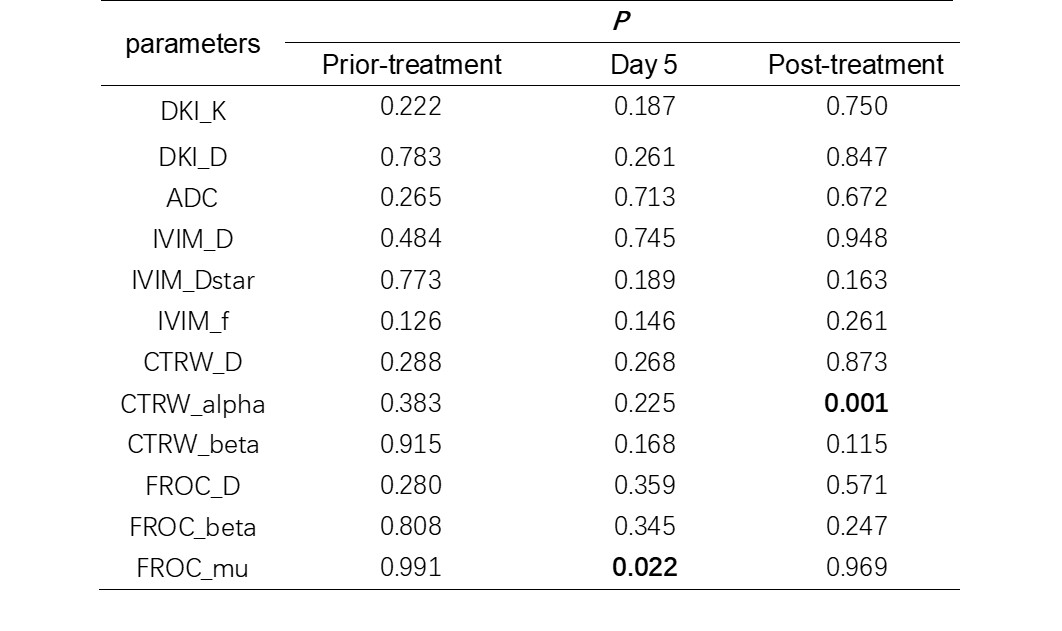
Table 4. Comparison of parameters for different
timepoints of the treatment in in two groups
DOI: https://doi.org/10.58530/2023/1337