1330
Evaluation of reverse encoding distortion correction DWI in patients with non-functioning pituitary macroadenoma1Department of Diagnostic Imaging and Nuclear Medicine, Graduate School of Medicine, Kyoto University, Kyoto, Japan, 2Department of Advanced Medical Imaging Research, Graduate School of Medicine, Kyoto University, Kyoto, Japan, 3Department of Real World Data Research and Development, Graduate School of Medicine, Kyoto University, Kyoto, Japan, 4Canon Medical Systems Corporation, Otawara, Japan
Synopsis
Keywords: Head & Neck/ENT, Diffusion/other diffusion imaging techniques
Reverse encoding distortion correction diffusion-weighted imaging (RDC-DWI) is a novel on-console technique to reduce eddy current-induced distortion of motion probing gradient (MPG) images in addition to B0 field inhomogeneity. We compared RDC-DWI, B0-corrected-DWI, and original DWI in patients with unoperated non-functioning macroadenoma or residual pituitary macroadenoma after surgery. RDC-DWI had the best image quality regarding distortion, artifacts and overall tumor visualization, which suggested that RDC-DWI facilitates accurate visualization in the pituitary region on DWI.Introduction
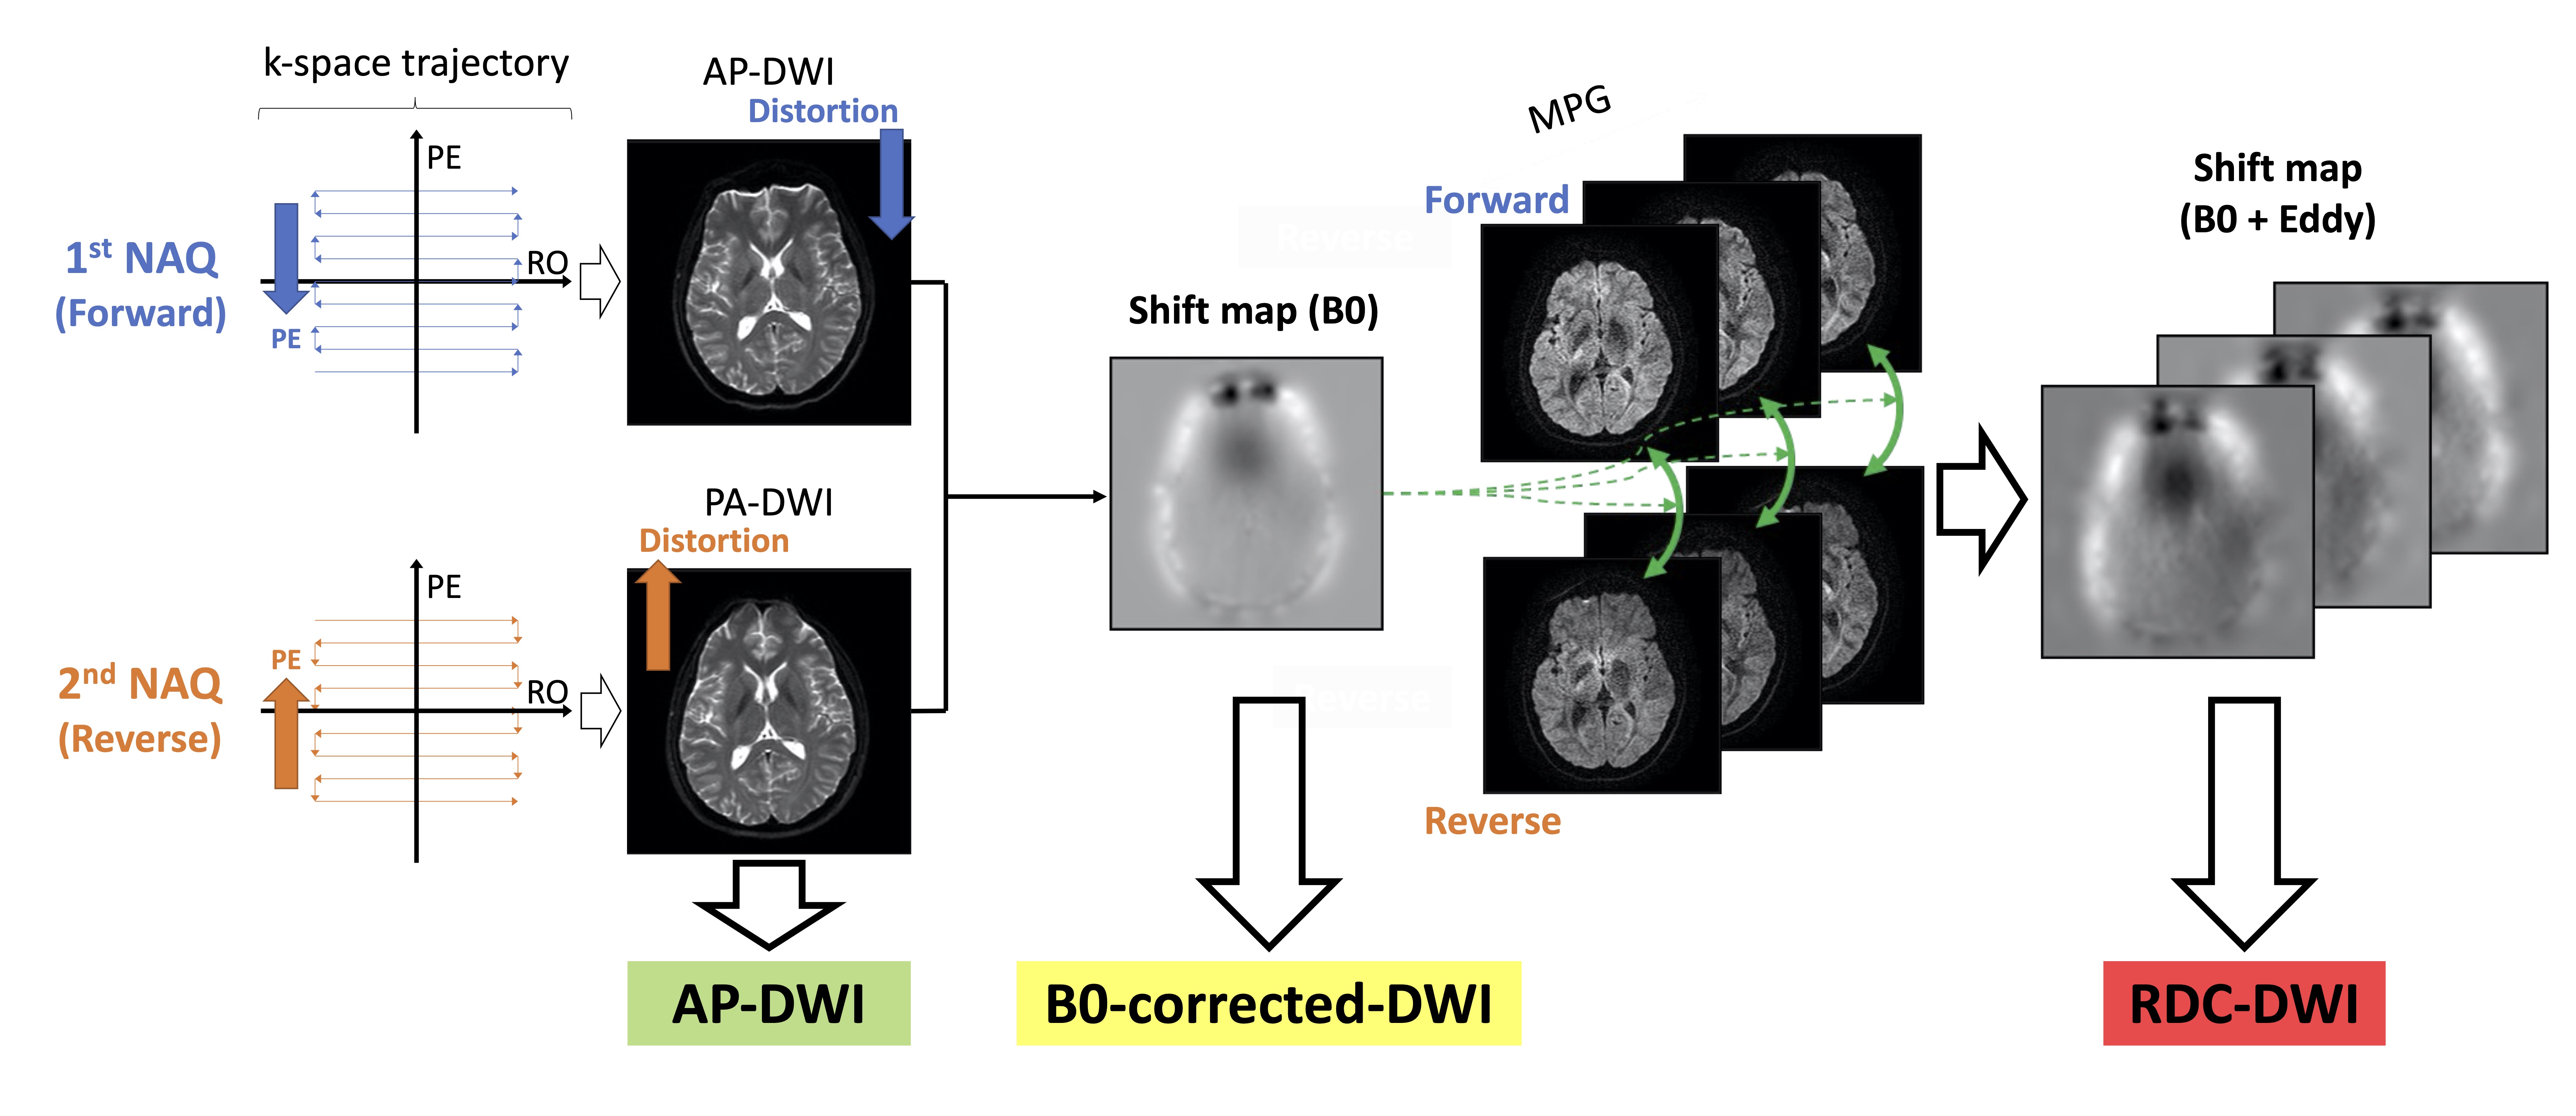
Diffusion-weighted imaging (DWI) is clinically useful in the pre- and postoperative evaluation of pituitary macroadenoma [1, 2]. However, EPI-based DWI is prone to geometric distortion due to susceptibility artifacts in areas where B0 field inhomogeneity presents, such as near air-bone interfaces [3]. FSL’s TOPUP algorithm (FSL, https://fsl.fmrib.ox.ac.uk/fsl/fslwiki/FSL) has been widely used for distortion correction using b0 images with top-down and bottom-up phase encoding polarity [4]. Although FSL’s TOPUP is off-line processing, on-console correction of eddy current-induced distortion using dual phase encoding polarity of both motion probing gradient (MPG) images and b0 images, called reverse encoding distortion correction DWI (RDC-DWI), has been recently developed.The purpose of this study is to evaluate the clinical usefulness of RDC-DWI for patients with non-functioning pituitary macroadenoma, compared with DWI which has only correction for distortion in the phase encode direction induced by static field inhomogeneity (B0-corrected-DWI), and original DWI with anterior-posterior phase encoding direction (AP-DWI).Methods
SubjectsForty-eight patients (mean age 70.3, range 39-89 years; 24 women) with unoperated non-functioning pituitary macroadenoma or residual pituitary macroadenoma after surgery who underwent MR imaging including RDC-DWI between December 2021 and August 2022 were enrolled. This retrospective study was approved by the institutional review board. Informed consent was waived due to the retrospective nature of this study.
Image Acquisition
Scan was conducted using the 3T MR scanner (Canon Medical Systems Corporation, Vantage Centurian) with a 32-channel head coil. Imaging parameters were as follows: axial acquisition; b value, 0, 1000 s/mm2; TR/TE, 3850/65 ms; FA, 90°; FOV, 220 × 220 mm2; voxel size, 0.7 × 0.7 × 1.2 mm3; number of slices, 35; band width, 1563 Hz/pixel; number of acquisition, 2 (1st, AP-DWI; 2nd, PA-DWI), b0 with 16 MPG directions; PI acceleration factor, 3×; acquisition time, 4 min 15 sec. RDC-DWI is created from both AP-DWI and PA-DWI on-console within 3 min after the image acquisition (Figure 1). B0-corrected-DWI is also created in a retrospective manner from AP-DWI and PA-DWI using the b0 image. 3D-T2WI: sagittal acquisition; TR/TE, 2800/80 ms; FA, 90°, FOV, 220 × 220 mm; voxel size, 0.34 × 0.34 × 0.8 mm3.
Image Analysis
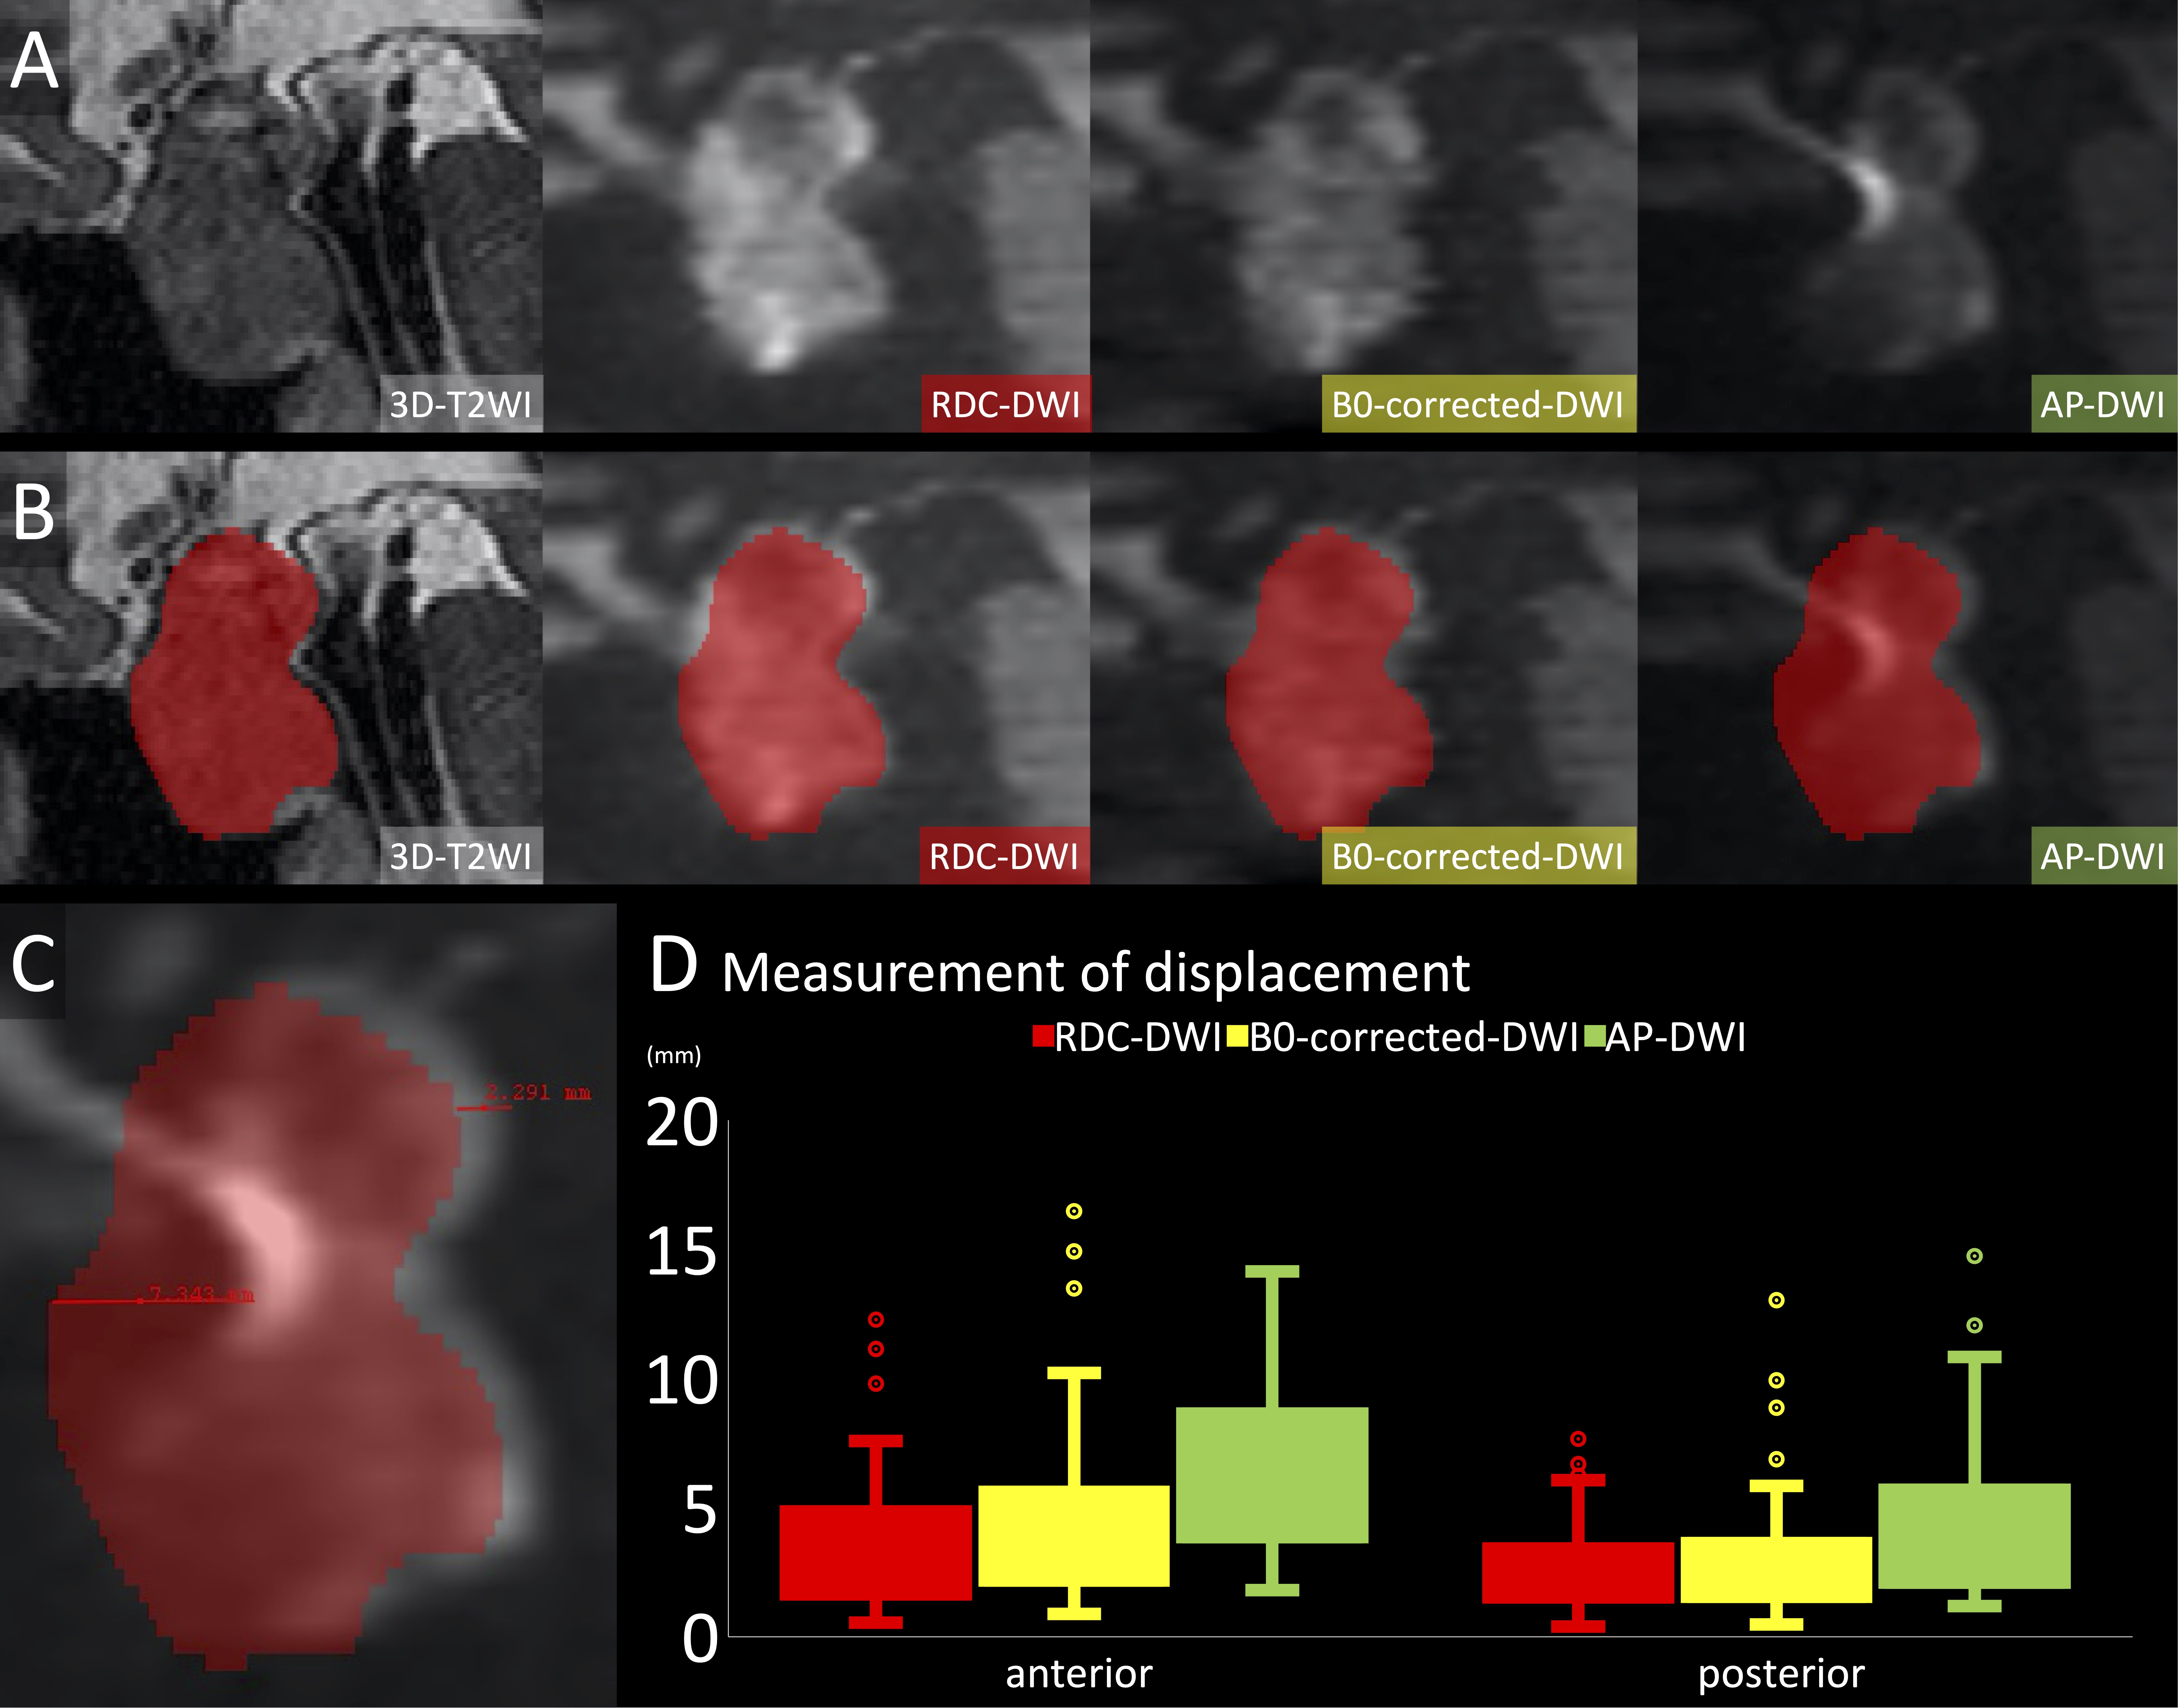
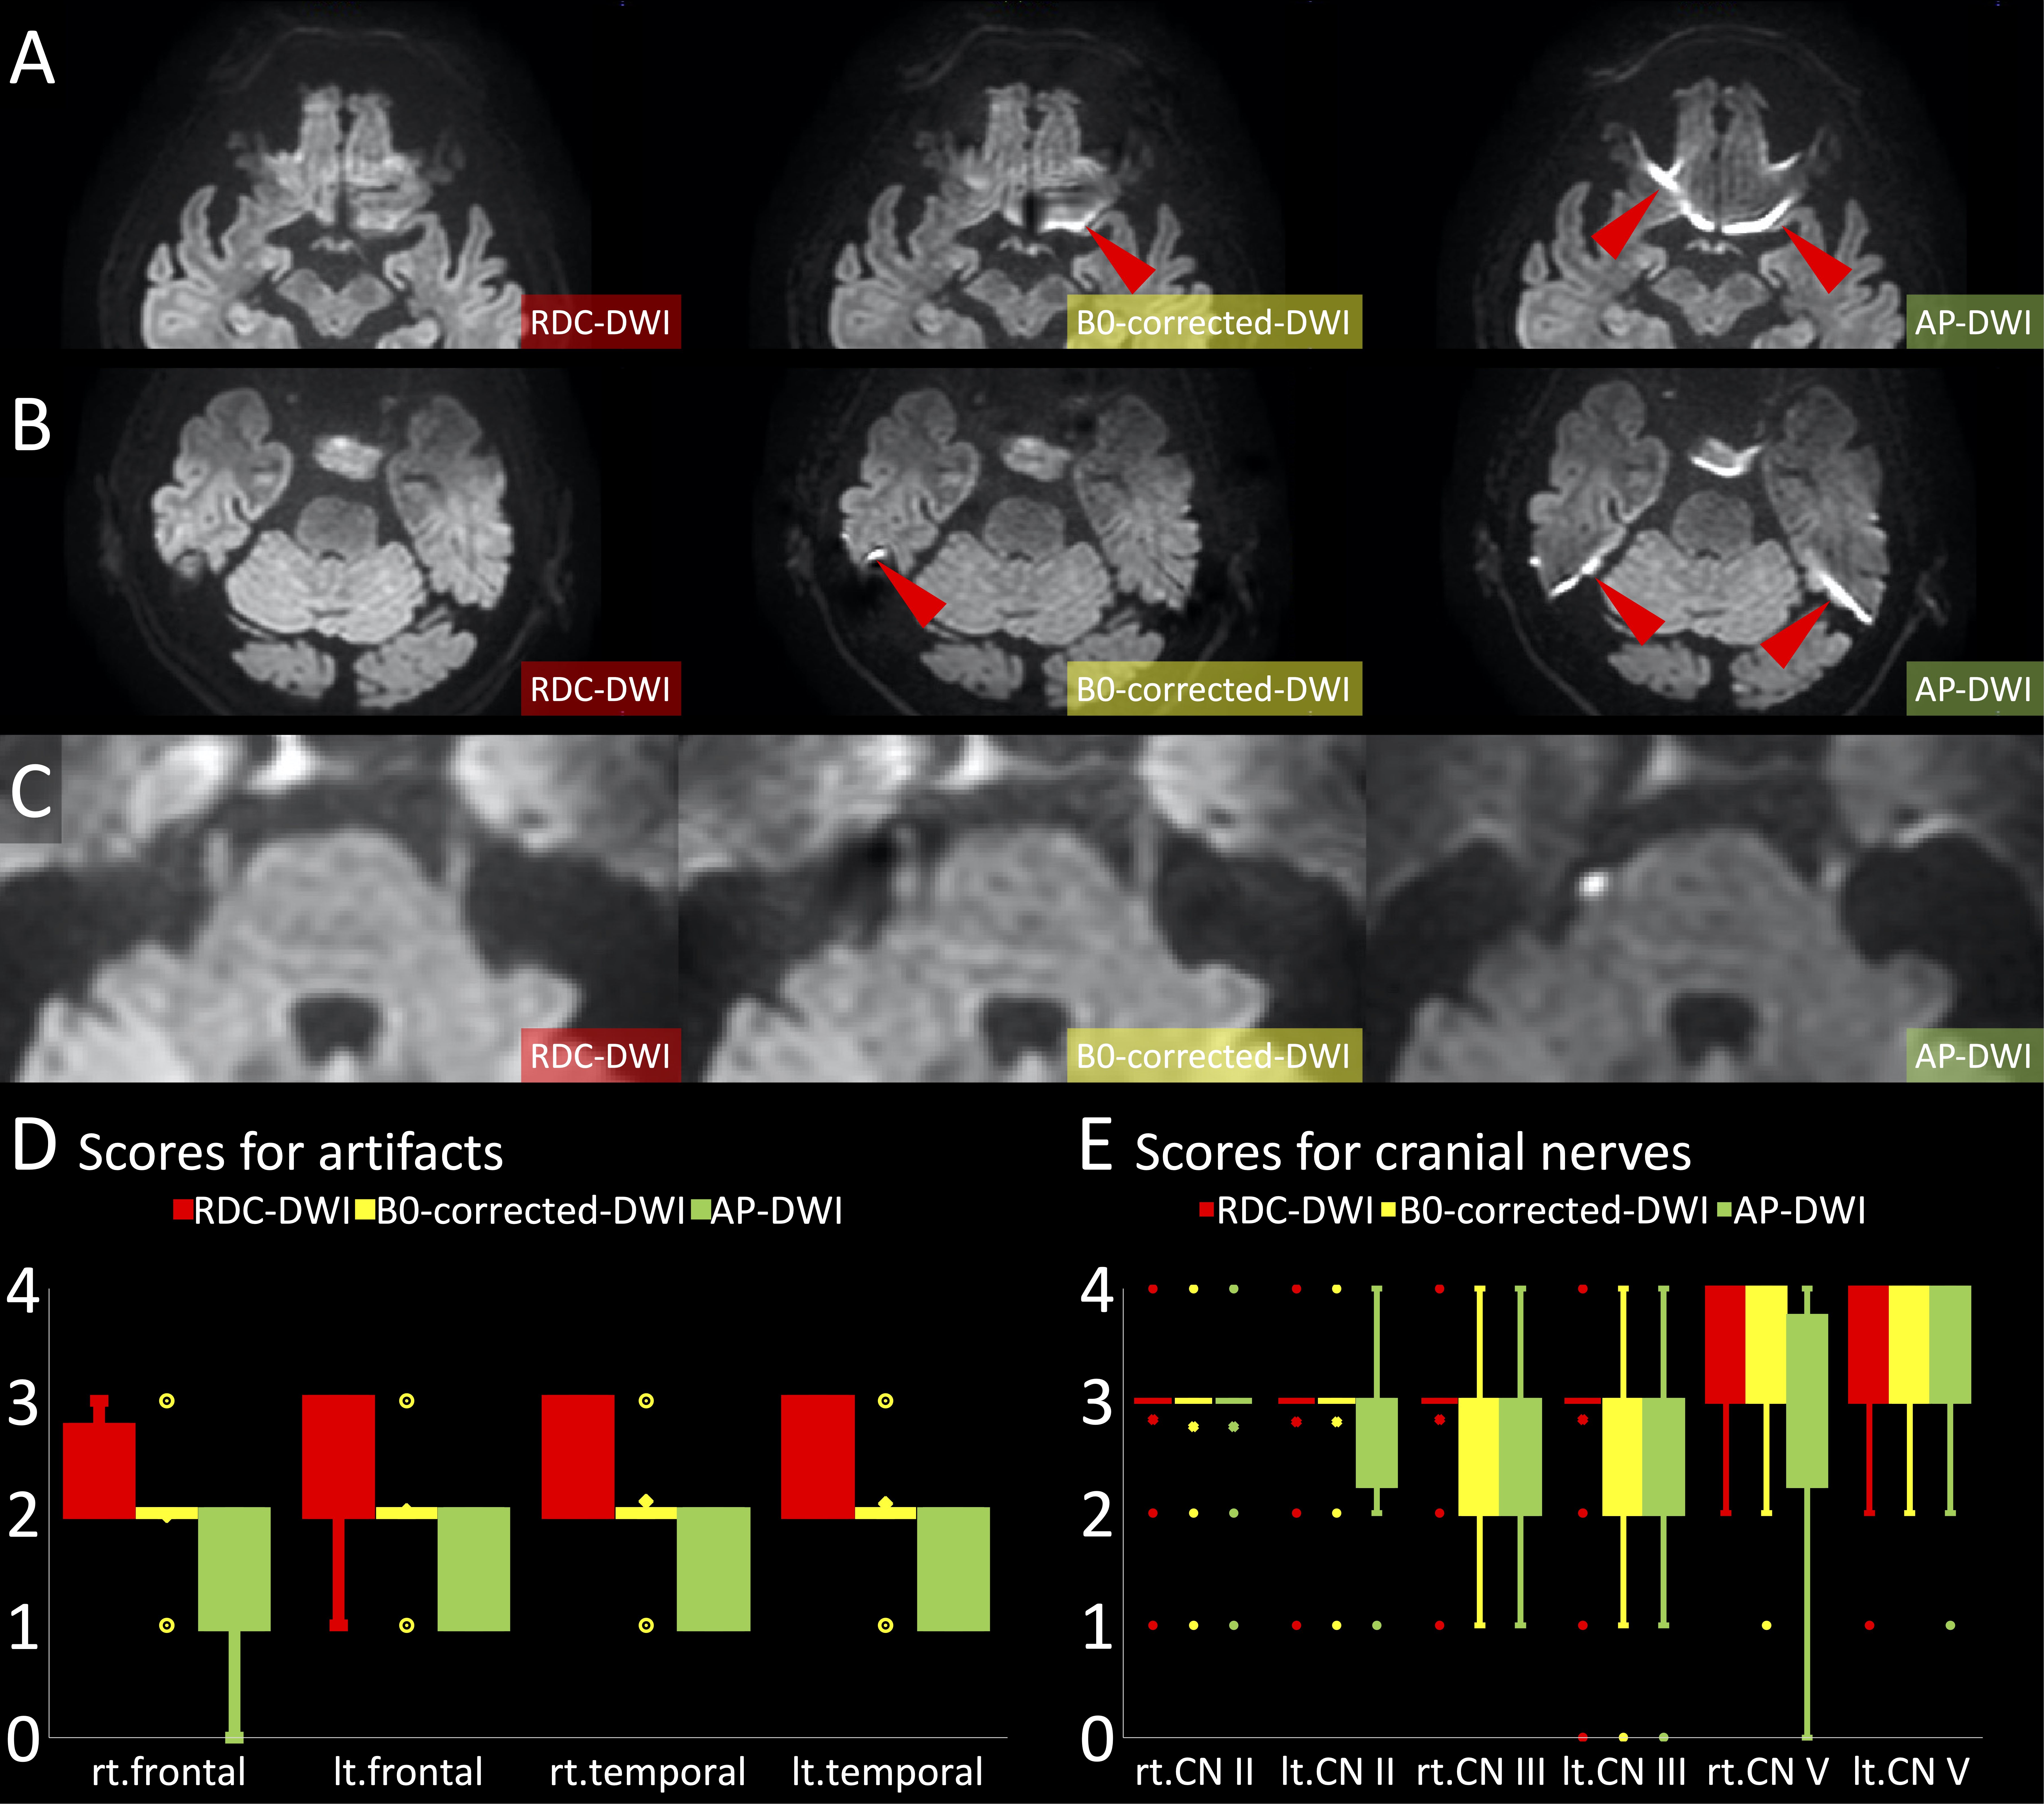
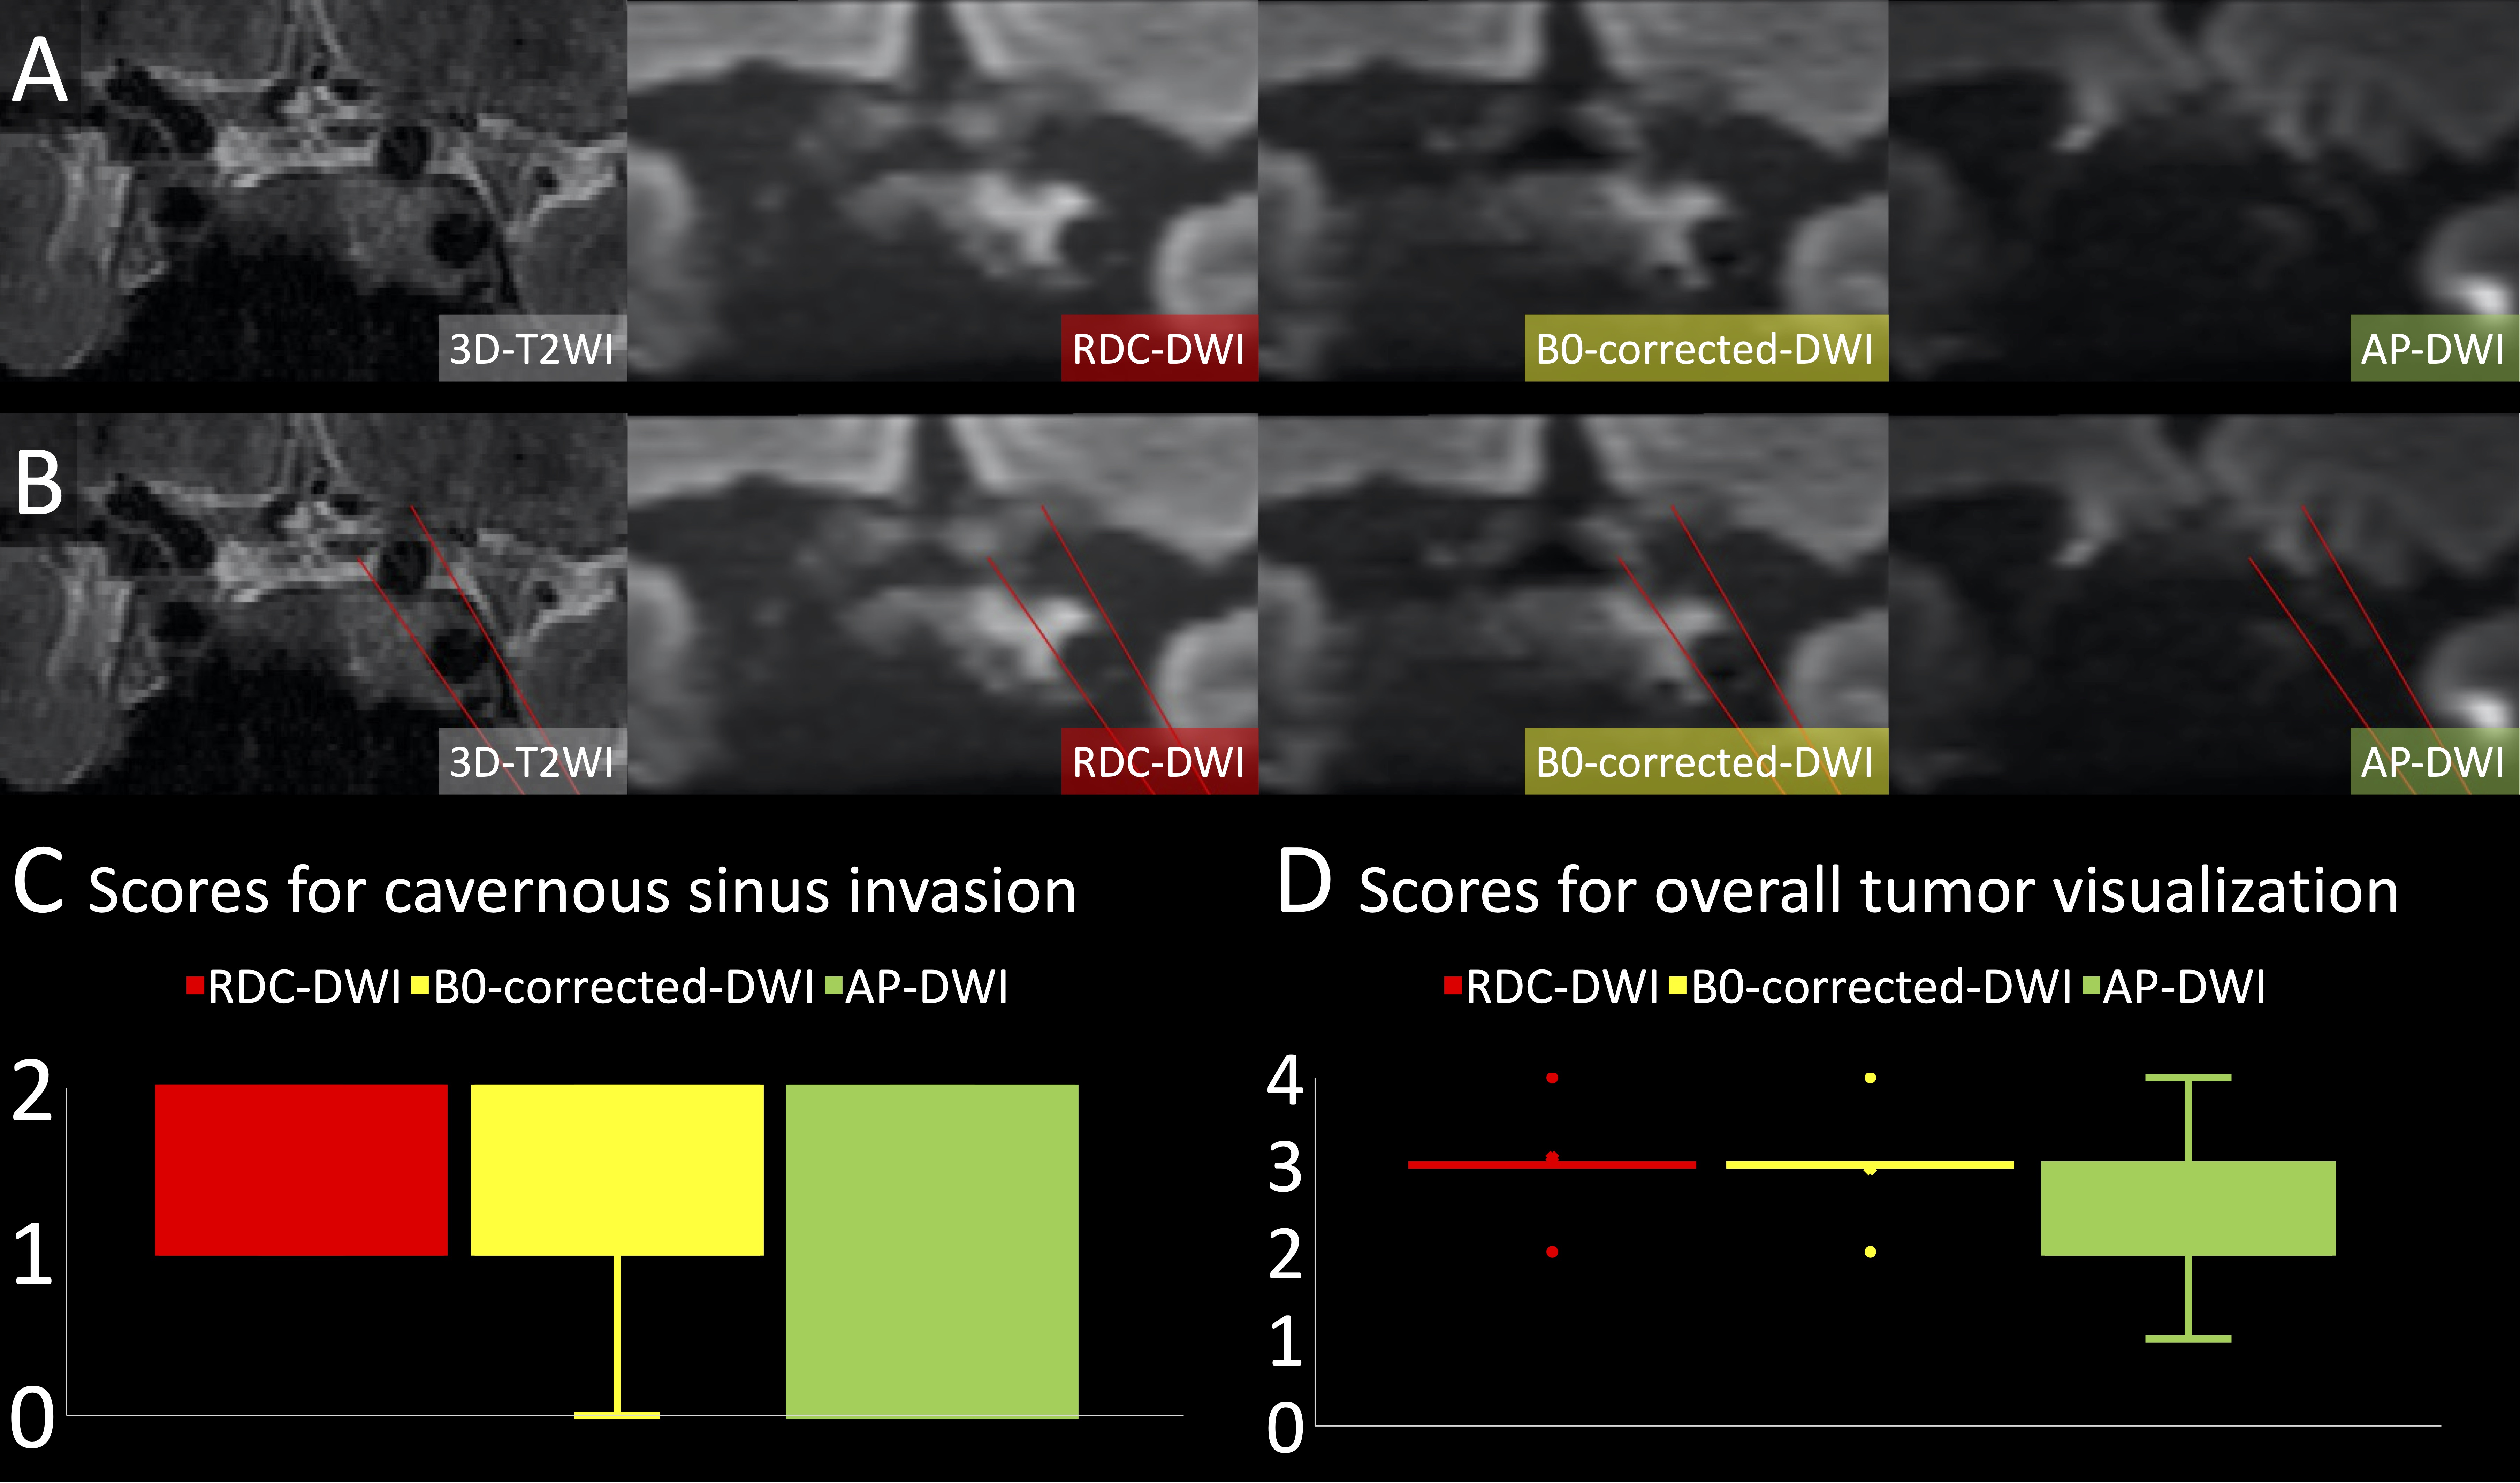
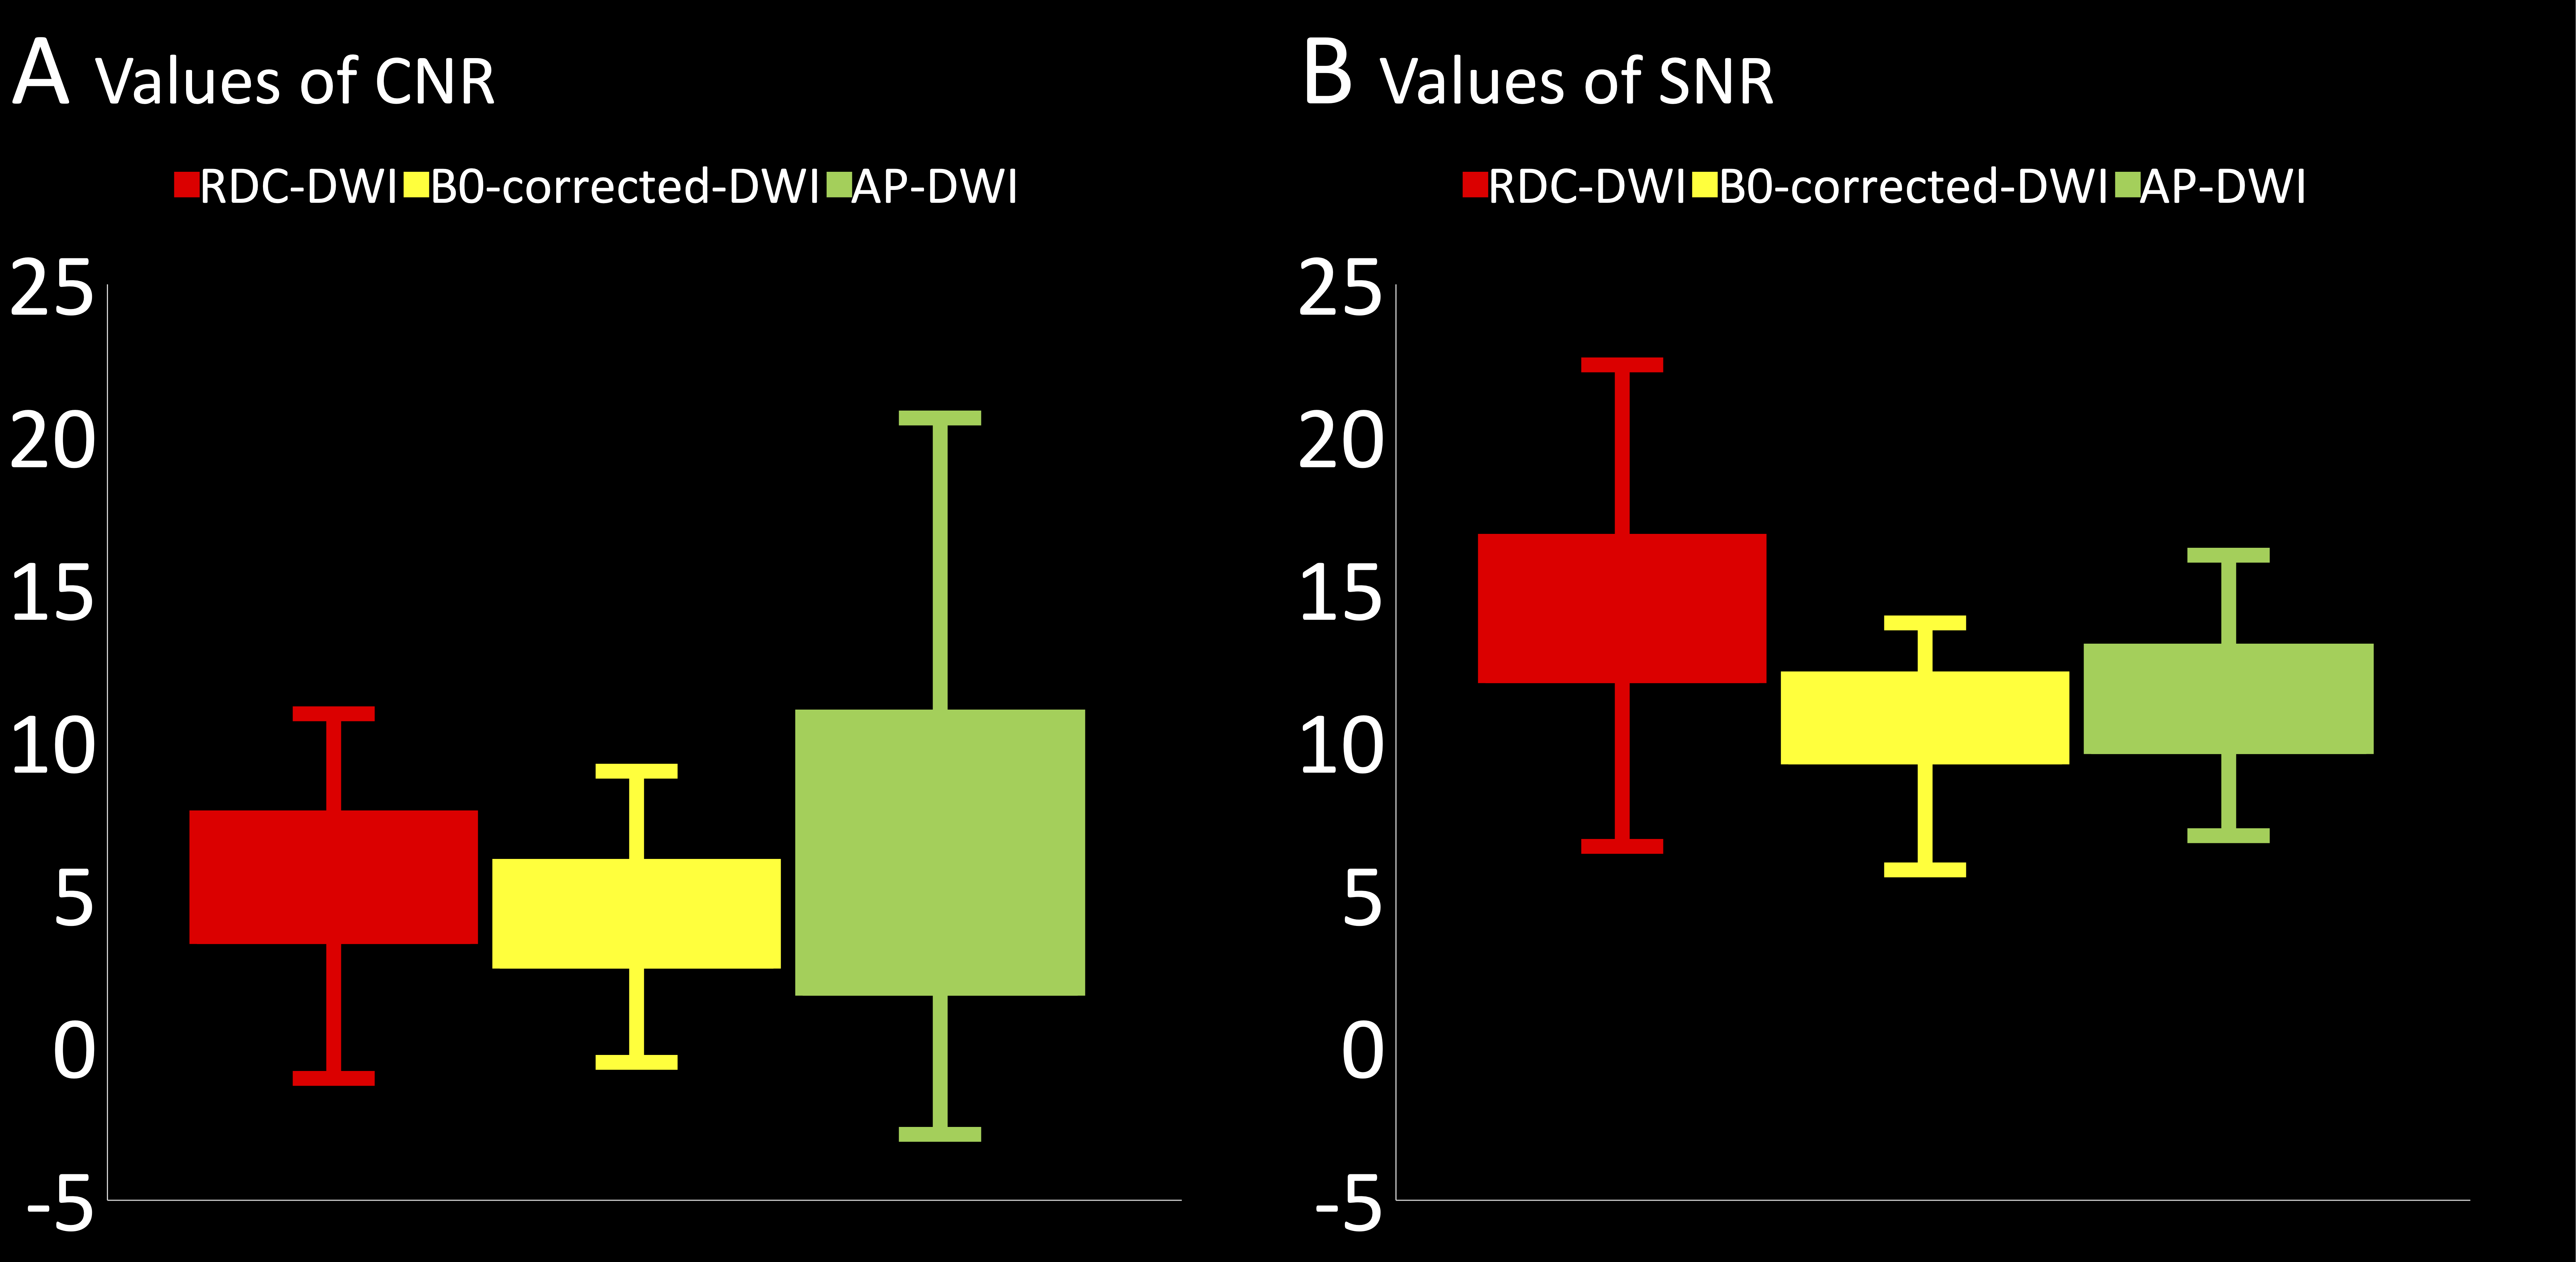
The distortion was quantitatively examined for measuring the anterior and posterior displacement between 3D-T2WI and each DWI in pituitary macroadenomas using ITK-SNAP (http://www.itksnap.org/) (Figure 2). Susceptibility artifact in the frontal lobe and temporal lobe, and anatomic visualization of the optic nerve, oculomotor nerve and trigeminal nerve, and overall tumor visualization were assessed qualitatively using a 5-point Likert scale (0, very poor; 1, poor; 2, fair; 3, good; 4, excellent) [5]. Visualization of cavernous sinus invasion was assessed qualitatively using a 3-point Likert scale (0, poor; 1, good; 2, excellent) [6]. Regions-of-interest (ROIs) were placed on the solid portion of the pituitary adenoma and the pons in the ADC maps. Signal-to-noise ratio (SNR) and contrast-to-noise ratio (CNR) were calculated as SNR = SIpons/ SDpons and CNR = SIlesion - SIpons/ SDpons. SIlesion and SIpons represent the mean signal intensities of solid portion of pituitary adenoma and pons, respectively. SDpons reperesents the standard deviation of pons.
Statistical Analysis
Distortion and scores were compared among the three DWI images (RDC-DWI, B0-corrected-DWI, and AP-DWI) using the Friedman test followed by multiple comparisons. The SNR and CNR were compared among the three DWI sequences using one-way repeated measures analysis of variance (ANOVA) followed by pairwise comparisons with Bonferroni correction. A p-value less than 0.05 was considered statistically significant. Statistical analysis was performed using MedCalc version 20.
Results
Distortion was significantly least in RDC-DWI and statistically less in B0-corrected-DWI than in AP-DWI (Figure 2). Scores for susceptibility artifacts in the frontal lobe and temporal lobe were best in RDC-DWI and better in B0-corrected-DWI than in AP-DWI (Figure 3). Scores for anatomic visualization of optic nerves and left oculomotor nerves had no statistical difference among the three DWI sequences, whereas scores for anatomic visualization of right oculomotor nerves and trigeminal nerves were best in RDC-DWI (Figure 3). Scores for cavernous sinus invasion and overall tumor visualization were better in RDC-DWI and B0-corrected-DWI than AP-DWI, and RDC-DWI and B0-corrected-DWI had no statistical difference (Figure 4). CNR was highest in AP-DWI, however, it had no statistical difference between AP-DWI and RDC-DWI (Figure 5). SNR was highest in RDC-DWI (Figure 5).Discussion
Distortion and susceptibility artifacts were significantly least in RDC-DWI. Scores for cavernous sinus invasion and overall tumor visualization were better in RDC-DWI and B0-corrected-DWI than in AP-DWI. In addition, SNR was the highest in RDC-DWI because both phase encoding polarity images are combined in it. These results suggested that novel RDC-DWI was advantageous in evaluating the tumor extension and predicting the consistency of the tumor more accurately. The high imaging quality in RDC-DWI resulted from distortion correction due to both eddy current in applying MPG images and b0 images. On-console distortion correction of RDC-DWI is convenient and clinically feasible compared with the existing distortion correction tools.Conclusion
RDC-DWI has the best image quality regarding distortion, susceptibility artifacts and overall tumor visualization in patients with unoperated non-functioning macroadenoma or residual non-functioning pituitary macroadenoma after surgery. These results suggest that RDC-DWI facilitates accurate visualization in the pituitary region on DWI.Acknowledgements
No acknowledgement found.References
1. Pierallini A, Caramia F, Falcone C, et al. Pituitary macroadenomas: Preoperative evaluation of consistency with diffusion-weighted MR imaging – initial experience. Radiology 2006; 239: 223-231.
2. Boxerman JL, Rogg JM, Donahue JE, et al. Preoperative MRI evaluation of pituitary macroadenoma: Imaging features predictive of successful transsphenoidal surgery. AJR 2010; 195: 720-728.
3. Khant ZA, Azuma M, Kadota Y, et al. Evaluation of pituitary structures and lesions with turbo spin-echo diffusion-weighted imaging. J Neurol Sci 2019; 405: 116390.
4. Andersson JLR, Skare S and Ashburner J. How to correct susceptibility distortion in spin-echo echoplanar images: application to diffusion tensor imaging. NeuroImage 2003; 20: 870-888.
5. Fu Q, Kong XC, Liu DX, et al. Clinical comparison of single-shot EPI, readout-segmented EPI and TGSE-BLADE for diffusion-weighted imaging of cerebellopontine angle tumors on 3 tesla. Magn Reson Imaging 2021; 84: 76-83.
6. Kim M, Kim HS, Kim HJ, et al. Thin-slice pituitary MRI with deep learning-based reconstruction: Diagnostic performance in a postoperative setting. Radiology 2021; 298: 114-122.
Figures