1326
Stability of Elevated Wall Shear Stress in Patients with Bicuspid Aortic Valve: Insights from a Multi-Year 4D Flow MRI Follow-Up Study1Department of Radiology, Northwestern University, Chicago, IL, United States, 2Department of Radiology, University of Colorado, Aurora, CO, United States
Synopsis
Keywords: Flow, Valves
4D Flow MRI can identify aortic regions exposed to high wall shear stress (WSS) compared to age and sex-matched controls. This concept, known as WSS ‘heatmaps’, has recently shown potential to improve risk stratification in patients with bicuspid aortic valve (BAV). We examined the reproducibility of heatmaps in a cohort of 20 stable BAV patients with five consecutive 4D flow MRI scans and found no significant change over time. In addition, we found high reproducibility of WSS patterns and regions of elevated WSS across scans. Our findings, therefore, suggest that heatmaps can serve as a robust BAV risk measure.Introduction
Bicuspid aortic valve (BAV) is associated with progressive growth of the ascending aorta (AAo) which can lead to severe complications such as aneurysm formation or dissection1. 4D flow studies have demonstrated that BAV morphology results in abnormal transvalvular flow patterns that lead to changes in aortic wall shear stress (WSS), a known stimulus of aortic growth through tissue degeneration and elastin fiber thinning2,3. To detect regional changes in aortic WSS outside the normal physiologic range and to account for well-known WSS changes with age and sex, we previously developed a heatmap approach. By co-registering the WSS of an individual patient to the WSS distribution of an age and sex-matched control population, ‘heatmaps’ can be derived to delineate regions of abnormally low/high WSS (i.e., outside the 95% confidence interval of the control population)4.This concept has recently been applied in a longitudinal BAV patient study, showing that baseline heatmaps could identify patients at risk for aortic growth5. To serve as a robust baseline risk metric and given the slow published rates of aortic growth in BAV (0.24-0.4mm/year), it is critical to understand the reproducibility and stability of heatmaps over time. Hence, the purpose of this study was to evaluate changes in heatmaps in a multi-scan follow-up study in a cohort of clinically stable BAV patients who underwent five consecutive cardiothoracic MRIs, including 4D flow MRI. Our goal was to assess the reproducibility of heatmaps for the quantification of the relative area exposed to elevated WSS in the AAo.
Methods
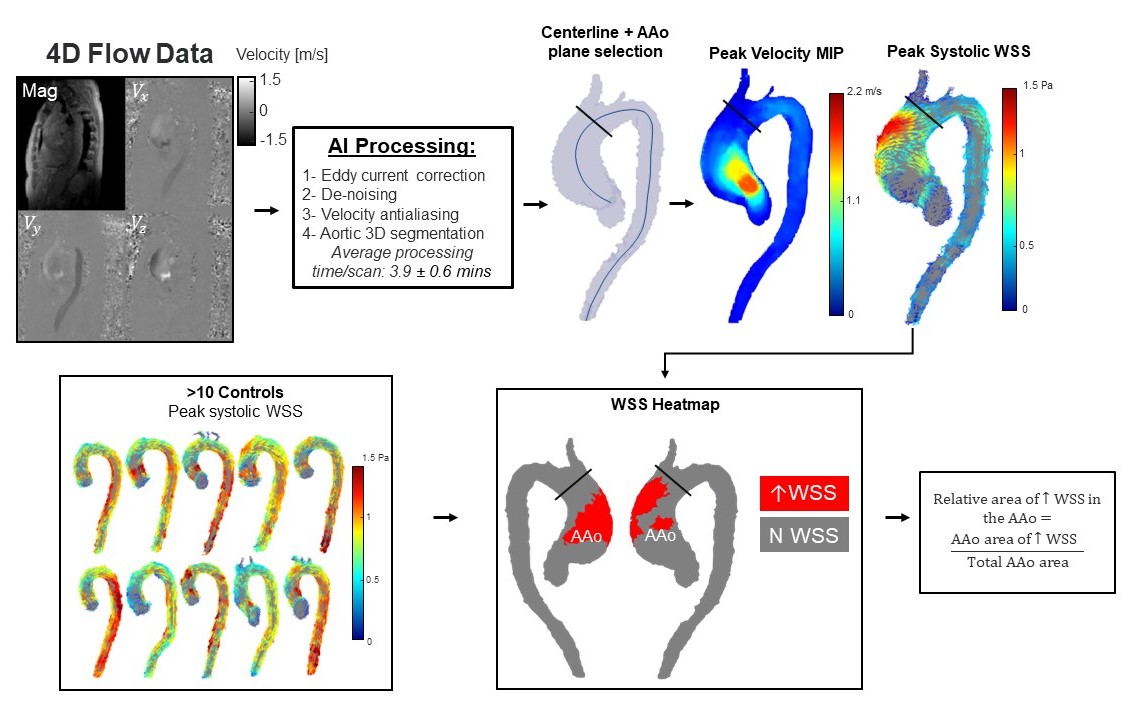
BAV patients with five cardiothoracic MRIs, including 4D flow MRI, were retrospectively identified. The exclusion criteria were patients with any two consecutive scans <6 months apart, connective tissue disease, or aortic/valve surgery. Mid-AAo diameters were extracted from the radiology report of the first and fifth scans to calculate AAo growth rates (GR). To compute maps for physiologically normal aortic WSS, healthy controls (n=125, age: 50.7±15.8 years, 67M, 58F) with a normal aortic valve were included as part of an ongoing study. All MRIs were performed using 1.5 or 3.0T systems (Siemens, Germany) and included a sagittal oblique, prospectively ECG and respiratory-gated aortic 4D flow acquisition. Data were processed using an AI pipeline capable of correcting for eddy current, velocity noise and aliasing, and generating a 3D aortic segmentation6,7 (Figure 1). The AAo was then defined by placing a plane proximal to the brachiocephalic trunk, and the corresponding systolic peak velocity and WSS were calculated. As previously described, patient-specific WSS heatmaps were computed relative to a WSS map generated for each patient based on an atlas generated from the 4D flow-derived systolic WSS of 10 or more sex and age-matched controls (within ±5 years of patient age at the time of scan)5. The relative areas exposed to elevated WSS in the AAo (AAo area of elevated WSS/Total AAo area) were subsequently calculated for all scans.Statistical analysis
Normality was assessed with the Kolmogorov-Smirnov test. One-way repeated measures ANOVA was conducted to determine if there was a difference in peak velocity, WSS, and relative area of elevated WSS in the AAo between scans.
Results
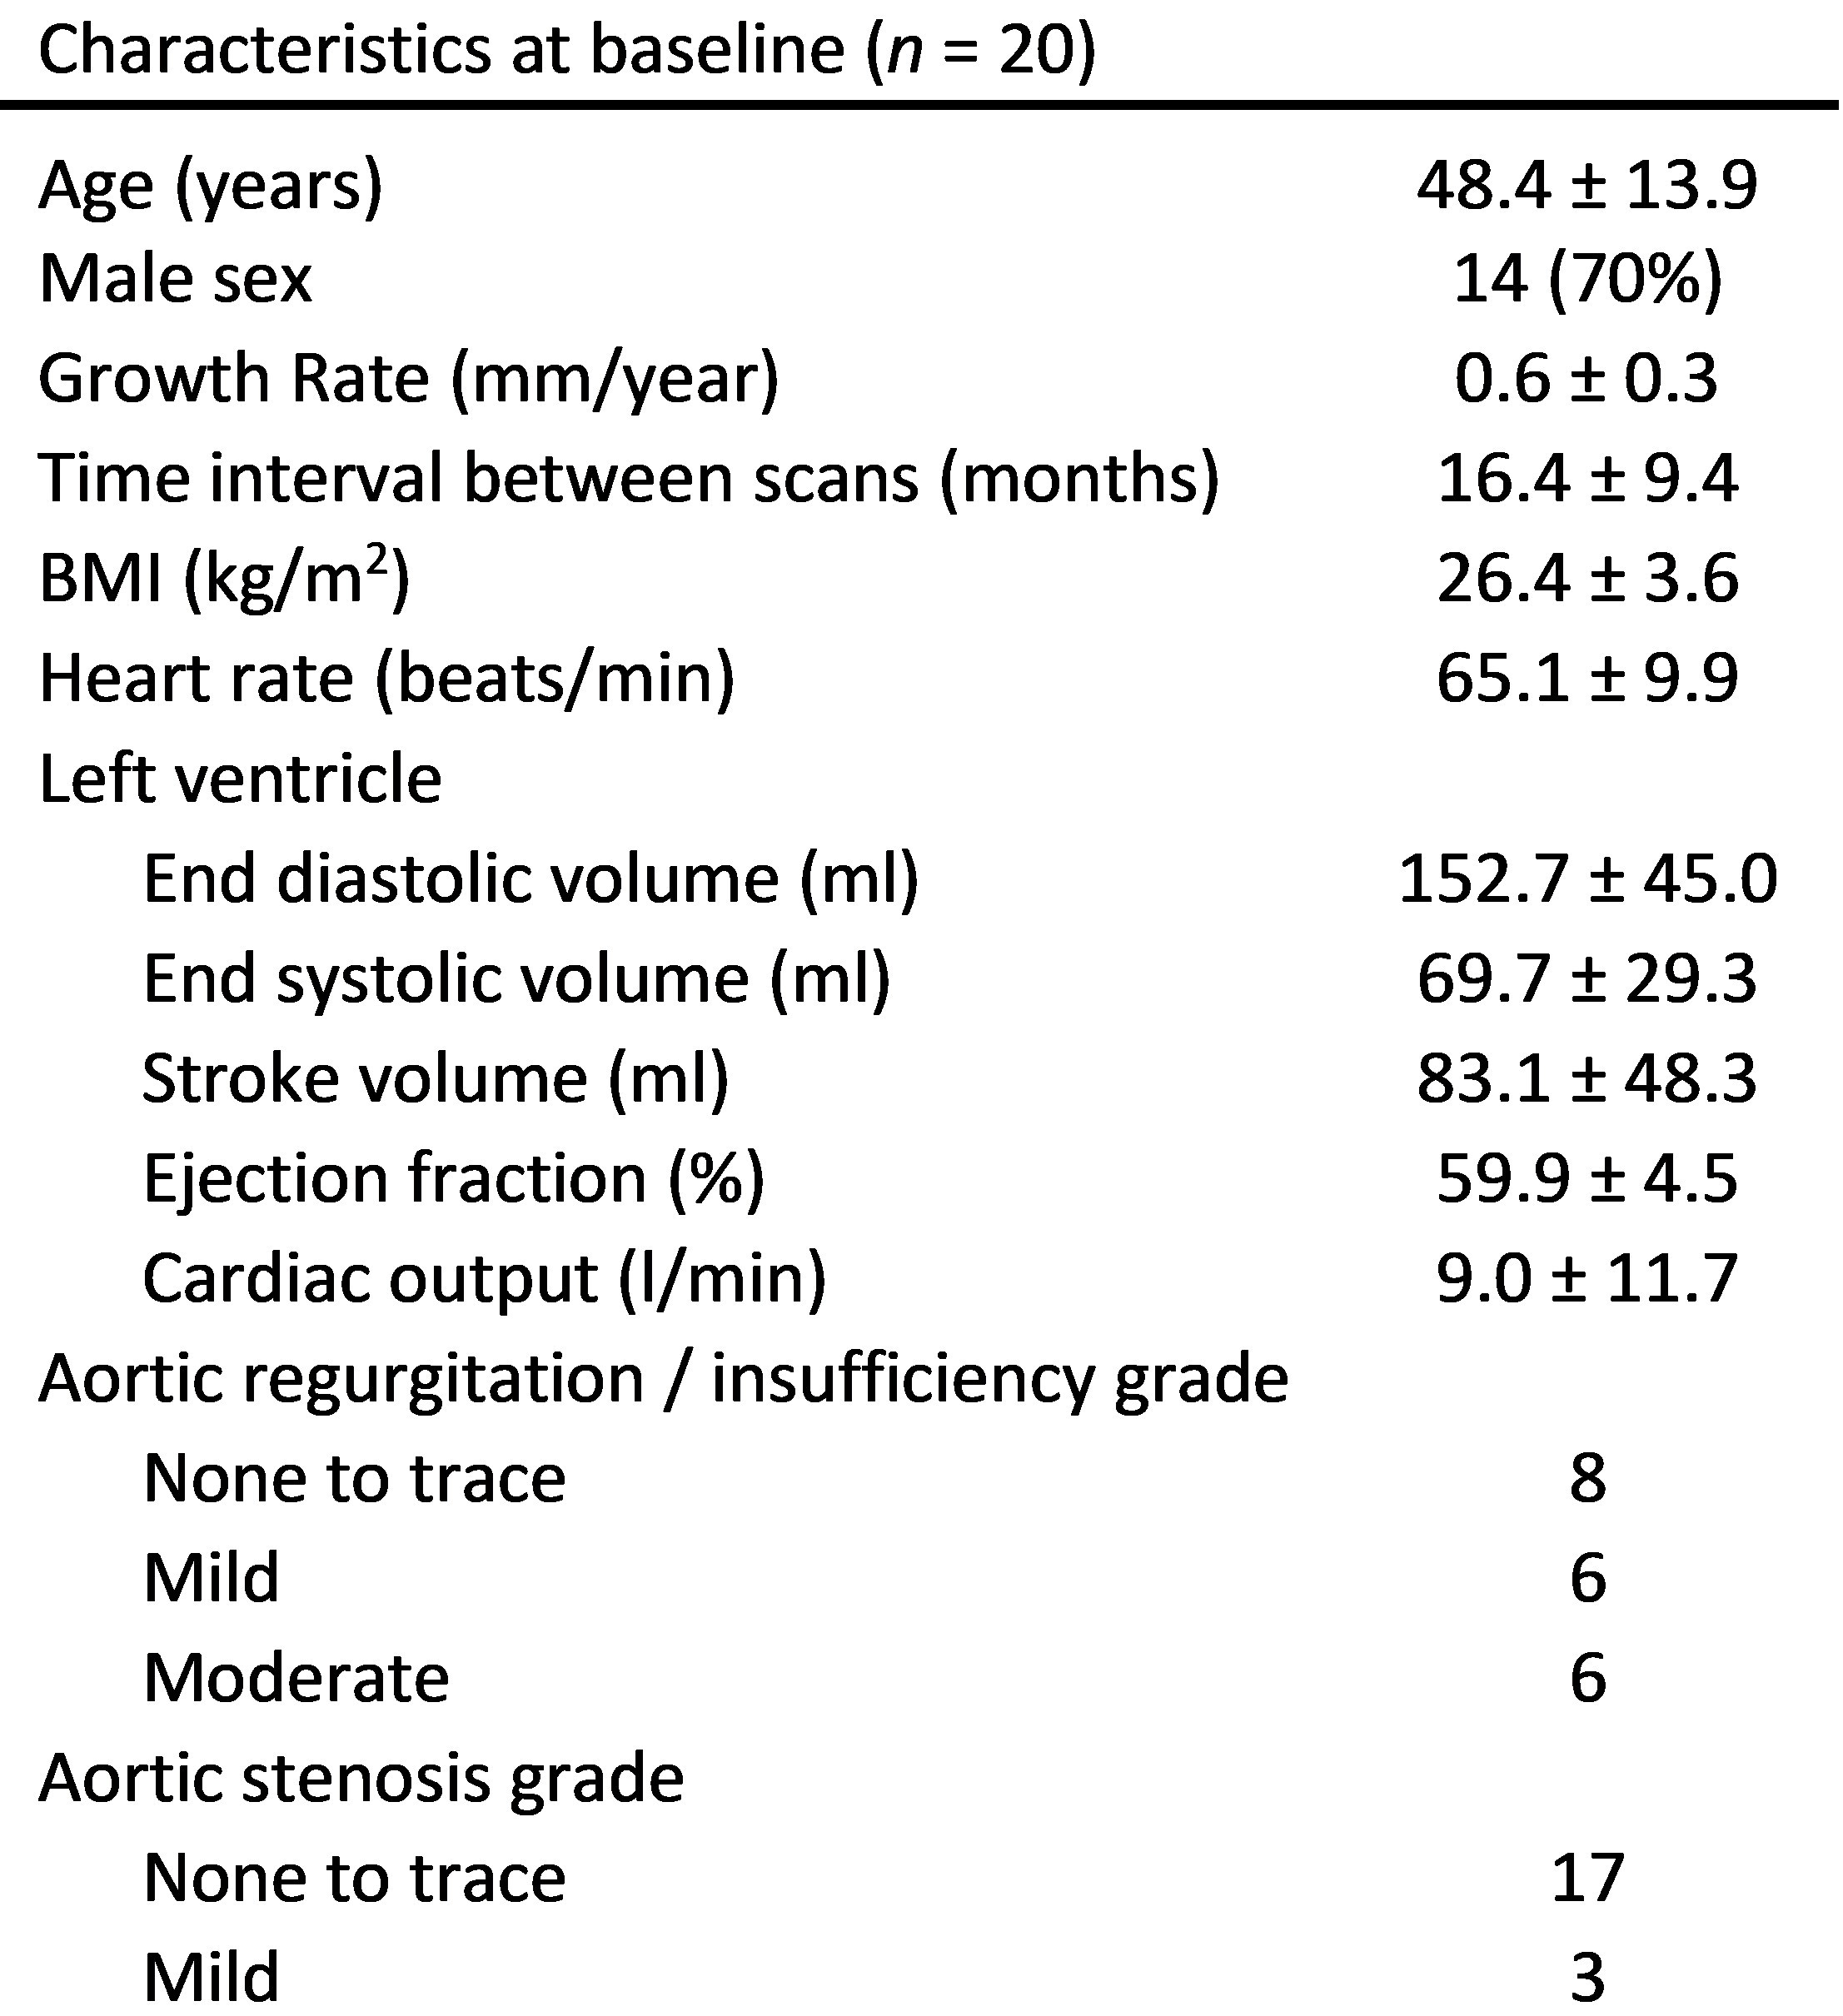
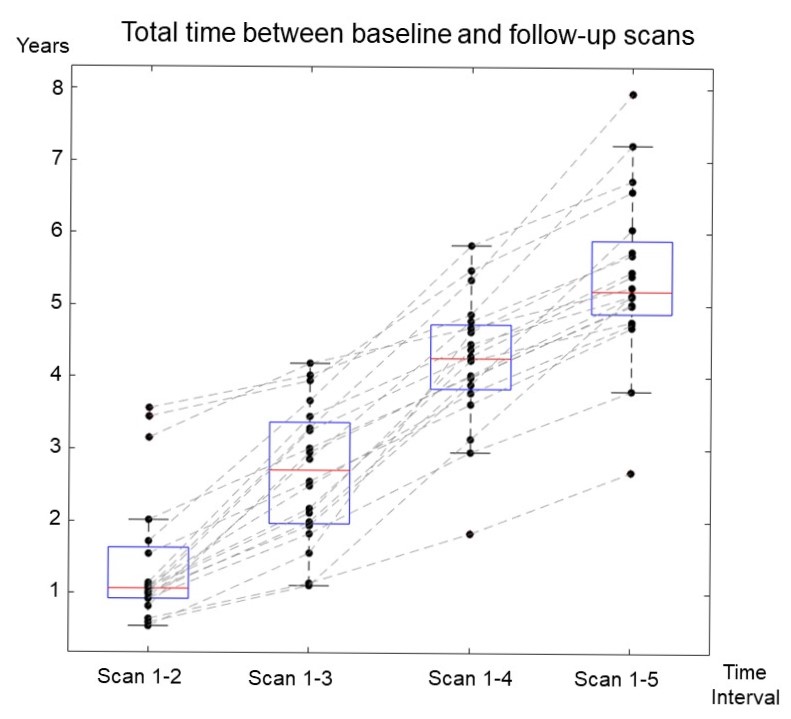
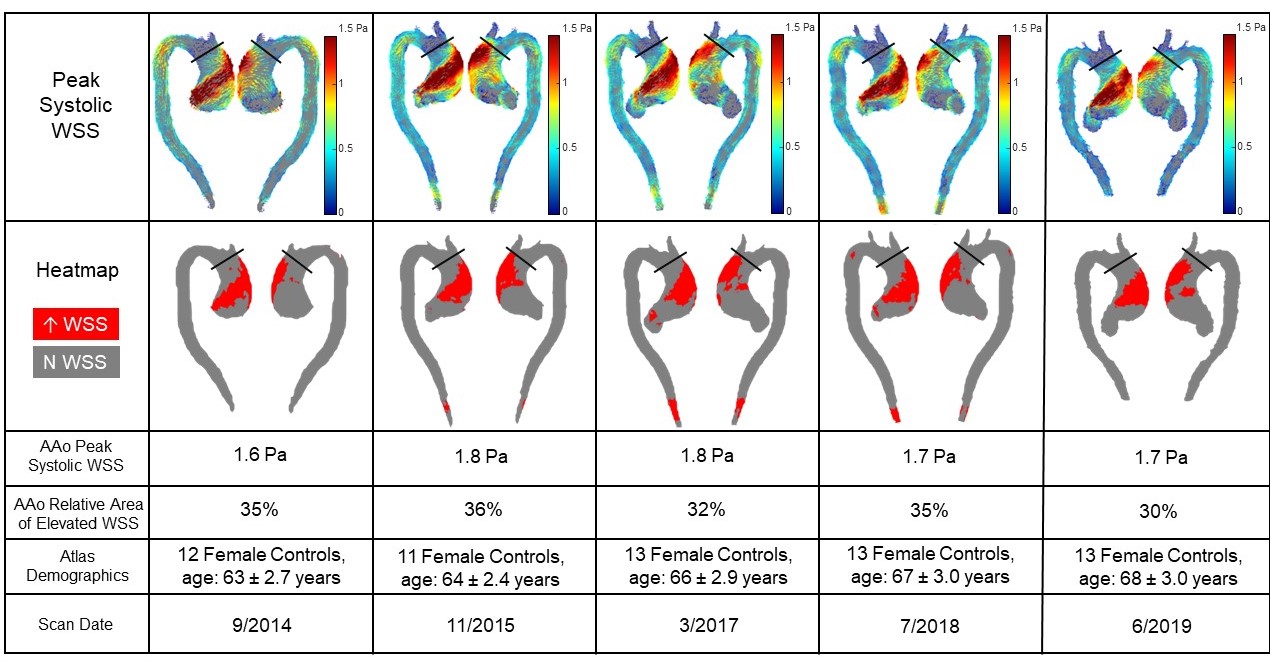
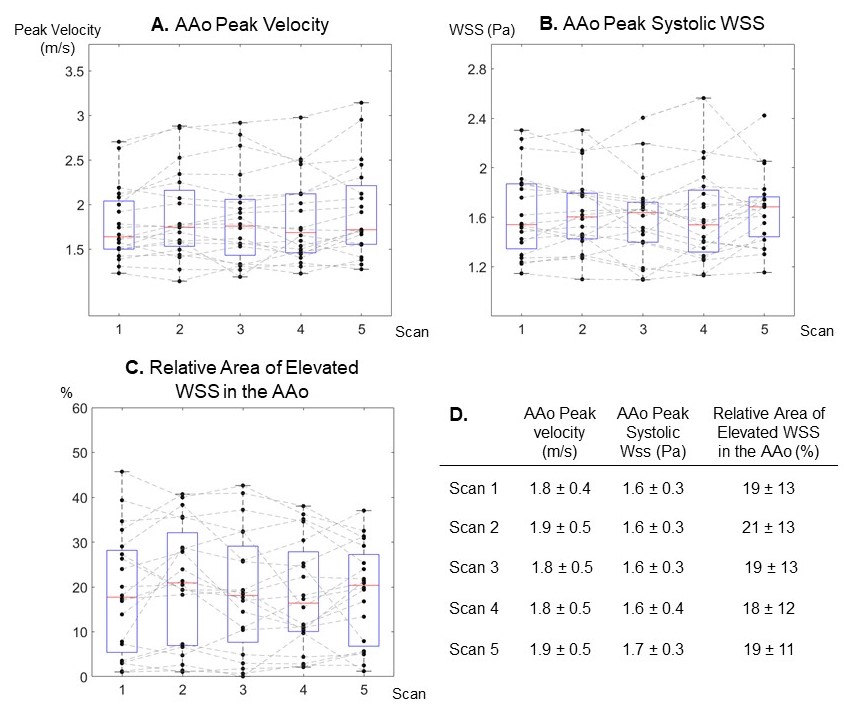
Twenty patients (age: 48.4±13.9 years, 14M) with n=100 4D flow MRIs (5/patient) acquired between 2011 to 2019 were included. Patients’ characteristics are shown in Table 1. Mean follow-up duration between the baseline MRI (scan 1) and scan 5 was 5.5±1.1 years (Figure 2). Mid-AAo diameters yielded an average AAo GR of 0.6±0.3 mm/year. Figure 3 displays an example BAV case with five consecutive scans and the corresponding WSS and heatmaps. The AAo WSS patterns and areas of elevated WSS were highly reproducible and stable over time. Findings across the entire study cohort are summarized in figure 4, which shows the multi-year distribution of peak velocity, WSS, and relative area of elevated WSS in the AAo. One-way repeated measures ANOVA showed no significance difference in peak velocity, WSS, and relative area of elevated WSS (p=0.64, p=0.69, and p=0.35, respectively) between all scans.Discussion
In recent years, the concept of WSS heatmaps has emerged as a promising biomarker for BAV aortopathy risk stratification. The goal of this study was to investigate heatmap reproducibility across multiple scans in a cohort BAV patients. All patients were clinically stable and had a GR below the 3mm/year threshold for surgery. It is notable, however, that these GR were higher on average than has been reported in studies with a follow-up period >5 years5,8. This may be due to interobserver bias, as aortic diameters were taken from radiology reports for this study. Relative area of elevated WSS showed no significant change over time. Notably, in most cases we detected not only a stable relative area across all 5 scans, but also similarities in the location and pattern of regions of elevated WSS. This suggests that the individualized approach to assess regional WSS is robust, reproducible, and able to delineate areas of abnormal WSS in an aging aorta.Conclusion
Elevated areas of WSS identified on heatmaps are reproducible and stable over time in clinically stable BAV patients. Therefore, our findings suggest that heatmaps are a robust measure that can be used for BAV risk assessment at any time of disease course.Acknowledgements
No acknowledgement found.References
1. Verma S, Siu SC. Aortic dilatation in patients with bicuspid aortic valve. N Engl J Med. 2014;370(20):1920-1929. doi:10.1056/NEJMra1207059
2. Bollache E, Guzzardi DG, Sattari S, et al. Aortic valve-mediated wall shear stress is heterogeneous and predicts regional aortic elastic fiber thinning in bicuspid aortic valve-associated aortopathy. J Thorac Cardiovasc Surg. 2018;156(6):2112-2120.e2. doi:10.1016/j.jtcvs.2018.05.095
3. Guzzardi DG, Barker AJ, van Ooij P, et al. Valve-Related Hemodynamics Mediate Human Bicuspid Aortopathy: Insights From Wall Shear Stress Mapping. J Am Coll Cardiol. 2015;66(8):892-900. doi:10.1016/j.jacc.2015.06.1310
4. Van Ooij P, Potters WV, Nederveen AJ, et al. A methodology to detect abnormal relative wall shear stress on the full surface of the thoracic aorta using four-dimensional flow MRI. Magn Reson Med. 2015;73(3):1216-1227. doi:10.1002/mrm.25224
5. Soulat G, Scott MB, Allen BD, et al. Association of Regional Wall Shear Stress and Progressive Ascending Aorta Dilation in Bicuspid Aortic Valve. JACC Cardiovasc Imaging. 2022;15(1):33-42. doi:10.1016/j.jcmg.2021.06.020
6. Berhane H, Scott MB, Barker AJ, et al. Deep learning-based velocity antialiasing of 4D-flow MRI. Magn Reson Med. 2022;88(1):449-463. doi:10.1002/mrm.29205
7. Berhane H, Scott M, Elbaz M, et al. Fully automated 3D aortic segmentation of 4D flow MRI for hemodynamic analysis using deep learning. Magn Reson Med. 2020;84(4):2204-2218. doi:10.1002/mrm.28257
8. Guala A, Dux-Santoy L, Teixido-Tura G, et al. Wall Shear Stress Predicts Aortic Dilation in Patients With Bicuspid Aortic Valve. JACC Cardiovasc Imaging. 2022;15(1):46-56. doi:10.1016/j.jcmg.2021.09.023
Figures