1319
Tortuosity and Proximal-specific Wall Shear Stress Associated with Plaque Location in Carotid Bulb: A High-resolution MRI and CFD Study1Department of Radiology, First Central Clinical School, Tianjin Medical University, Tianjin, China, 2Tianjin First Central Hospital, Tianjin, China
Synopsis
Keywords: Atherosclerosis, Blood vessels, computational fluid dynamics
This study was performed from a vessel wall imaging database, and investigated plaque characteristics, as well as geometric and hemodynamic parameters among different carotid bulb plaque locations caused by atherosclerosis. The results showed that wall shear stress (WSS) magnitudes around plaque side were lower than non-plaque side. Tortuosity of stenosed region, magnitudes of relative residence time and transverse WSS in the proximal part of the lesion were the key factors independently associated with plaque location. This suggested that plaque formation was associated with local flow pattern; and tortuosity, proximal-specific hemodynamics were significantly associated with plaque location in the carotid bulb.Introduction
The plaque location within the carotid bulb often is categorized as a body or apical lesion, depending on the area and extent of plaque involvement 1. Previous studies have demonstrated that plaque location in carotid bulb is associated with patterns of ischemic lesions and plaque progression 2-4, and it has drawn increasing clinical attention as an important indicator of ischemic stroke. However, the mechanism of the presence of plaque location remains unclear. Our goals included the following: to visually and quantitatively evaluate the specific local flow pattern around plaque in carotid bulb stenosis; to further demonstrate the relationship among hemodynamics, geometry, plaque characteristics, and plaque location; and to investigate whether hemodynamics and geometry can provide an incremental contribution to the different plaque locations.Methods
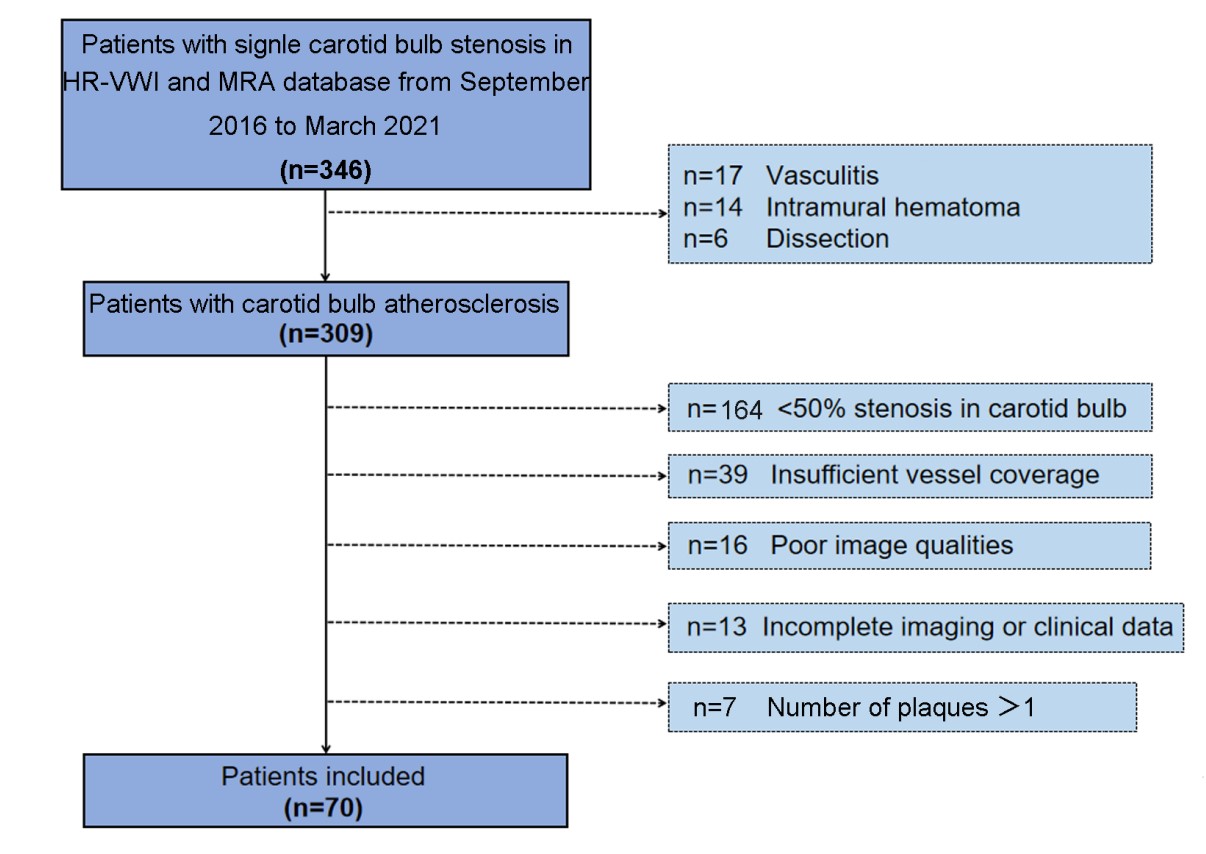
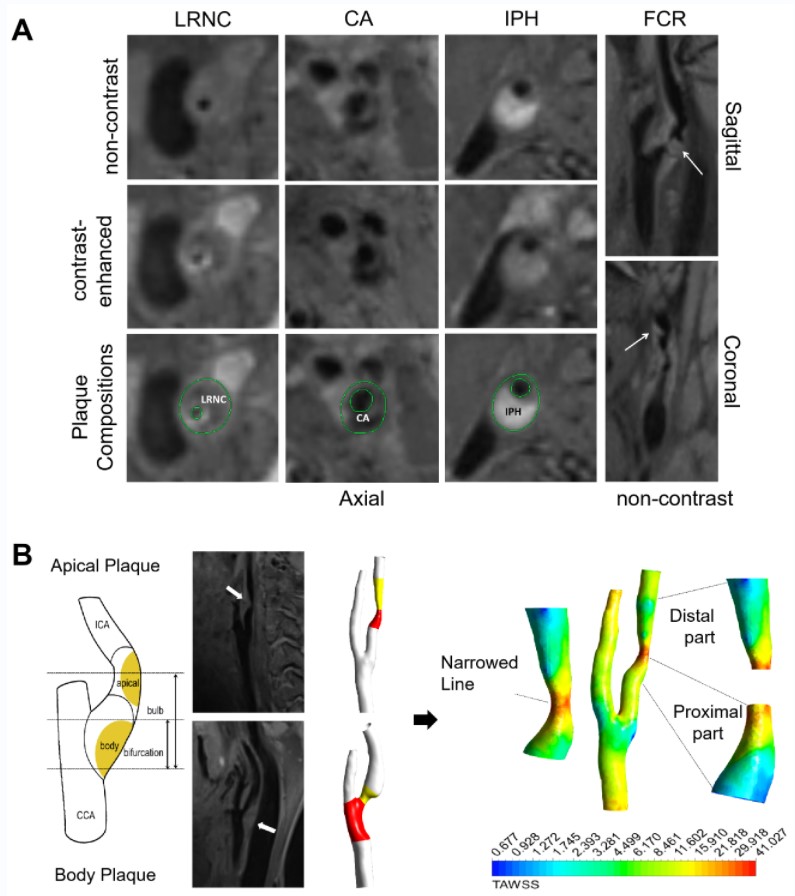
This study included 70 patients with single carotid bulb stenosis (50~99%) who underwent MRI on a 3T system (MAGNETOM Prisma; Siemens Healthcare, Erlangen, Germany) including Inversion-Recovery Prepared Sampling Perfection with Application-optimized Contrast using Different Flip Angle Evolutions (IR-SPACE) and Time-of-Flight MRA (TOF-MRA). The detailed inclusion and exclusion criteria were presented in Figure 1. High-resolution vessel wall imaging (HR-VWI) images were acquired by IR-SPACE. The parameters for IR-SPACE were as follows: repetition time (TR) = 900 ms; echo time (TE) = 15 ms; field of view = 240 × 210 mm2; matrix = 384 × 336; 240 slices with 0.55-mm slice thickness; reconstructed voxel size = 0.55 × 0.55 × 0.55 mm3; parallel acceleration factor = 2; bandwidth = 465 Hz/pixel; and acquisition time = 7 min 43 s. Plaque location, quantitative and qualitative analyses of plaque characteristics were evaluated on HR-VWI images (Figure 2A).Geometry Reconstruction was derived from the MRA images. A segmentation protocol was established using 3D Slicer (version 4.11; https://www.slicer.org). Using the vascular modelling toolkit extension for 3D Slicer, geometric parameters were further calculated, including bifurcation angle, ICA planarity, and the tortuosity of stenosed region.
Computational fluid dynamics (CFD) simulations were performed to quantify wall shear stress. The above vascular lumen models were imported into ICEM (ANSYS Inc, Canonsburg, USA) software, and to conduct finite volume analyses. The blood flow simulation was fulfilled by solving the Navier-Stokes and continuity equations in Fluent (ANSYS). Cross section was divided into plaque side and non-plaque side according to the plaque boundary on HR-VWI images. WSSplaque and WSSnone-plaque were defined as mean WSS magnitudes of plaque side and non-plaque side at the narrowest cross-sectional level of lumen respectively. We specifically measured four WSS-based metrics in the proximal part, distal part and most-severely narrowed level of the lesion, including time-averaged WSS, oscillatory shear index, relative residence time (RRT), and transverse WSS (transWSS). Details of CFD analysis were provided in Figure 2B.
Plaque characteristics, and geometric and hemodynamic parameters were compared among patients grouped by plaque location with Chi-squared or Mann-Whitney U tests, and their associations with plaque location were determined by multivariate binary logistic regression analysis. The receiver operating characteristic curve was used to evaluate association with the presence of body plaque. p < 0.05 was considered statistically significant.
Results
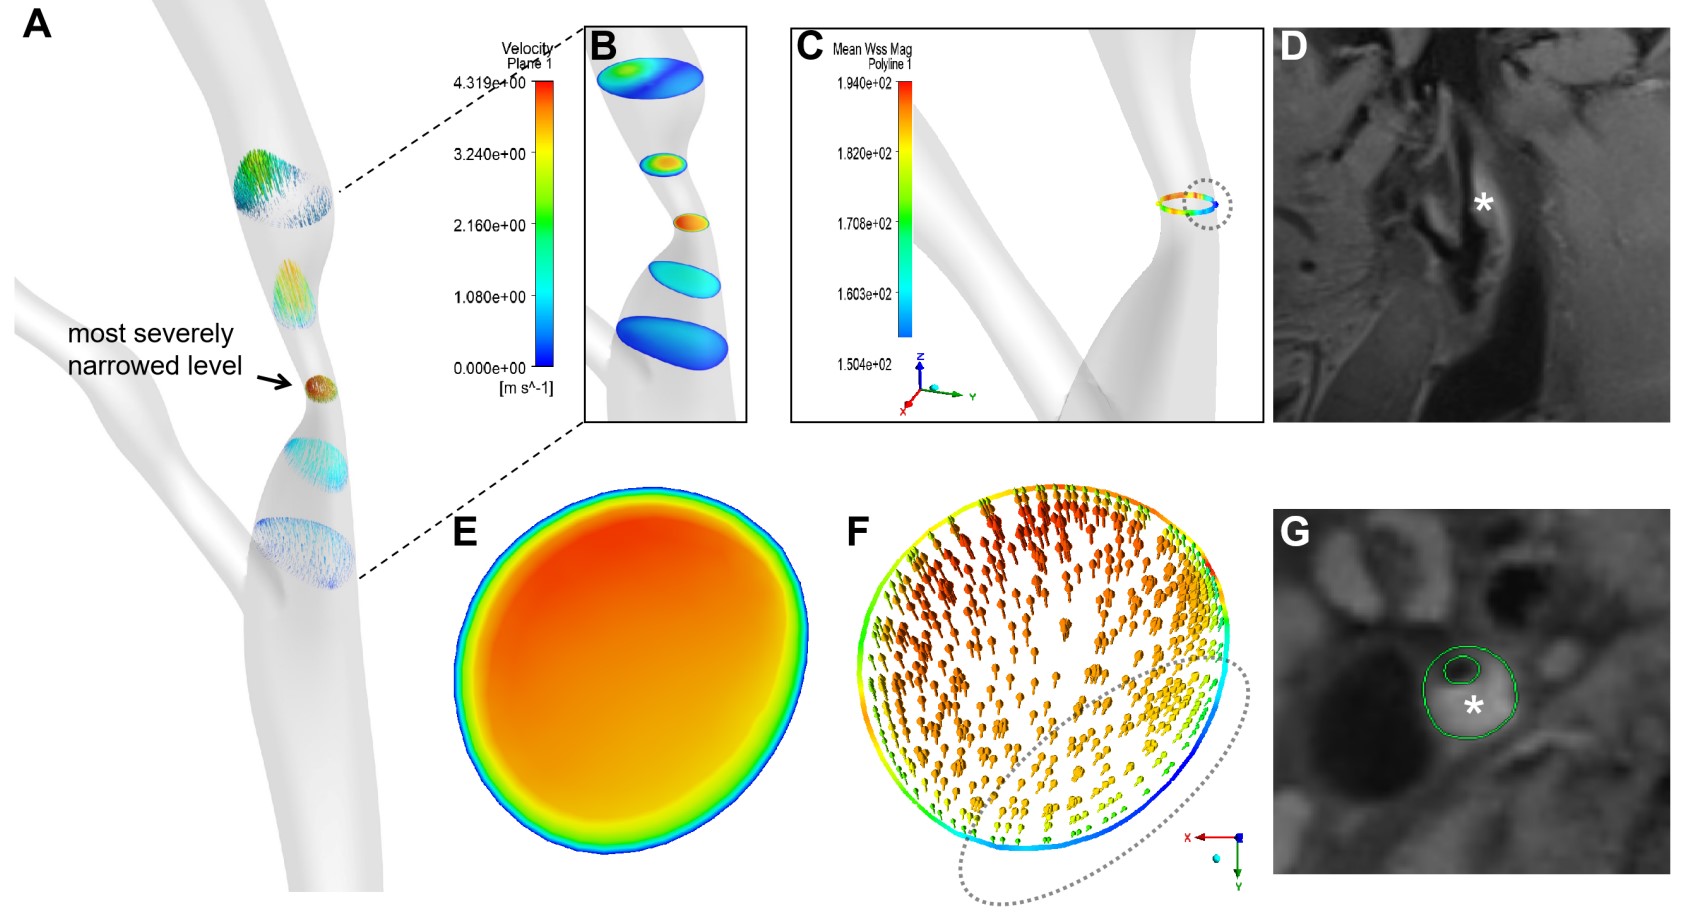
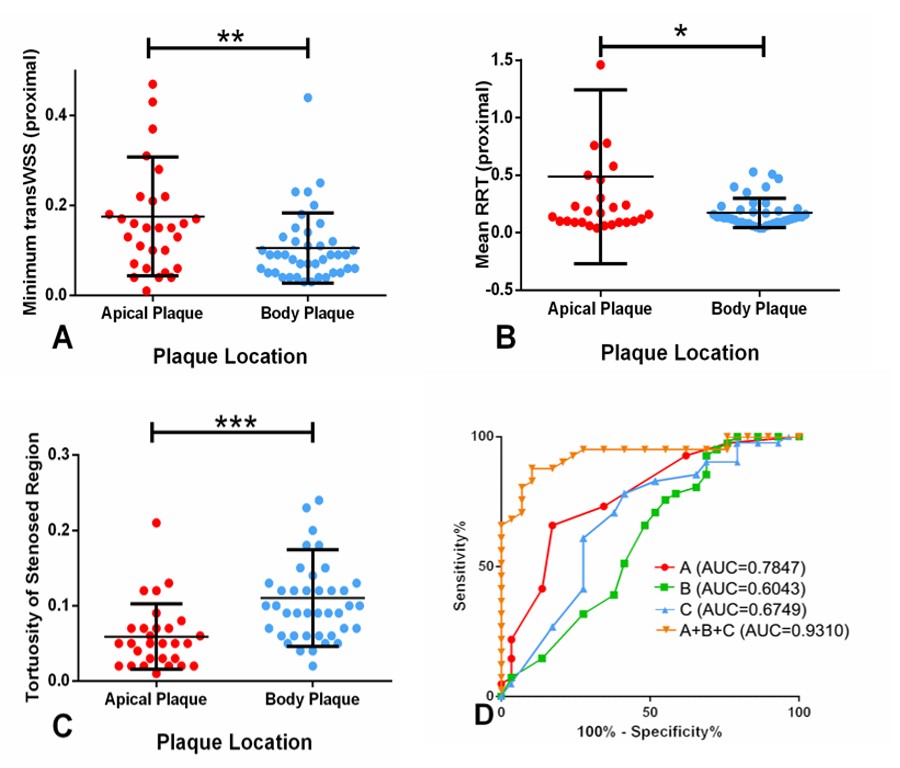
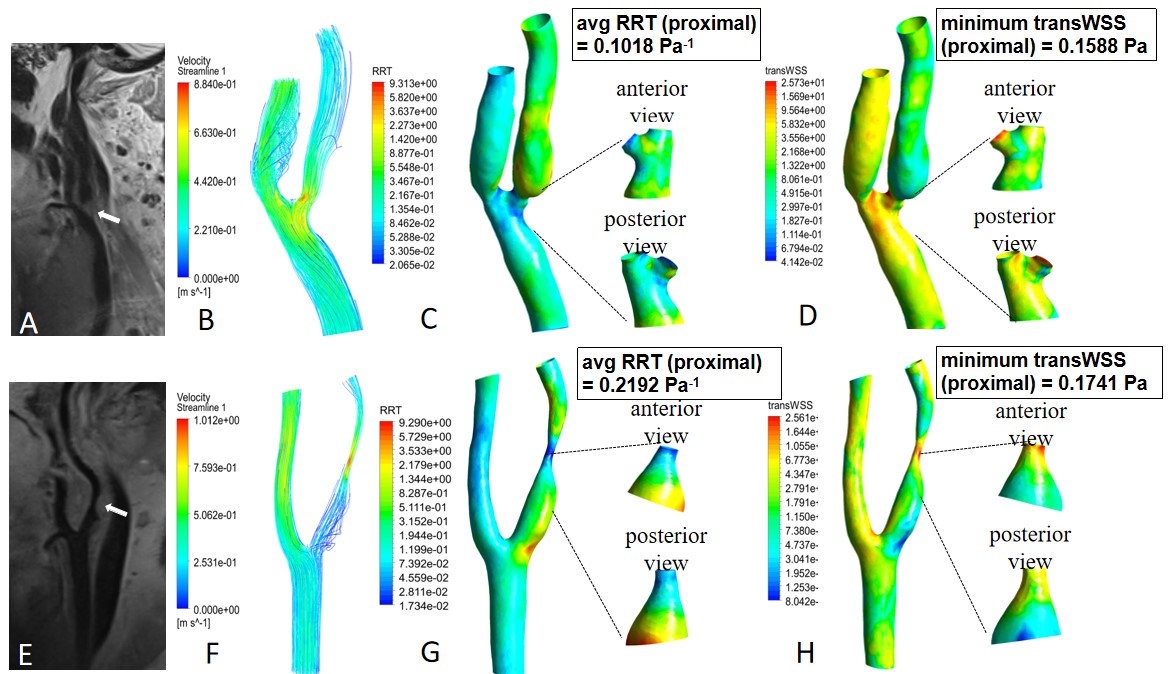
Forty-one and Twenty-nine patients were classified into groups with body or apical plaque, respectively. Among all the 70 plaques, WSSplaque magnitudes were lower than WSSnone-plaque magnitudes (13.59 ± 8.83 Pa vs. 15.27 ± 8.08 Pa, p = 0.001). Representative case was shown in Figure 3. In multivariate binary logistic regression, tortuosity of stenosed region (OR 1.32; 95% CI: 1.04, 1.66; p = 0.02), mean RRT (proximal) (OR, 0.80; 95% CI: 0.68, 0.95; p = 0.01), and minimum transWSS (proximal) (OR, 0.87; 95% CI: 0.77, 0.97; p = 0.01) were the key factors independently associated with plaque location. The combination of these three variables improved the AUC to 0.93, which was significantly higher than that obtained with each variable alone (p < 0.05) (Figure 4). Representative cases were shown in Figure 5. However, the association between plaque characteristics and plaque location was not significant (p > 0.05).Discussion
Our findings provided new biomechanical insights for the pathogenesis of carotid bulb stenosis by utilizing CFD. We chose to evaluate spatial differences in local hemodynamics by dividing carotid stenotic lesions into plaque side and non-plaque side at a cross section and then dividing lesions into three regions by multiplanar reconstruction, specifically the proximal part, the distal part, and the most-severely narrowed level. We believed that our investigation was the first to apply this differentiation in carotid bulb.This study demonstrated several points: Firstly, plaque formation presented around the area where a decrease in the WSS value was accompanied by low-flow velocity. Secondly, significant hemodynamic differences between plaque locations were found in the proximal part and most-severely narrowed level of the lesion. Notably, tortuosity of stenosed region, proximal-specific RRT, and transWSS were independently associated with plaque location. Thirdly, the combination of the above geometric and hemodynamic variables provided an incremental contribution to different plaque location. The present work was a cross-sectional study. Prospective validations will be needed.
Conclusion
In conclusion, we demonstrated that plaque formation was associated with local flow pattern; we also showed and tortuosity of the stenosed region and proximal-specific RRT and transWSS were significantly associated with plaque location in the carotid bulb.Acknowledgements
We thank the Beijing Institute of Technology for providing computing resources.References
1. Younis HF, Kaazempur-Mofrad MR, Chan RC, et al. Hemodynamics and wall mechanics in human carotid bifurcation and its consequences for atherogenesis: investigation of inter-individual variation. Biomech Model Mechanobiol. 2004;3(1):17-32.
2. Lu M, Cui Y, Peng P, et al. Shape and Location of Carotid Atherosclerotic Plaque and Intraplaque Hemorrhage: A High-resolution Magnetic Resonance Imaging Study. J Atheroscler Thromb. 2019;26(8):720-727.
3. Woo HG, Heo SH, Kim EJ, et al. Atherosclerotic plaque locations may be related to different ischemic lesion patterns. BMC Neurol. 2020;20(1):288.
4. Park ST, Kim JK, Yoon KH, et al.Atherosclerotic carotid stenoses of apical versus body lesions in high-risk carotid stenting patients. AJNR Am J Neuroradiol. 2010;31(6):1106-1112.
Figures