1315
Predicting carotid plaque vulnerability by macrophage-targeted nanocluster-enhanced high-resolution vessel wall imaging
Yan Gong1, Menglin Wu2, Dingwei Fu3, Yu Guo4, Xiudi Lu5, Ying Zou6, Xiang Zhang1, Jinxia Zhu7, Xianchang Zhang7, Xue Li2, and Shuang Xia5
1Department of Radiology, Tianjin Nankai Hospital, Tianjin, China, 2Department of Radiology, Second Hospital of Tianjin Medical University, Tianjin, China, 3Department of Radiology, First Central Clinical College, Tianjin Medical University, Tianjin, China, 4Department of Radiology, Medical Imaging Institute of Tianjin, Tianjin First Central Hospital, School of Medicine, Nankai University, Tianjin, China, 5Department of Radiology, First Teaching Hospital of Tianjin University of Traditional Chinese Medicine, Tianjin,China National Clinical Research Center for Chinese Medicine Acupuncture and Moxibustion, Tianjin, China, 6First Teaching Hospital of Tianjin University of Traditional Chinese Medicine, Tianjin,China National Clinical Research Center for Chinese Medicine Acupuncture and Moxibustion, Tianjin, China, 7MR Collaboration, Siemens Healthcare Ltd., Beijing, China
1Department of Radiology, Tianjin Nankai Hospital, Tianjin, China, 2Department of Radiology, Second Hospital of Tianjin Medical University, Tianjin, China, 3Department of Radiology, First Central Clinical College, Tianjin Medical University, Tianjin, China, 4Department of Radiology, Medical Imaging Institute of Tianjin, Tianjin First Central Hospital, School of Medicine, Nankai University, Tianjin, China, 5Department of Radiology, First Teaching Hospital of Tianjin University of Traditional Chinese Medicine, Tianjin,China National Clinical Research Center for Chinese Medicine Acupuncture and Moxibustion, Tianjin, China, 6First Teaching Hospital of Tianjin University of Traditional Chinese Medicine, Tianjin,China National Clinical Research Center for Chinese Medicine Acupuncture and Moxibustion, Tianjin, China, 7MR Collaboration, Siemens Healthcare Ltd., Beijing, China
Synopsis
Keywords: Vessel Wall, Atherosclerosis, macrophage
Ischemic stroke can be attributed to the sudden rupture of high-risk atherosclerotic plaques. Therefore, identifying vulnerable plaque is essential for preventing acute vascular events. Increasing evidence has established that macrophages play a vital role in the pathogenesis of atherosclerosis. Using the black-blood technique, an imaging approach that suppresses blood signals to highlight the arterial wall, and a macrophage-targeted contrast agent, plaque vulnerability could be quantitatively assessed for the macrophage burden. This in vivo animal study non-invasively evaluated the plaque vulnerability, which may provide information on the clinical risk stratification.Introduction
Non-intrusive, quantitative, and precise imaging of vulnerable atherosclerotic plaque is critical for timely stroke prevention 1-3. Mounting evidence has established that macrophages play a key role in the pathogenesis of atherosclerosis4,5. Determining the underlying role of macrophages in plaque progression holds promise for patient stratification and could significantly facilitate therapeutic monitoring. Thus, the utility of the macrophage-targeting contrast-enhanced high-resolution vessel wall imaging (HR-VWI) technique6 was systematically examined in this in vivo animal study, and a histogram analysis was conducted to predict atherosclerotic vulnerability accurately.Methods
A simplified flowchart describing the methods in this study is shown in Figure 1. Contrast-enhanced HR-VWI was performed on a 3T system (MAGNETOM Prisma, Siemens Healthcare, Erlangen, Germany) with a commercial 64-channel head/neck coil. The macrophage-targeted PP1-Au@GSH@Gd (GdMG) nanoclusters (NCs) and conventional Gadovist approach were used for longitudinal plaque evaluation by the morphology assessment. In contrast, a systematic histogram analysis in atherosclerosis (AS) rabbit model was conducted. The performance of in vitro HR-VWI contrast capacity, the in vivo foamy macrophage targeting, and the selectivity efficacy of GdMG NCs on HR-VWI in atherosclerotic rabbit models were quantified compared with Gadovist. After revealing the superior competence of GdMG NCs in measuring the morphological assessment for plaque, prediction studies of plaque vulnerability were further conducted based on the contrast-enhanced HR-VWI. The continuous variables were reported as appropriate. The Mann-Whitney U test was used to assess differences between the two groups, and Bland-Altman plots were used to compare the inter-observation agreement for image evaluation.7 The intra-observer reproducibility for the plaque characteristics assessment was evaluated using the intraclass correlation coefficient (ICC). Repeated measures analysis of variance (RM ANOVA) was applied to inspect the morphological evaluation (PA and WA) at the different plaque stages, followed by a post-hoc Bonferroni correction of multiple comparisons to examine the between-contrast-agent differences at the individual time points. Multiple linear regressions, including histogram-derived parameters (i.e., kurtosis, skewness, and CV), and potential time confounders (i.e., weeks of HFD induction) were performed. Then, the diagnostic utility of the employed fitting formula from those multiple linear regression analysis for the histogram vulnerability index (VIH) mentioned above was further quantified by calculating the area under the receiver operating characteristic (ROC) curve (AUC).Results
Due to the compelling targeting capacity of GdMG NCs to foamy macrophages in atherosclerotic plaques with GdMG NCs, the contrast-to-noise ratio (CNR) from the pre-injection baseline dramatically increased from 6.50 to 36.91 (p﹤0.001), with an increment of 1.39-fold higher than that of the Gadovist approach (Figure 2). Furthermore, Spearman’s correlation test confirmed that the coefficient of variation (CV) derived from the histogram analysis based on GdMG NCs HR-VWI was indeed positively linearly correlated with VIP significantly (p < 0.05) with adjusted R2 = 0.775 (Figure 3). Finally, mathematical formulas with histogram-derived parameters as variables were fitted to quantitatively calculate the histogram vulnerability index (VIH) with the strength of the adjusted R2 = 0.952 (p﹤0.001) and the area under the curve (AUC) of 0.875 (p﹤0.001) to realize the in vivo and quantitative calculation of the plaque vulnerability (Figure 4).Discussion
The current image-evaluation method can only sometimes provide objective and biologic-accordance information that helps in clinical diagnosis and management. To better assess the plaque vulnerability, it is vital to emphasize the tissue-specific image properties of the plaque heterogeneity by image interpretation. Inspired by a previous histogram study based on the conventional T1WI image investigating the intracranial plaque type, we expanded their conclusions. Finally, we reached an exciting advance in quantified plaque vulnerability with a statistical method.8 To the best of our knowledge, our experiment is the pioneering workflow to quantify plaque vulnerability via histogram based on the macrophage-targeted plaque HR-VWI in vivo, which had a satisfactory diagnostic performance with optimized specificity and sensitivity. Moreover, the proposed analysis processing is generated in Radiant and ImageJ software packages, both of which are in general use and readily available, hence making the introduced method applicable and adjustable for other studies in plaque vulnerability and clinical applications for risk management.Conclusion
The proposed integrative analysis provided an overall illustration of the non-invasive nano-image method for quantifying plaque vulnerability and substantially increasing the relevance of the results for clinical reference. The use of GdMG NCs as macrophage-targeted HR-VWI is considered a promising diagnosis avenue for many inflammation-related diseases. Additionally, a deep understanding between the quantified histogram parameters and plaque vulnerability will improve our ability to harness the mechanism for developing novel image strategies for cardiovascular disease and promote the prediction before adverse clinical events occur. Although this is proof-of-concept only tested in rabbits, it lays a strong foundation for the bench-to-bedside translation of nano-agent-enhanced HR-VWI for stroke risk prediction and prevention.Acknowledgements
No acknowledgement found.References
1. Rune I, Rolin B, Lykkesfeldt J. Long-term Western diet fed apolipoprotein E-deficient rats exhibit only modest early atherosclerotic characteristics. Sci Rep 2018;8:5416.2. Saba L, Moody AR, Saam T. Vessel Wall-Imaging Biomarkers of Carotid Plaque Vulnerability in Stroke Prevention Trials: A viewpoint from The Carotid Imaging Consensus Group. JACC Cardiovasc Imaging 2020;13:2445-2456.3. Hoshino T, Sissani L, Labreuche J. Prevalence of Systemic Atherosclerosis Burdens and Overlapping Stroke Etiologies and Their Associations With Long-term Vascular Prognosis in Stroke With Intracranial Atherosclerotic Disease. JAMA Neurol 2018;75:203-211.4. Li W, Luehmann HP, Hsiao HM. Visualization of Monocytic Cells in Regressing Atherosclerotic Plaques by Intravital 2-Photon and Positron Emission Tomography-Based Imaging-Brief Report. Arterioscler Thromb Vasc Biol 2018;38:1030-1036.5. Wang B, Tang X, Yao L. Disruption of USP9X in macrophages promotes foam cell formation and atherosclerosis. J Clin Invest 2022;132.6. Mandell DM, Mossa-Basha M, Qiao Y. Intracranial Vessel Wall MRI: Principles and Expert Consensus Recommendations of the American Society of Neuroradiology. AJNR Am J Neuroradiol 2017;38:218-229.7. Timsit C, Soize S, Benaissa A. Contrast-Enhanced and Time-of-Flight MRA at 3T Compared with DSA for the Follow-Up of Intracranial Aneurysms Treated with the WEB Device. AJNR Am J Neuroradiol 2016;37:1684-1689.8. Shi Z, Li J, Zhao M. Quantitative Histogram Analysis on Intracranial Atherosclerotic Plaques: A High-Resolution Magnetic Resonance Imaging Study. Stroke 2020;51:2161-2169.Figures
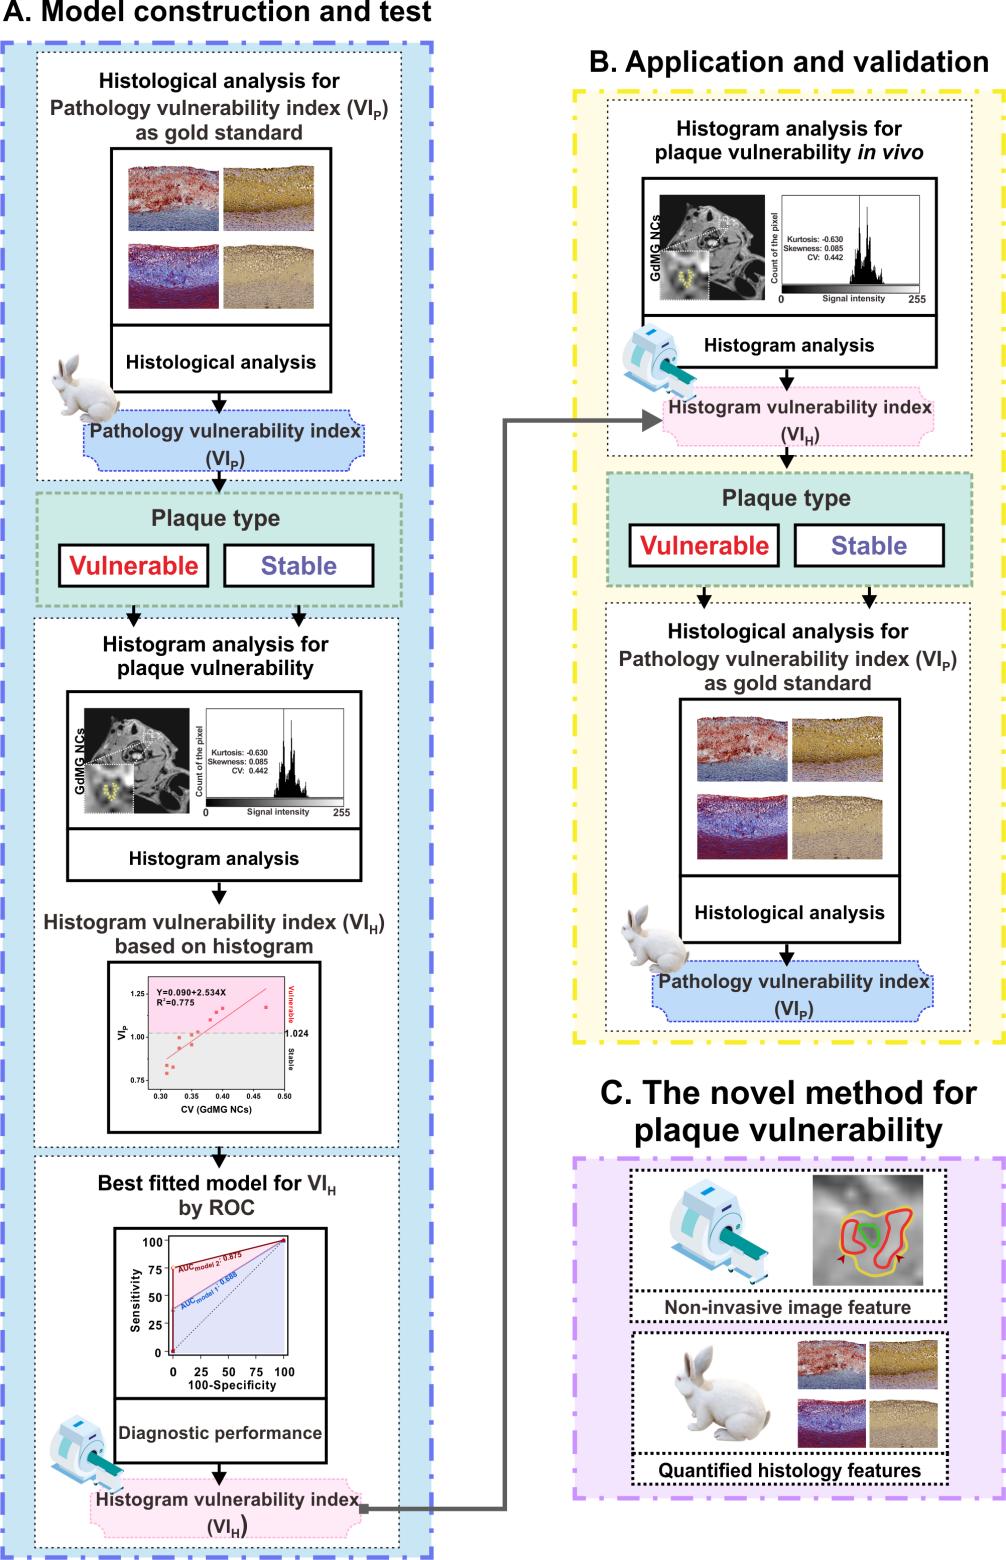
Figure 1. Flowchart of the in vivo, non-invasive, and quantitative characterization of plaque vulnerability and the final performance evaluation in the study.
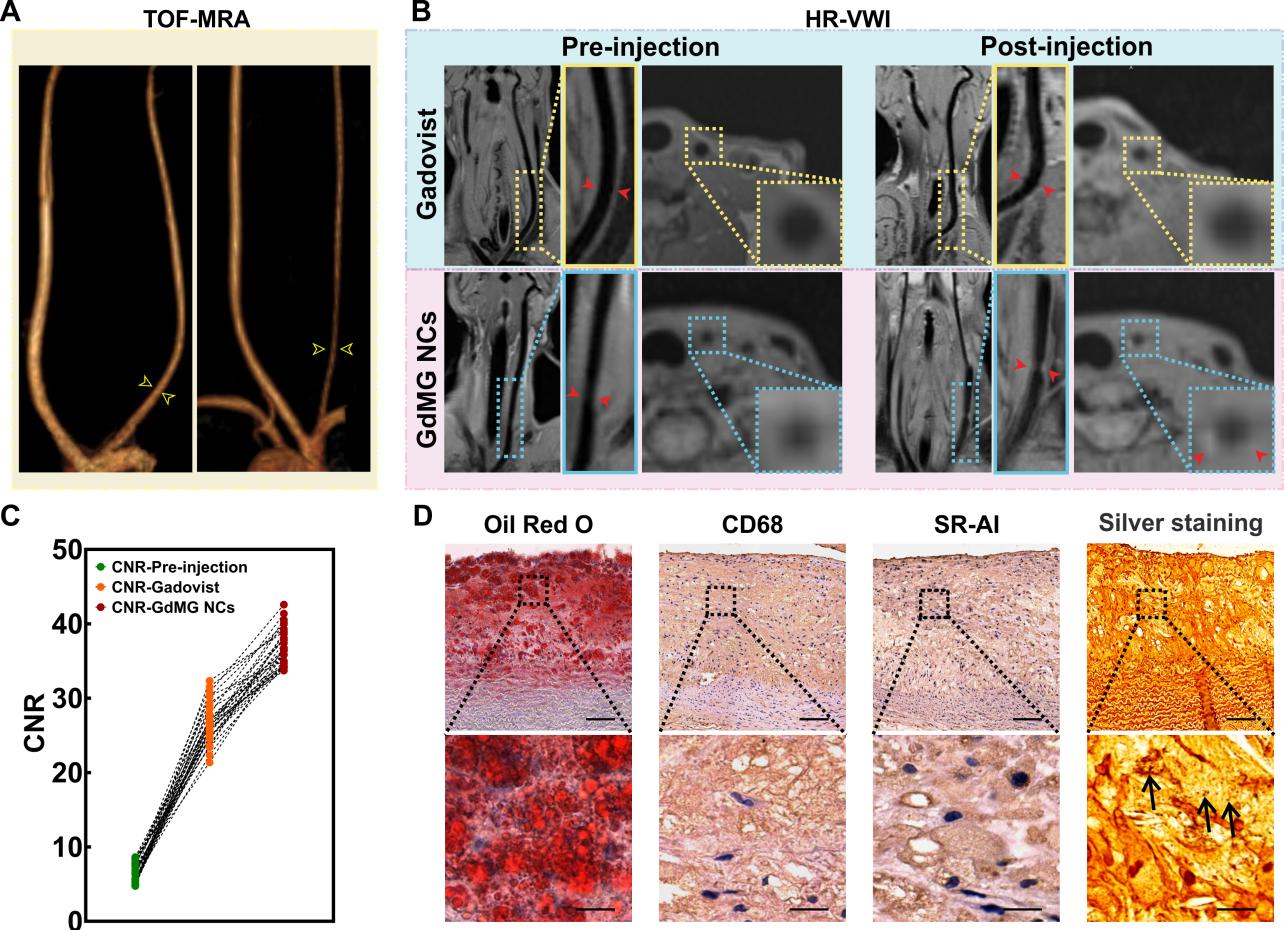
Figure 2. In vivo target capability of GdMG NCs in atherosclerotic rabbits. The vessel wall images of atherosclerotic rabbit carotid artery before and after the injection of contrast agent (highlighted within a yellow box). (A) The traditional TOF-MRA clarifies the vessel diameter (yellow arrowhead). (B) Contrast-enhanced HR-VWI. The contrast-to-noise ratio (CNR) (C) GdMG NCs was significantly higher than Gadovist. The histology assessment of the stenotic lesions was conducted to validate of the GdMG NCs targeting capability for macrophages in plaque (D).
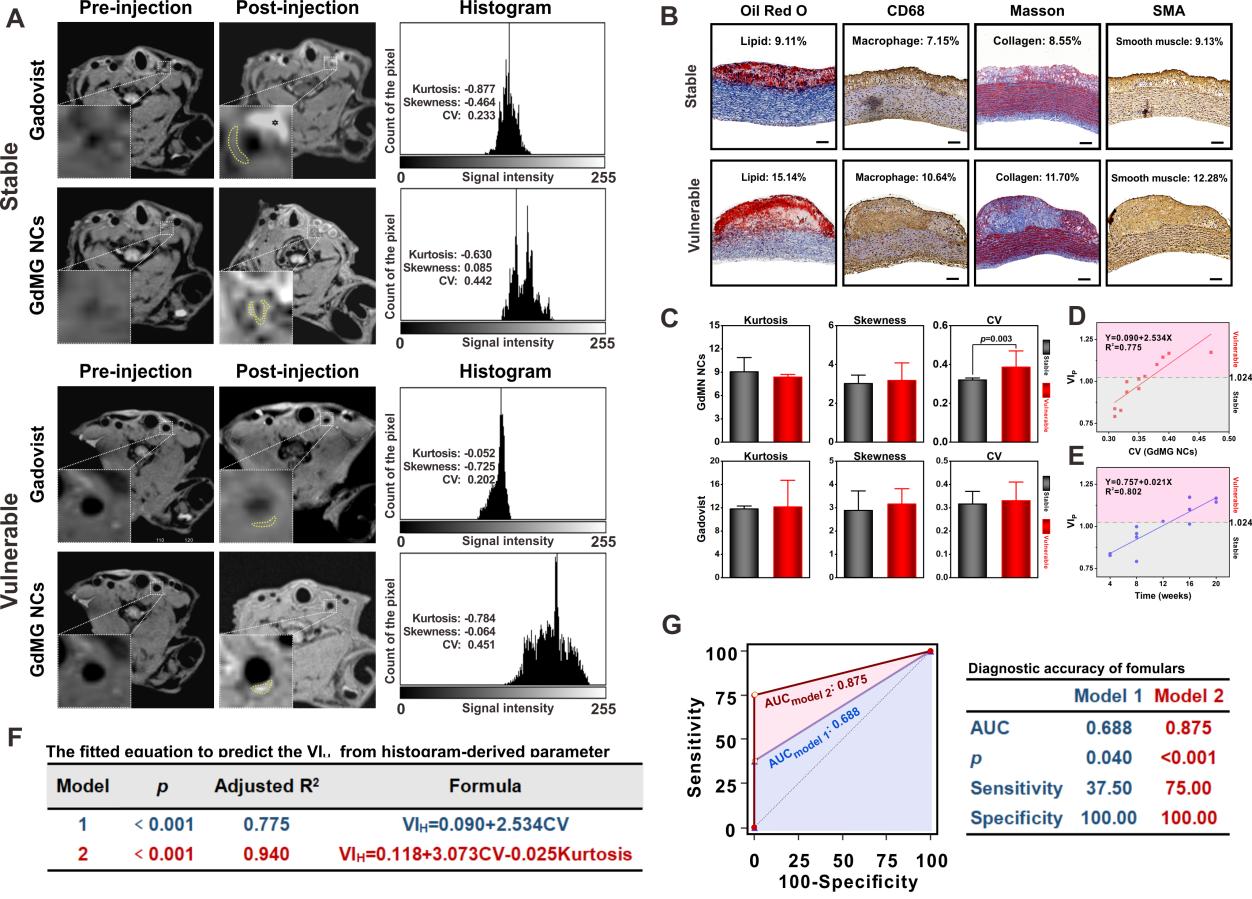
Figure 3. Non-invasive plaque vulnerability prediction by GdMG NCs enhanced HR-VWI. The histogram analysis (A) of plaque. The serial co-registered histology tests (B) are quantified and analyzed to calculate the pathology vulnerability index (VIP). Box plots (C) show the difference in the histogram parameters and signal intensity features between stable and vulnerable plaque. The scatter plots (D) describe the relationship among histogram parameters and the VIP value. The fitting formula (E) offers a theory for calculating the VIP from the contrast-enhanced HR-VWI in vivo.
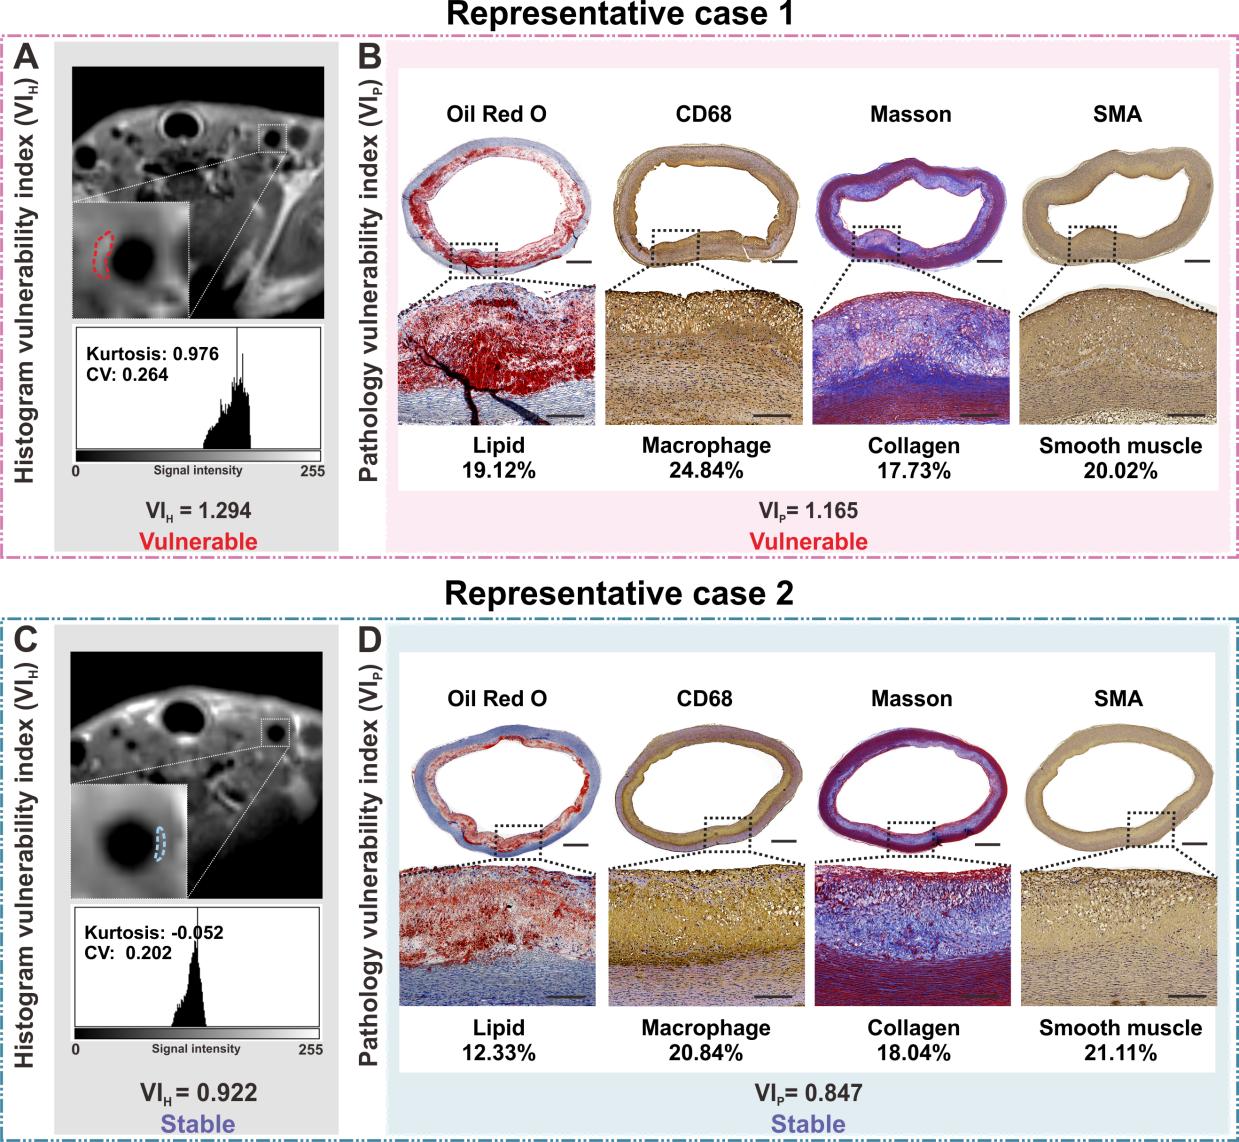
Figure 4. Validation of the diagnostic value of the GdMG NCs enhanced HR-VWI. (A) Histogram vulnerability index (VIH) was calculated based on contrast-enhanced HR-VWI with Gadovist and GdMG NCs. (B) Pathology vulnerability index (VIP) is calculated as the gold criteria for plaque vulnerability. (C) Receiver operating characteristic curve for evaluating our prediction models. The area under the curve (AUC) represents the proposed fitting formula, and model 2 has a perfect diagnostic performance.
DOI: https://doi.org/10.58530/2023/1315