1314
Carotid wall shear stress and wall thickness in patients with familial hypercholesterolemia and their healthy siblings1Bern University Hospital, University of Bern, Bern, Switzerland, 2Translation Imaging Center (TIC), Swiss Institute for Translational and Entrepreneurial Medicine, Bern, Switzerland, 3Department of Applied Mathematics, Technical Medical Center, University of Twente, Enschede, Netherlands, 4Department of Radiology and Nuclear Medicine, Amsterdam Cardiovascular Sciences, Amsterdam University Medical Center, location AMC, Amsterdam, Netherlands, 5Department of Pediatrics, Amsterdam University Medical Center, location AMC, Amsterdam, Netherlands, 6Department of Biomedical Engineering & Physics, Amsterdam Cardiovascular Sciences, Amsterdam University Medical Center, location AMC, Amsterdam, Netherlands, 7Department of Epidemiology and Data Science, Amsterdam Cardiovascular Sciences, Amsterdam University Medical Center, location AMC, Amsterdam, Netherlands
Synopsis
Keywords: Flow, Velocity & Flow, vessel wall, carotids, familial hypercholesterolemia
Familial hypercholesterolemia (FH) leads to premature atherosclerosis. In this study we use 4D flow and 3D black blood (BB) MRI to investigate carotid artery wall shear stress (WSS) and wall thickness (WT) 3D maps and their relation, in FH patients on lifelong statin prescriptions and their unaffected siblings (n=234). We applied machine learning segmentation technology and 3D statistical analysis methods and found that ensemble-averaged carotid WSS and WT maps were highly similar between the groups. However, the 3D carotid correlation coefficient maps showed lower agreement between WT and WSS in patients, suggesting abnormal wall remodeling processes compared to the siblings.Introduction
Familial hypercholesterolemia (FH) is a condition characterized by elevated low-density lipoprotein cholesterol levels, leading to an increased risk for premature atherosclerosis and cardiovascular disease. Lifelong lipid-lowering statin therapy from early childhood slows thickening of the carotid intima-media, a well-validated surrogate marker for future cardiovascular disease [1]. Increased wall thickness (WT) is associated with low wall shear stress (WSS), the shear force of blood flow mediating endothelial cell expression [2,3]. In this study we compared WSS and WT between FH patients on lifelong statin therapy and their healthy siblings. Additionally, we evaluated the association of WT with age, sex and WSS in 3D in both groups.Methods
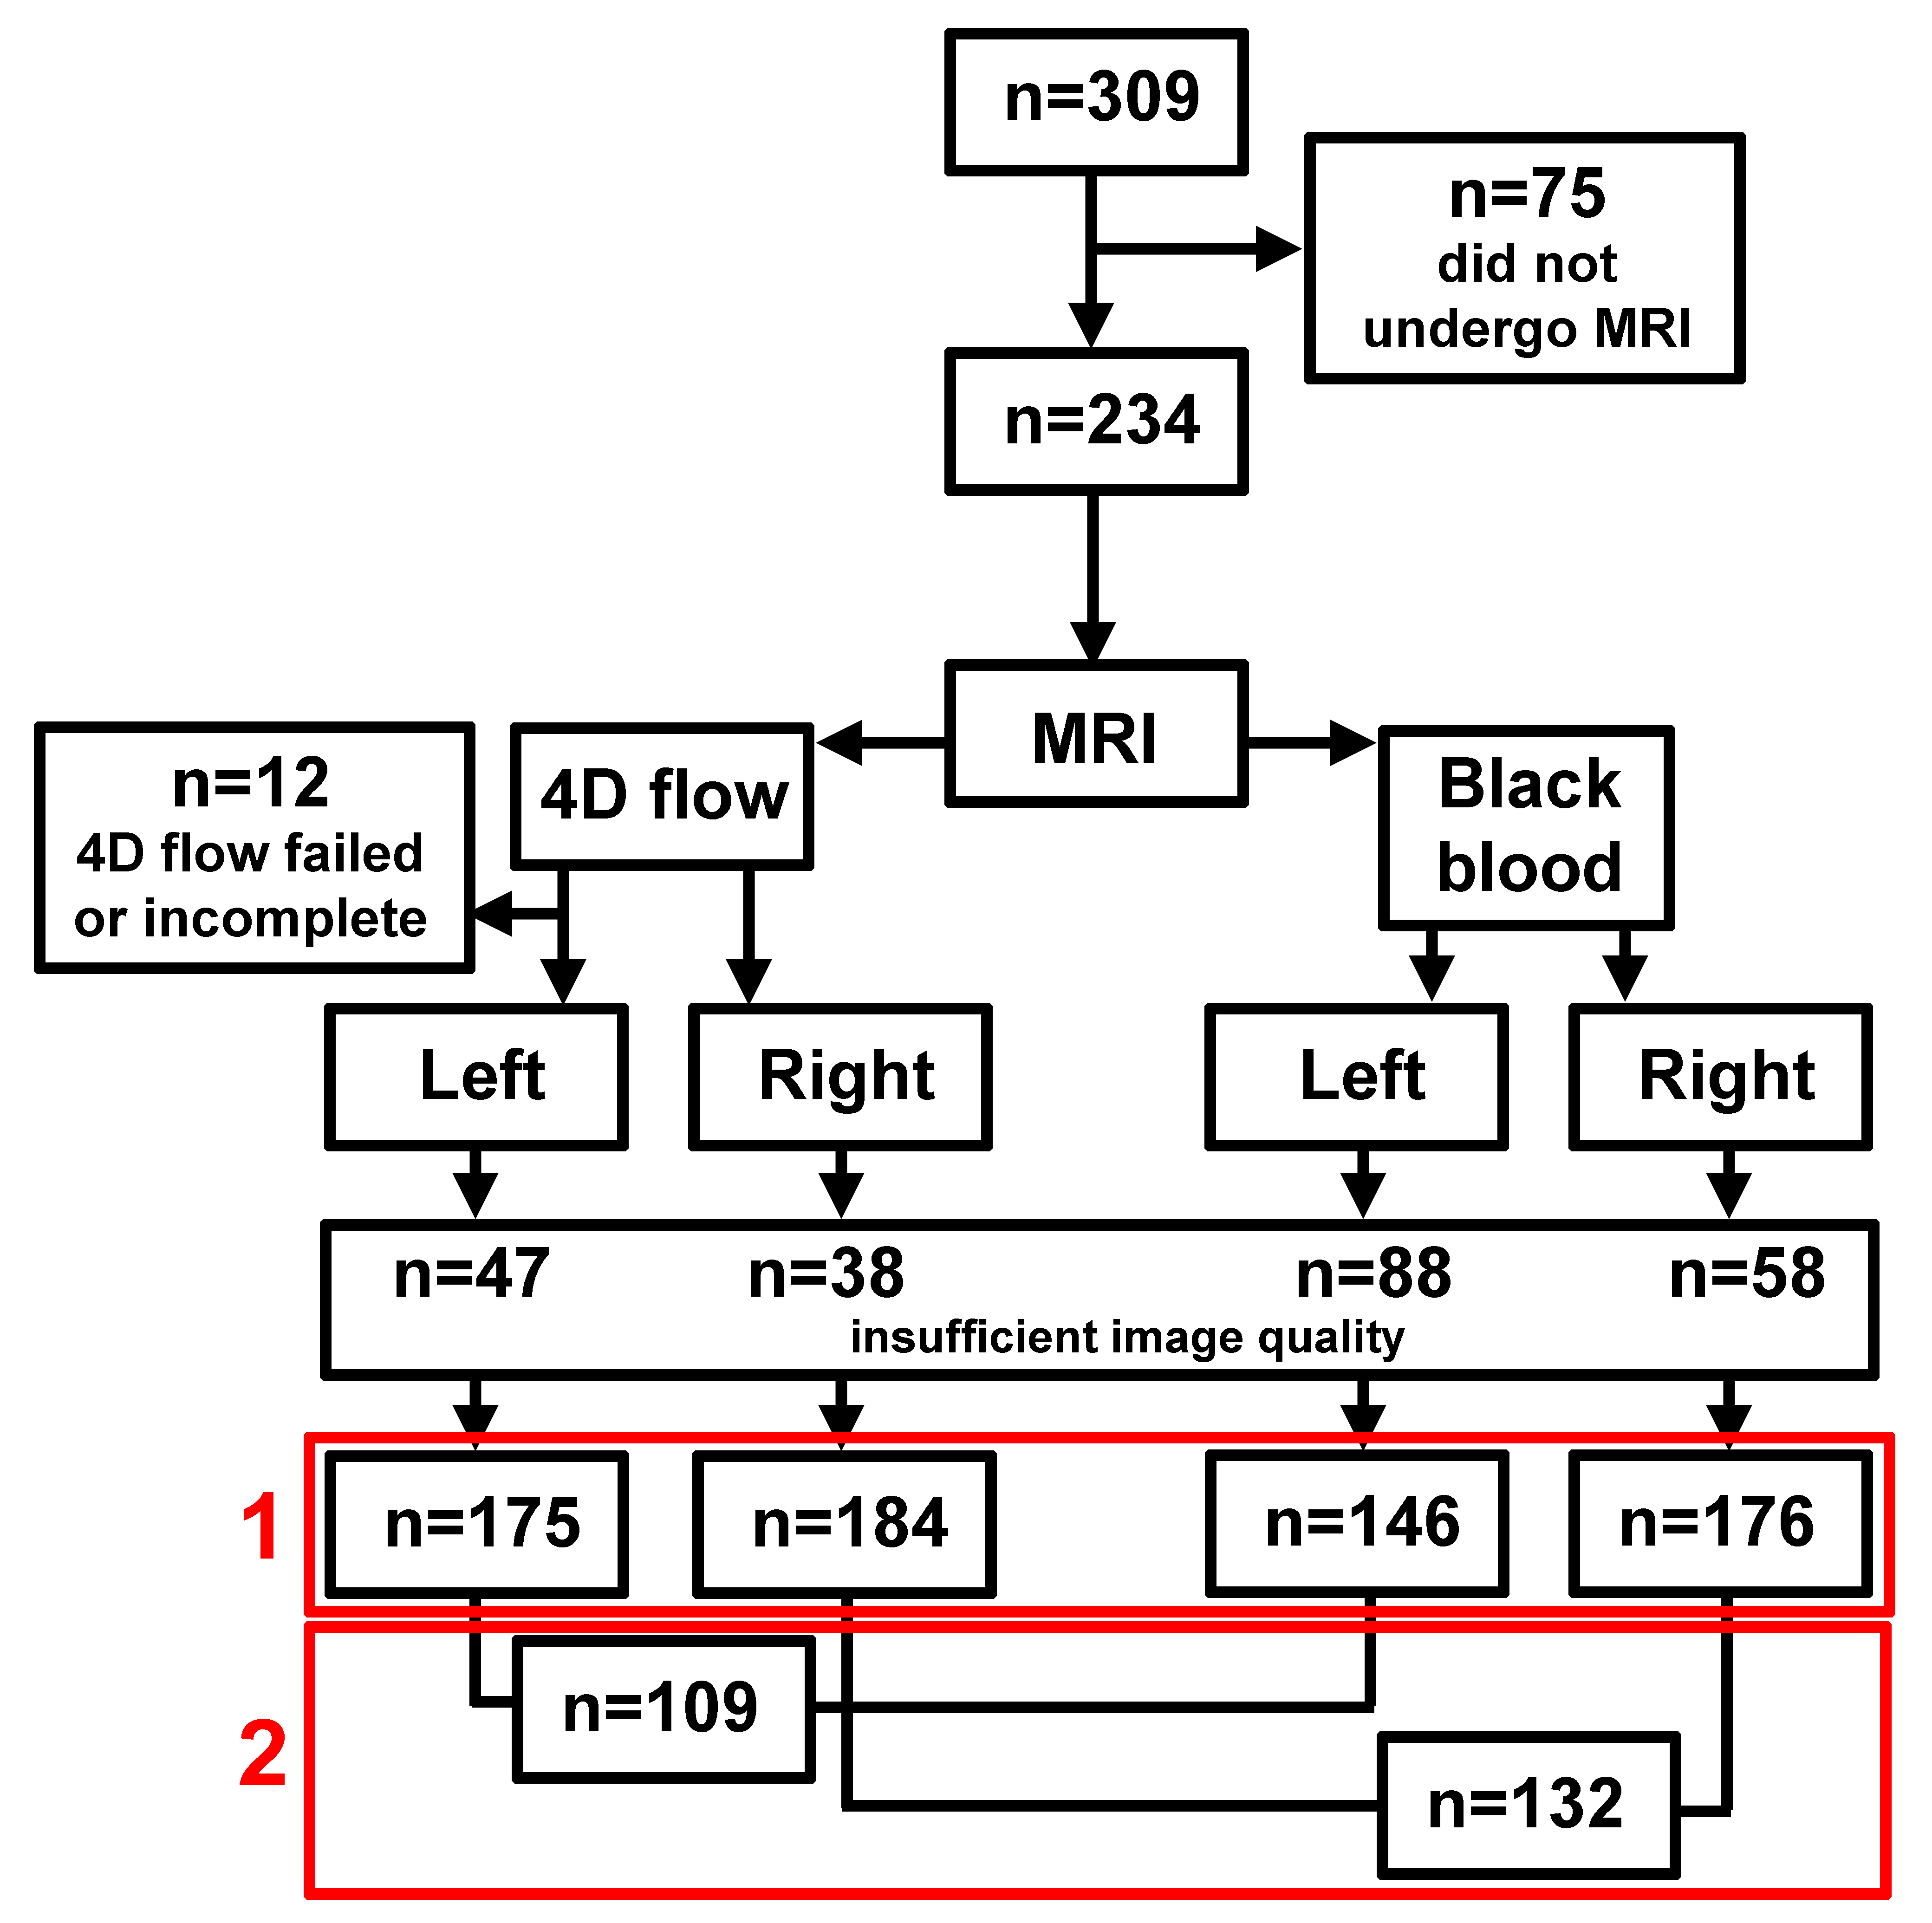
For this cross-sectional study, 214 children (8-18 years) with FH who had undergone randomization from 1997-1999 in a pravastatin trial were eligible [1]. Nearly 20 years later, the patients and their 95 unaffected siblings were invited for follow-up measurements, including MRI scans.4D flow and black blood (BB) MRI were used to investigate 3D WSS and WT maps. All scans were performed with a Philips 3T Ingenia scanner using an 8-channel neck coil.
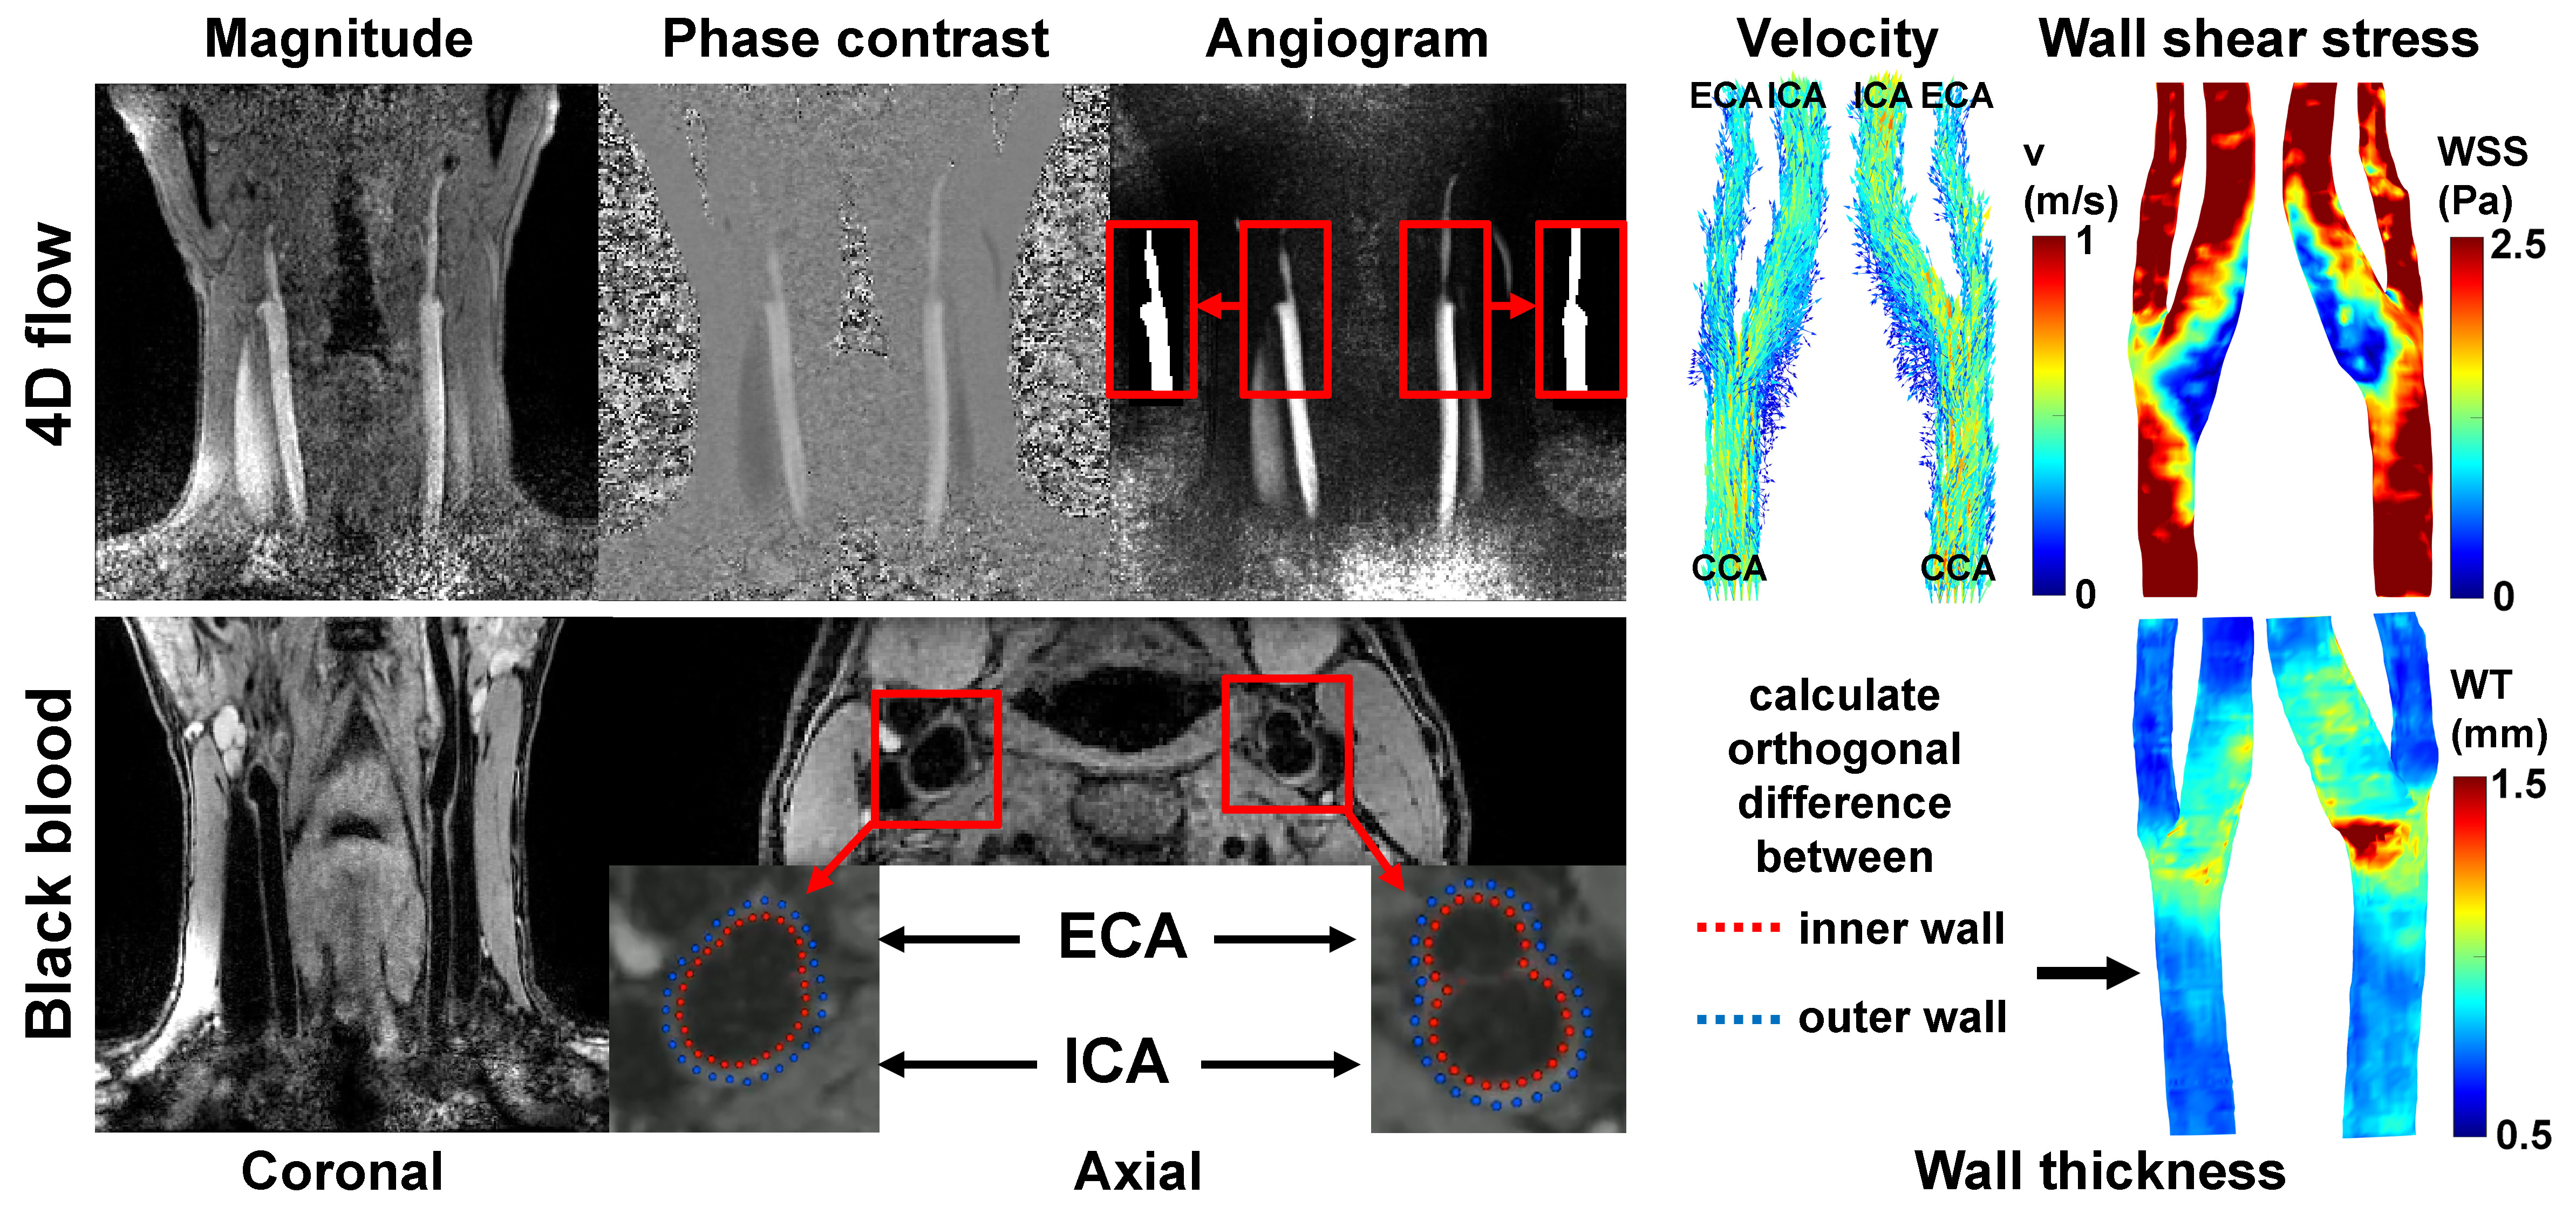
4D flow MRI scan parameters were: TR/TE/FA: 7.8ms/4.6ms/8°, VENC=150cm/s, (0.8mm)3 spatial and 80ms temporal resolution and k-t PCA acceleration factor 8, resulting in <10m scan time [4]. Image reconstruction was performed with MRecon (Gyrotools, Zurich, Switzerland) and contained linear background phase correction.
The 3D BB scan was acquired in coronal orientation using Poisson-disk prospective undersampling in multiple dimensions (PROUD) with acceleration factor 4, 2 signal averages, TR/TE/FA: 10ms/3.4ms/6°, and (0.5mm)3 spatial resolution. Scan time was 3m20s [5]. Compressed sensing image reconstruction was performed with BART [6].
For a subset of 65 subjects, the carotids were semi-automatically segmented in Mimics (Materialise, Leuven, Belgium) on 4D flow MRI-derived angiograms, from 3cm below to 2cm above the bifurcation. The dataset was split up in a 52/13 training/test ratio for an nnU-Net segmentation task [7], retrained on all 65 datasets, and applied to the entire cohort. The images and masks were subsequently separated in left and right carotids. Velocity vector data were visually inspected and excluded when randomly directed (noisy data) or masked incorrectly. WSS was then calculated on the peak-systolic timeframe [8].
Coronal BB data were reoriented to axial slices. The inner and outer walls of left and right coronary arteries were segmented using a rotation equivariant dilated convolutional neural network based on automatically identified centerlines [9]. From these predictions, a surface mesh delineating the vessel lumen and the orthogonal wall thickness on each mesh vertex was derived. The results were inspected for accuracy and length and subjects were excluded when contours were inaccurate or not entirely capturing the vessel wall 3cm below and 2cm above the bifurcation.
4D flow MRI and BB segmentations with similar lengths of common, internal and external carotid artery were chosen as templates to which datasets were registered using iterative closest point registration [10]. After nearest neighbor interpolation of WSS and WT of every subject to the template, the mean and standard deviation of WSS and WT were calculated on each wall point for patients and siblings separately.
Statistical analysis
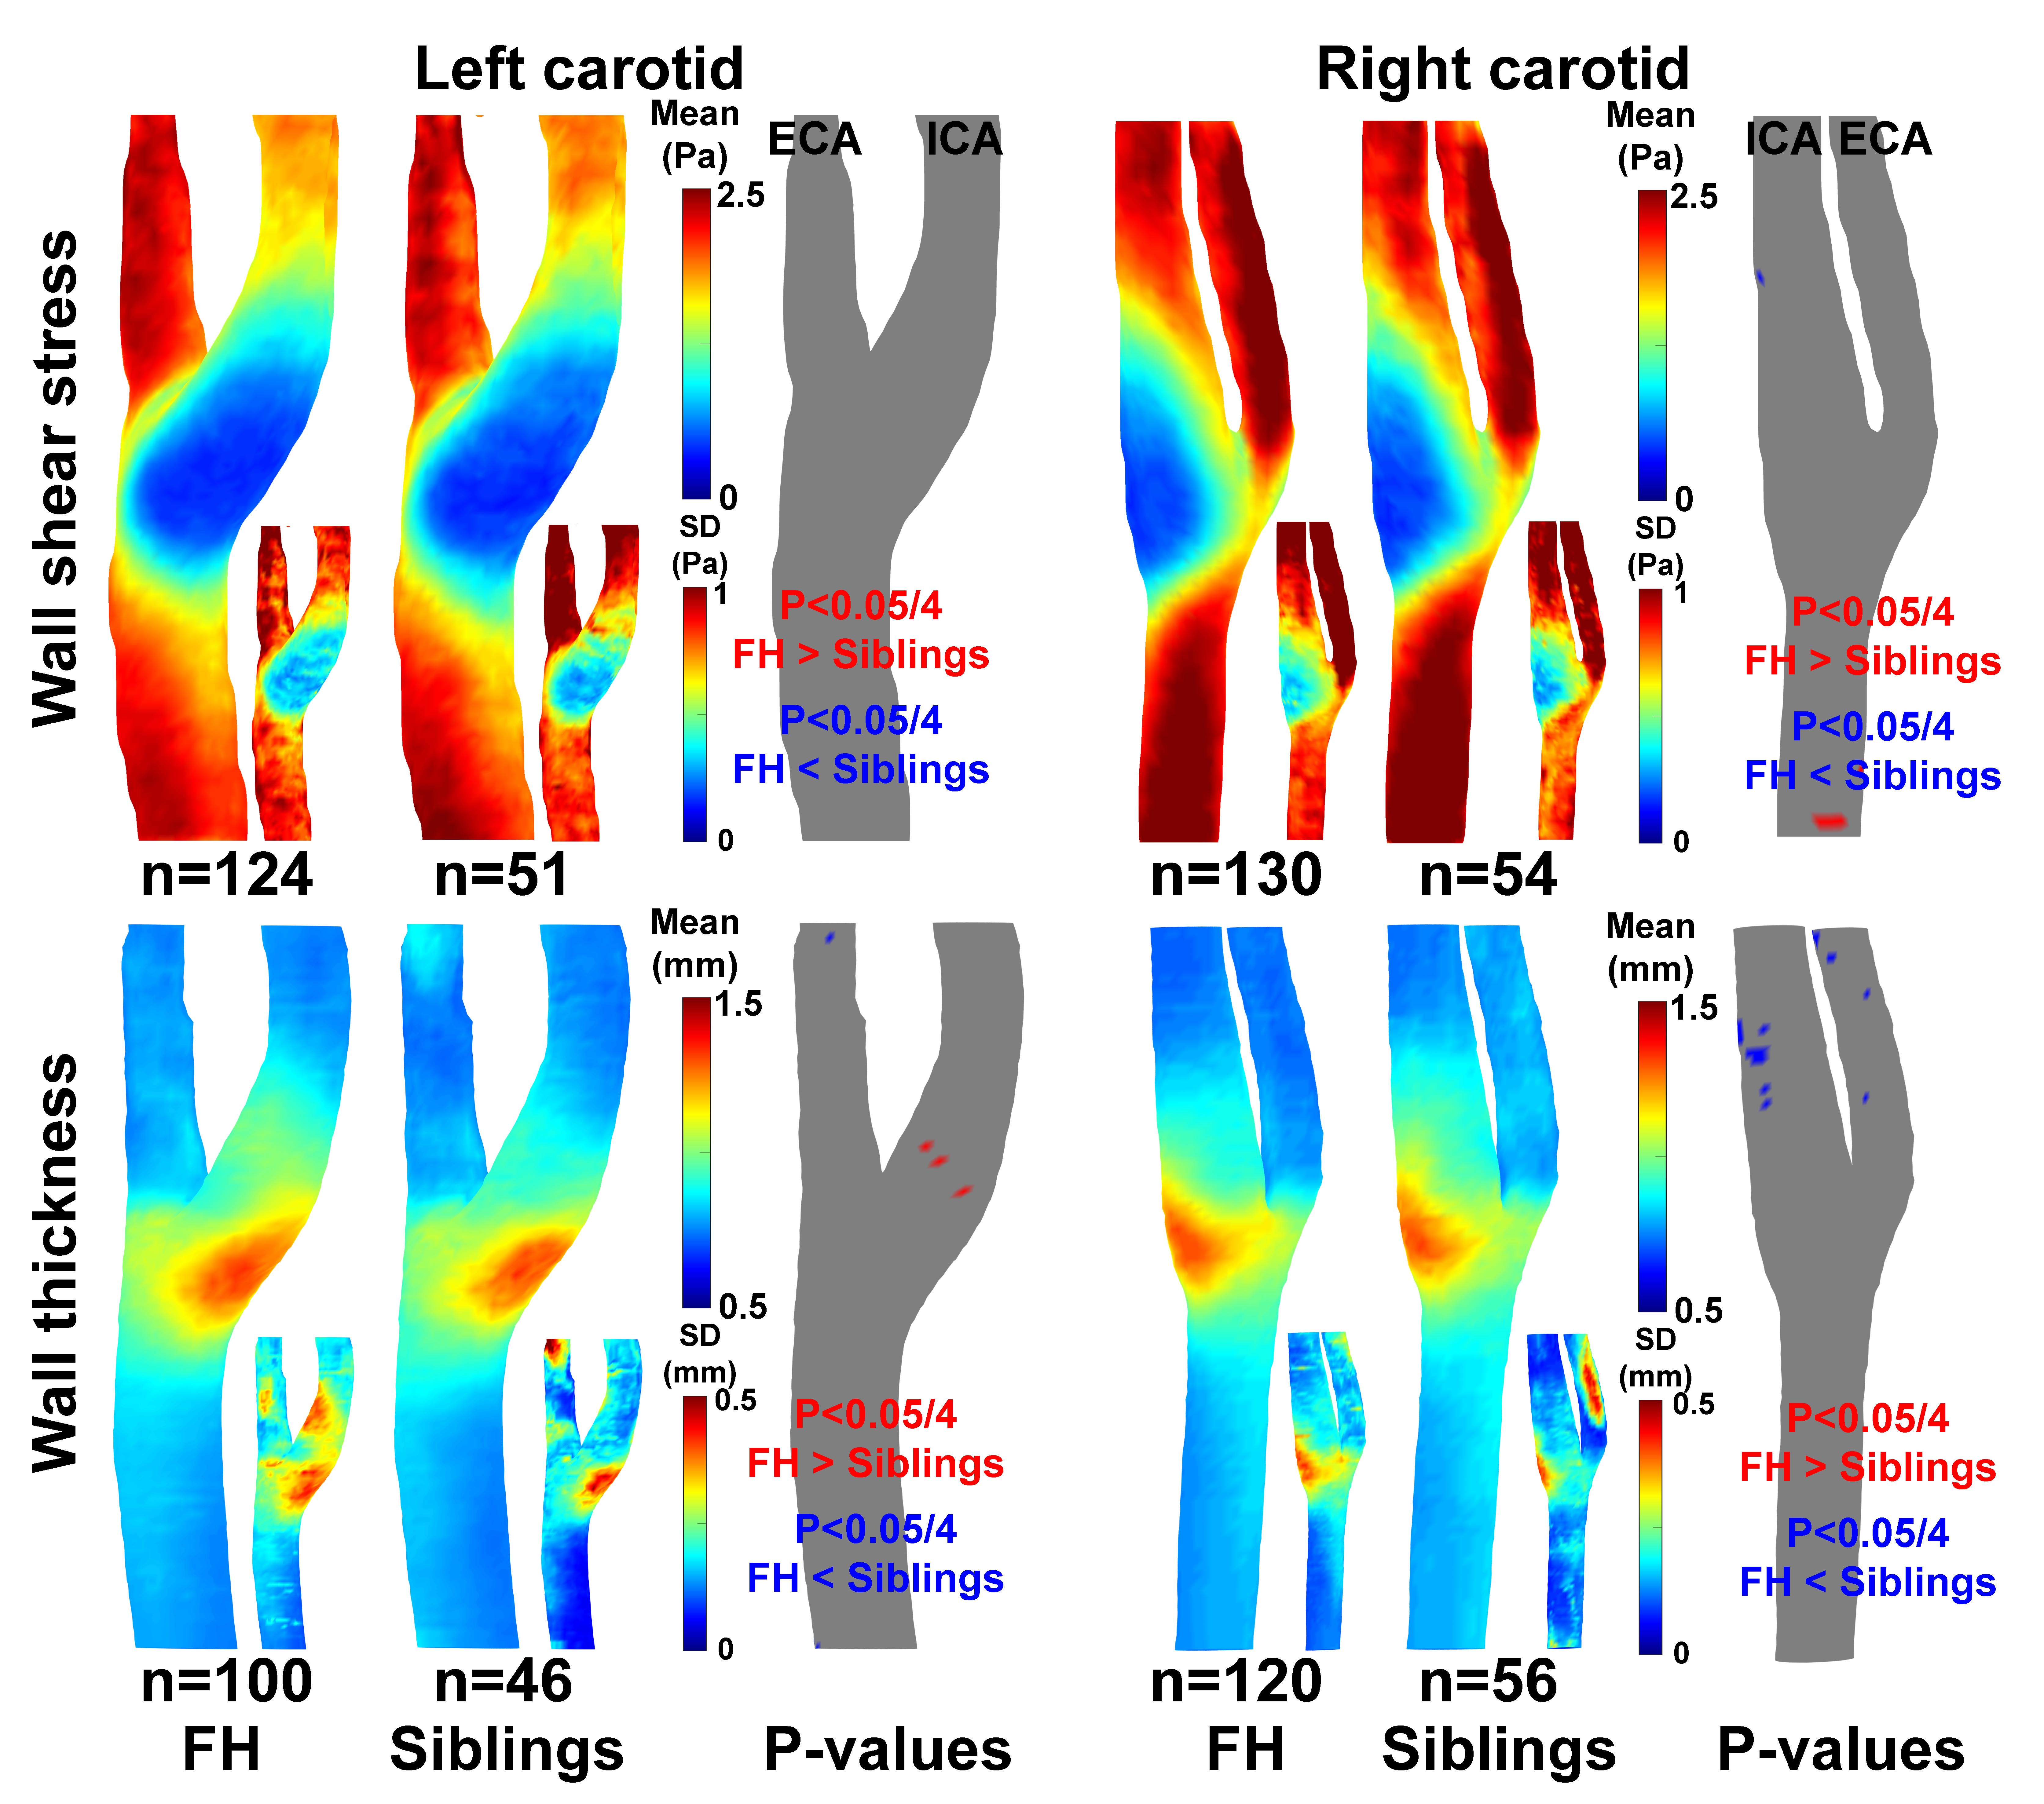
Analysis 1: On each wall point , the p-value between patients and siblings was determined with a two-sample t-test with significance of P<0.05 corrected for Bonferroni (factor 4 for left and right WSS and WT comparisons).
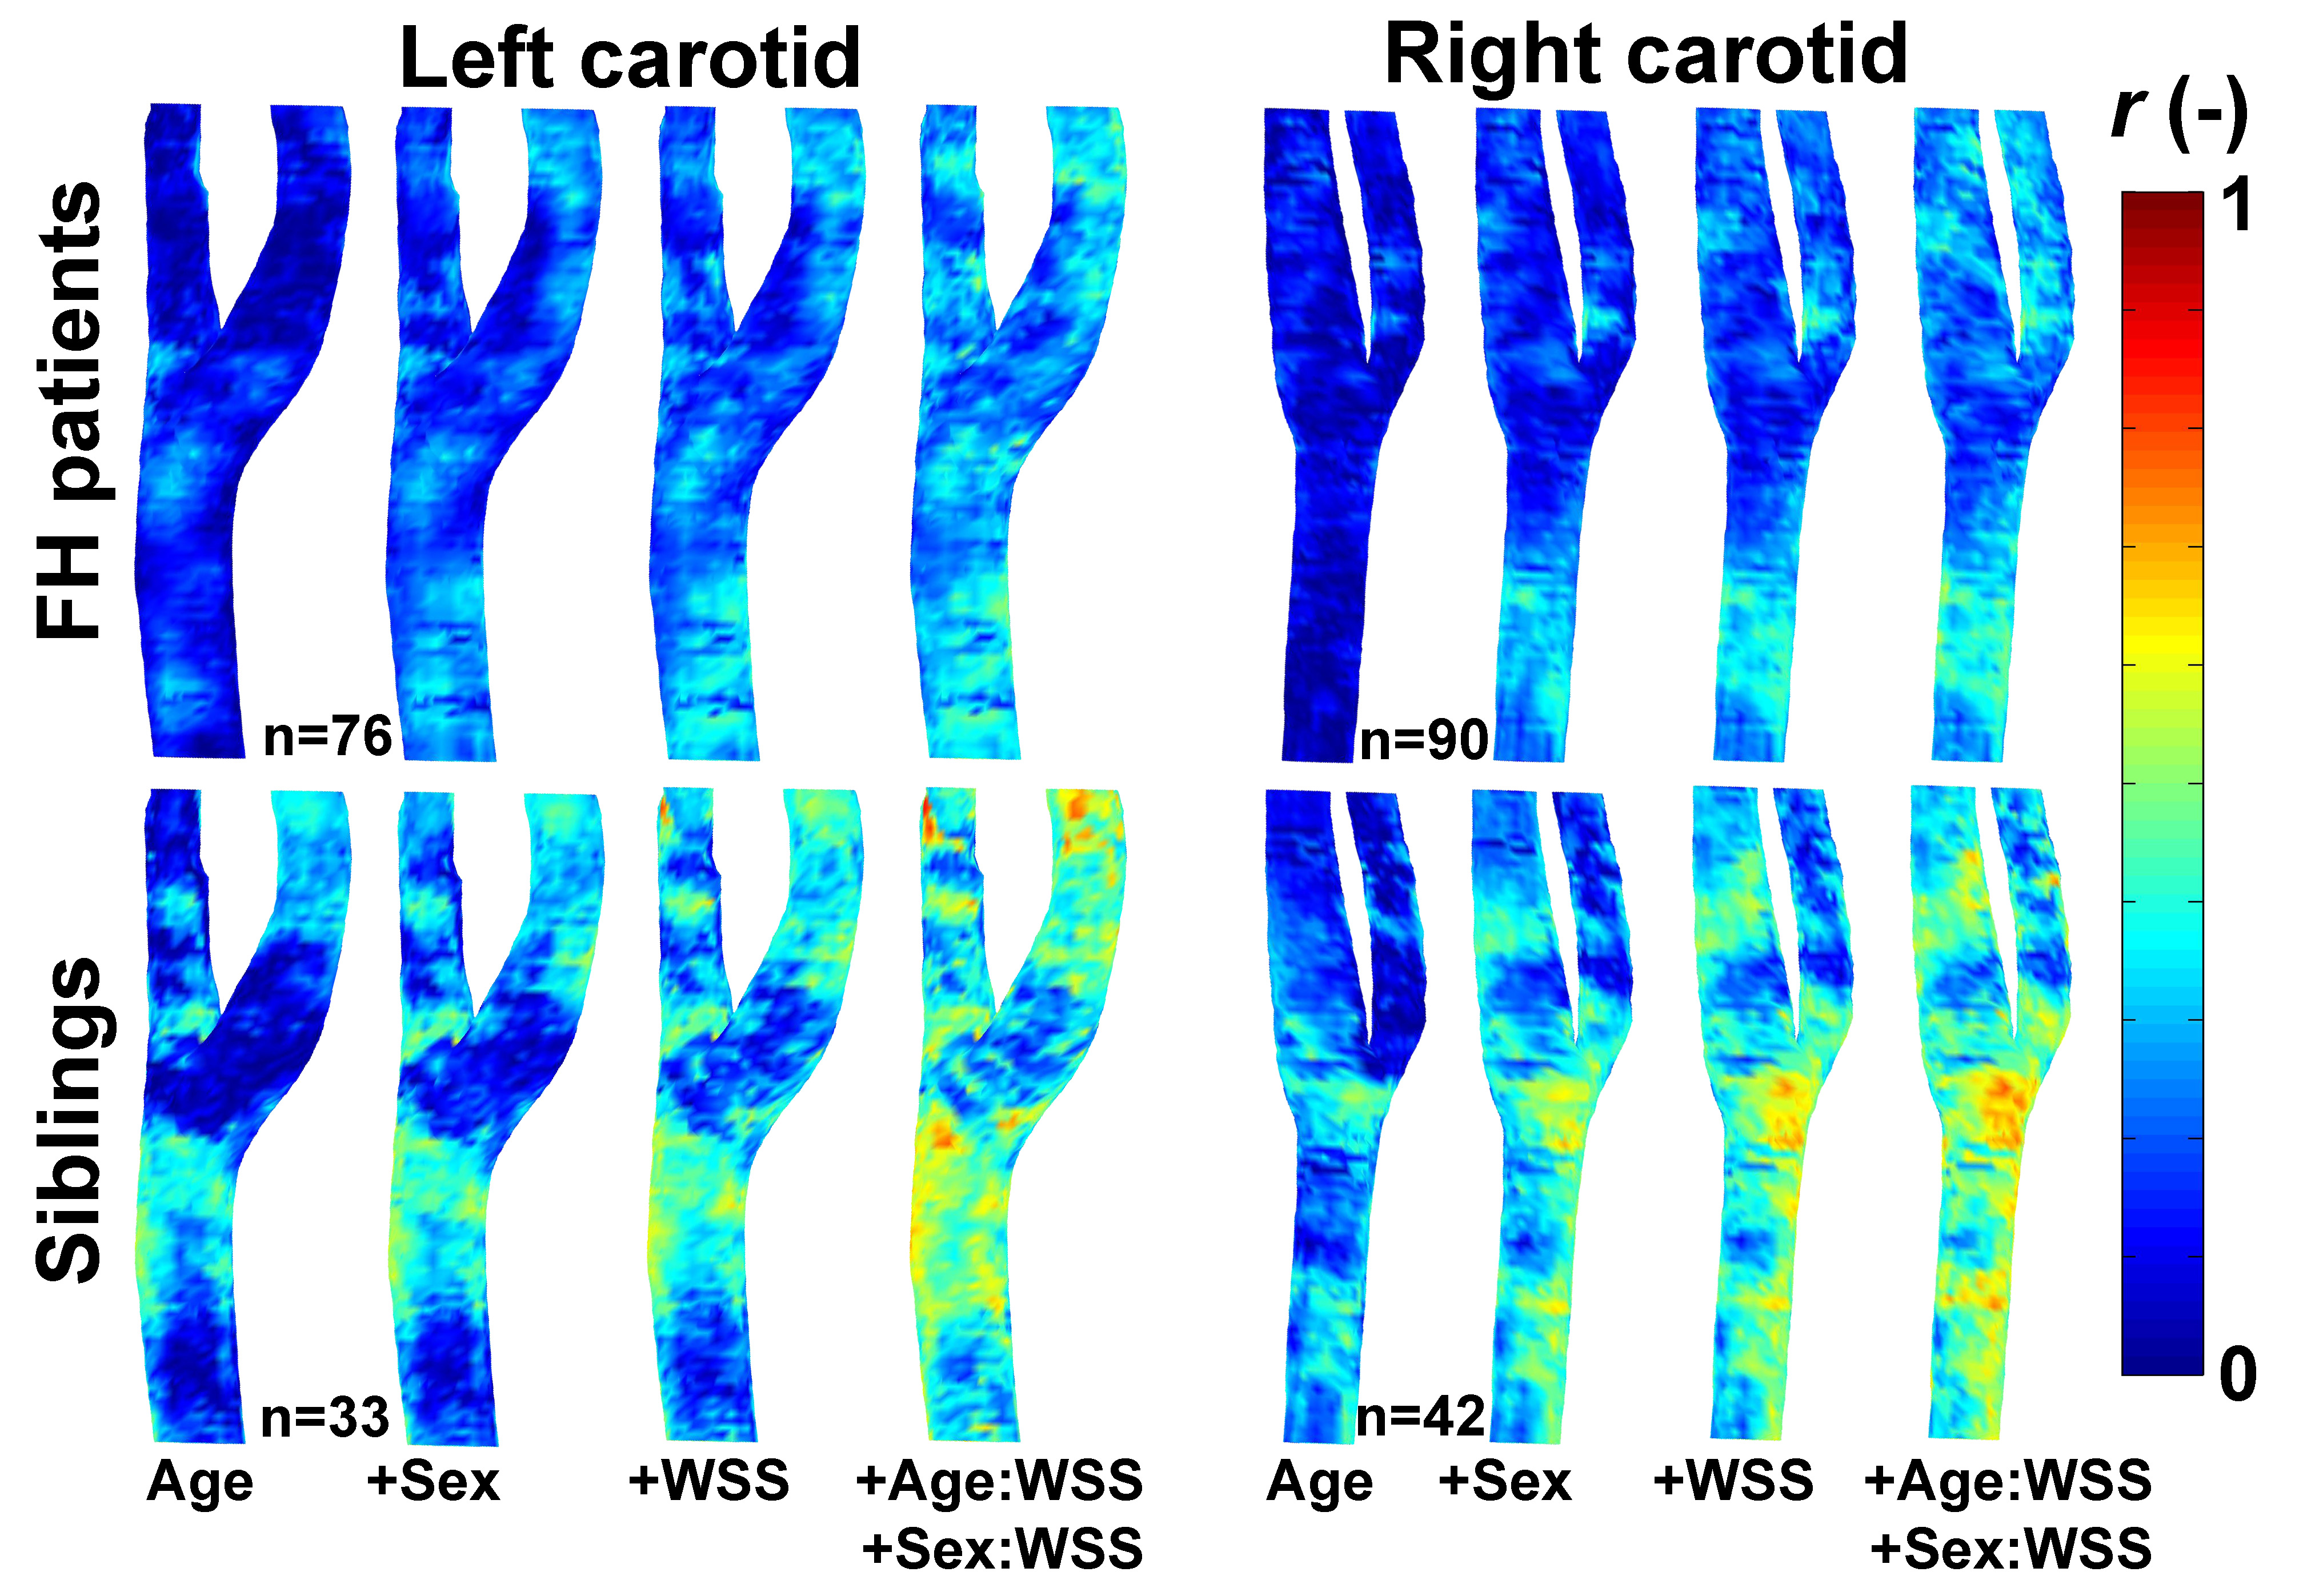
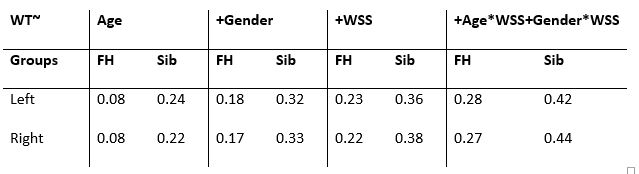
Analysis 2: On each wall point, the regression coefficient r of WT with 1)age, 2)age+sex, 3)age+sex+WSS and 4)age+sex+WSS+WSS corrected for age and sex, was calculated for patients and siblings separately [11].
Results
In figure 1 an overview of the study population is given. About 18% of 4D flow and 25% of BB data were excluded due to insufficient image quality. WSS and WT derivations for one subject are displayed in figure 2.For all analyses age was identical (31±3 years), men/women ratios were 1:0.7 for patients and 1:1.5 for siblings. In figure 3, the ensemble-averaged maps and p-value maps are shown. There were no significant differences in WSS or WT between patients and siblings. In figure 4, the r-maps are shown and in table 3 the median r is given for each regression model. Siblings had higher median r than patients in all models.
Discussion
Machine learning segmentations and data quality were visually assessed by lack of gold standard. Based on this assessment a relatively large portion of both patients and siblings was excluded which can be attributed to subject motion, ECG failure, neck-fat content, also resulting in segmentation failure. Nevertheless, ensemble-averaged maps clearly showed low WSS and high WT in the carotid bulb for both groups. Patients did not have higher WT than siblings, which may be an effect of lifelong adequate statin therapy. The correlation coefficients between WT and WSS were lower for patients, which may relate to abnormal wall remodeling processes. With inclusion of pulse wave velocity (for vessel stiffness), smoking status and blood pressure in the regression model, this abnormal behavior can be further elucidated.Conclusion
3D mapping techniques showed that there were no differences in carotid WT and WSS between FH patients on lifelong statin therapy and their unaffected siblings. The relation of WT with age, sex and WSS was weaker for patients.Acknowledgements
No acknowledgement found.References
1. Luirink IK, Wiegman A, Kusters DM, Hof MH, Groothoff JW, de Groot E, et al. 20-Year Follow-up of Statins in Children with Familial Hypercholesterolemia. N Engl J Med. 2019;381:1547–56.
2. Malek AM, Alper SL, Izumo S. Hemodynamic shear stress and its role in atherosclerosis. J Am Med Assoc. 1999;282:2035–42.
3. van Ooij P, Cibis M, Rowland EM, Vernooij MW, van der Lugt A, Weinberg PD, et al. Spatial correlations between MRI-derived wall shear stress and vessel wall thickness in the carotid bifurcation. Eur Radiol Exp. 2018;2:27.
4. Pedersen H, Kozerke S, Ringgaard S, Nehrke K, Kim WY. k-t PCA: Temporally constrained k-t BLAST reconstruction using principal component analysis. Magn Reson Med. 2009;62:706–16.
5. Coolen BF, Motaal AG, Potters W V., Versluis M, Strijkers GJ, Nederveen AJ. Prospective Acceleration and CS Reconstruction for 3D Isotropic High-Resolution Carotid Imaging. Proc Intl Soc Mag Reson Med 24. 2016. p. 2546.
6. Uecker M, Tamir J, Ong F, Holme C, Lustig M. BART: version 0.4.01. 2017.
7. Isensee F, Jaeger PF, Kohl SAA, Petersen J, Maier-Hein KH. nnU-Net: a self-configuring method for deep learning-based biomedical image segmentation. Nat Methods. 2021;18:203–11.
8. Potters WV, van Ooij P, Marquering HA, VanBavel E, Nederveen AJ. Volumetric arterial wall shear stress calculation based on cine phase contrast MRI. J Magn Reson Imaging. 2015;41:505–16.
9. Alblas D, Brune C, Wolterink J. Deep-learning-based carotid artery vessel wall segmentation in black-blood MRI using anatomical priors. In: Išgum I, Colliot O, editors. Med Imaging 2022 Image Process. SPIE; 2022. p. 24.
10. Audenaert EA, Van Houcke J, Almeida DF, Paelinck L, Peiffer M, Steenackers G, et al. Cascaded statistical shape model based segmentation of the full lower limb in CT. Comput Methods Biomech Biomed Engin [Internet]. 2019;22:644–57.
11. van Ooij P, Collins J, Fedak P, Nederveen A, Carr J, Markl M, et al. 3D Linear Regression Analysis Reveals Relationships of 4D flow MRI-derived Aortic Dimensions with Age, Gender and Wall Shear Stress in Patients with Aortopathy. Proc Intl Soc Mag Reson 25. 2017. p. 0288.
Figures