1311
White matter changes underlying cortical changes across the lifespan1Vanderbilt University Medical Center, Nashville, TN, United States, 2Institut des Maladies Neurodégénératives-UMR, Bordeaux, France, 3Sherbrooke University, Sherbrooke, QC, Canada, 4Vanderbilt University School of Medicine, Nashville, TN, United States, 5Vanderbilt University, Nashville, TN, United States, 6King's College London, London, United Kingdom
Synopsis
Keywords: White Matter, Aging
Brain functions are a property of the interaction between brain areas. While much is known about cortical structure and the structural connections in the white matter, the interaction between the cortex and white matter is underexplored. Here, we aim to investigate and characterize the relationship between white and cortical changes across the lifespan. We use the functionnectome framework to associate white matter to morphological features of the cortex. Biologically, this white matter influences (or is influenced by) these cortical changes.Introduction
There have been a large number of studies of age-related changes in brain morphometry. In the cortex, measures of cortical thickness as measured with structural MRI have been well-characterized, with established associations with aging, disease mechanisms, and cognition [1-4]. In the white matter (WM), the microstructure and morphology of white matter pathways measured with diffusion MRI has similarly been applied for insight into brain function, development, cognition, disease, and disorders [5, 6]. However, the complex interplay and relationships between the structural connections of the brain and cortical structure has been less thoroughly investigated.Recently, a framework called functionnectome [7] was developed which enables the analysis of the contribution of WM structure to signal in the cortex. While this framework was intended to investigate functional magnetic resonance imaging, it can be leveraged with any signal from the cortex to explore the involvement of white matter circuits in different aspects of brain dynamics. With this framework, we aim to characterize the WM that is associated with cortical changes across the lifespan. We investigate how cortical thickness changes across the lifespan, how these changes are reflected in WM regions, and which features of the cortex are most influenced by WM and GM tissue microstructure.
Methods
DatasetsWe used structural and diffusion MRI data from the Human Connectome Project Development study (N=636, ages 5-21), the Human Connectome Project Young Adult study (N=1065, ages 21-35), and the Human Connectome Project Aging study (N=720, ages 35-100) [8]. The pooled dataset comprised 2421 participants and spanned the ages of 5-100.
Features
Structural images are processed with FreeSurfer [9], resulting in surface based cortical measures of thickness. Diffusion data were processed with diffusion tensor imaging and neurite orientation dispersion and density imaging [10] techniques, resulting in voxelwise maps of mean diffusivity (MD), fractional anisotropy (FA), intracellular volume fraction (ICVF), and orientation dispersion (OD).
Functionnectome framework
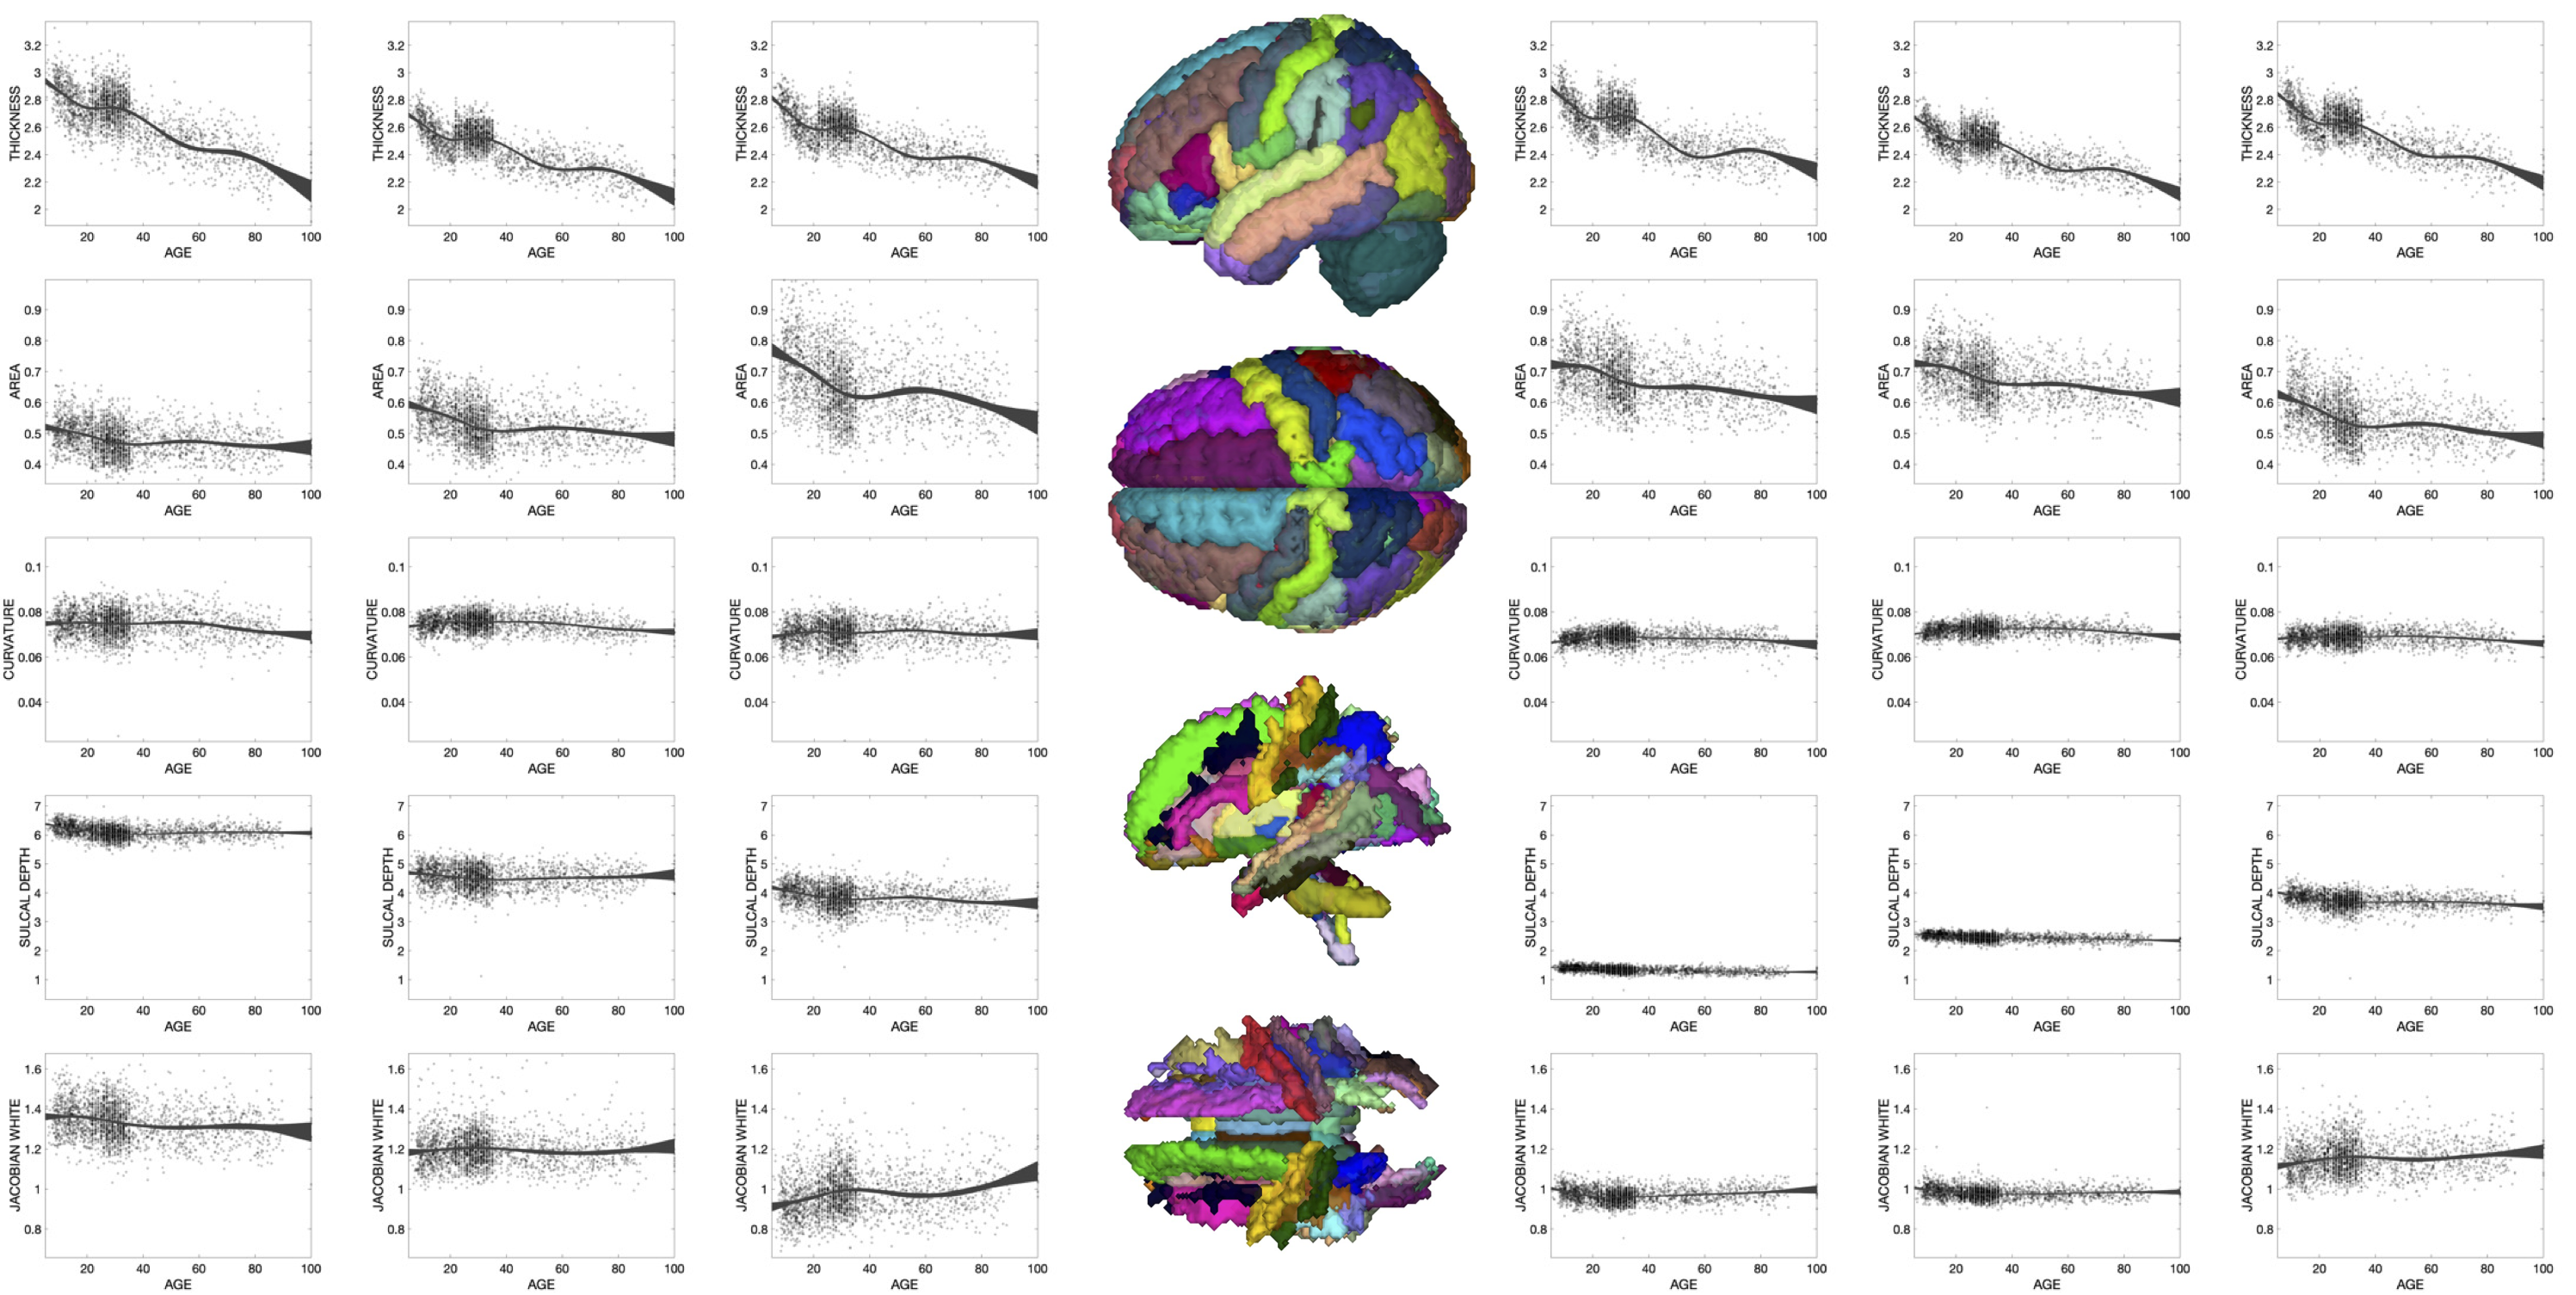
The functionnectome framework allows propagation of cortical features into the WM using a population-based tractography template (Figure 1). This resulted in voxel-wise maps of cortical features (i.e., cortical thickness) throughout the entire brain. Region of interest analysis was performed using GM regions defined by Desikan-Killey atlas [11], and WM regions defined by the Johns Hopkins WM labels.
Change
Cross-sectional trends across the lifespan were analyzed using restricted cubic spline regression to model nonlinear relationships with age. Average cortical features and average percent change per year can be quantified for selected developmental time points of 5, 22, 35, and 90 years of age.
Results
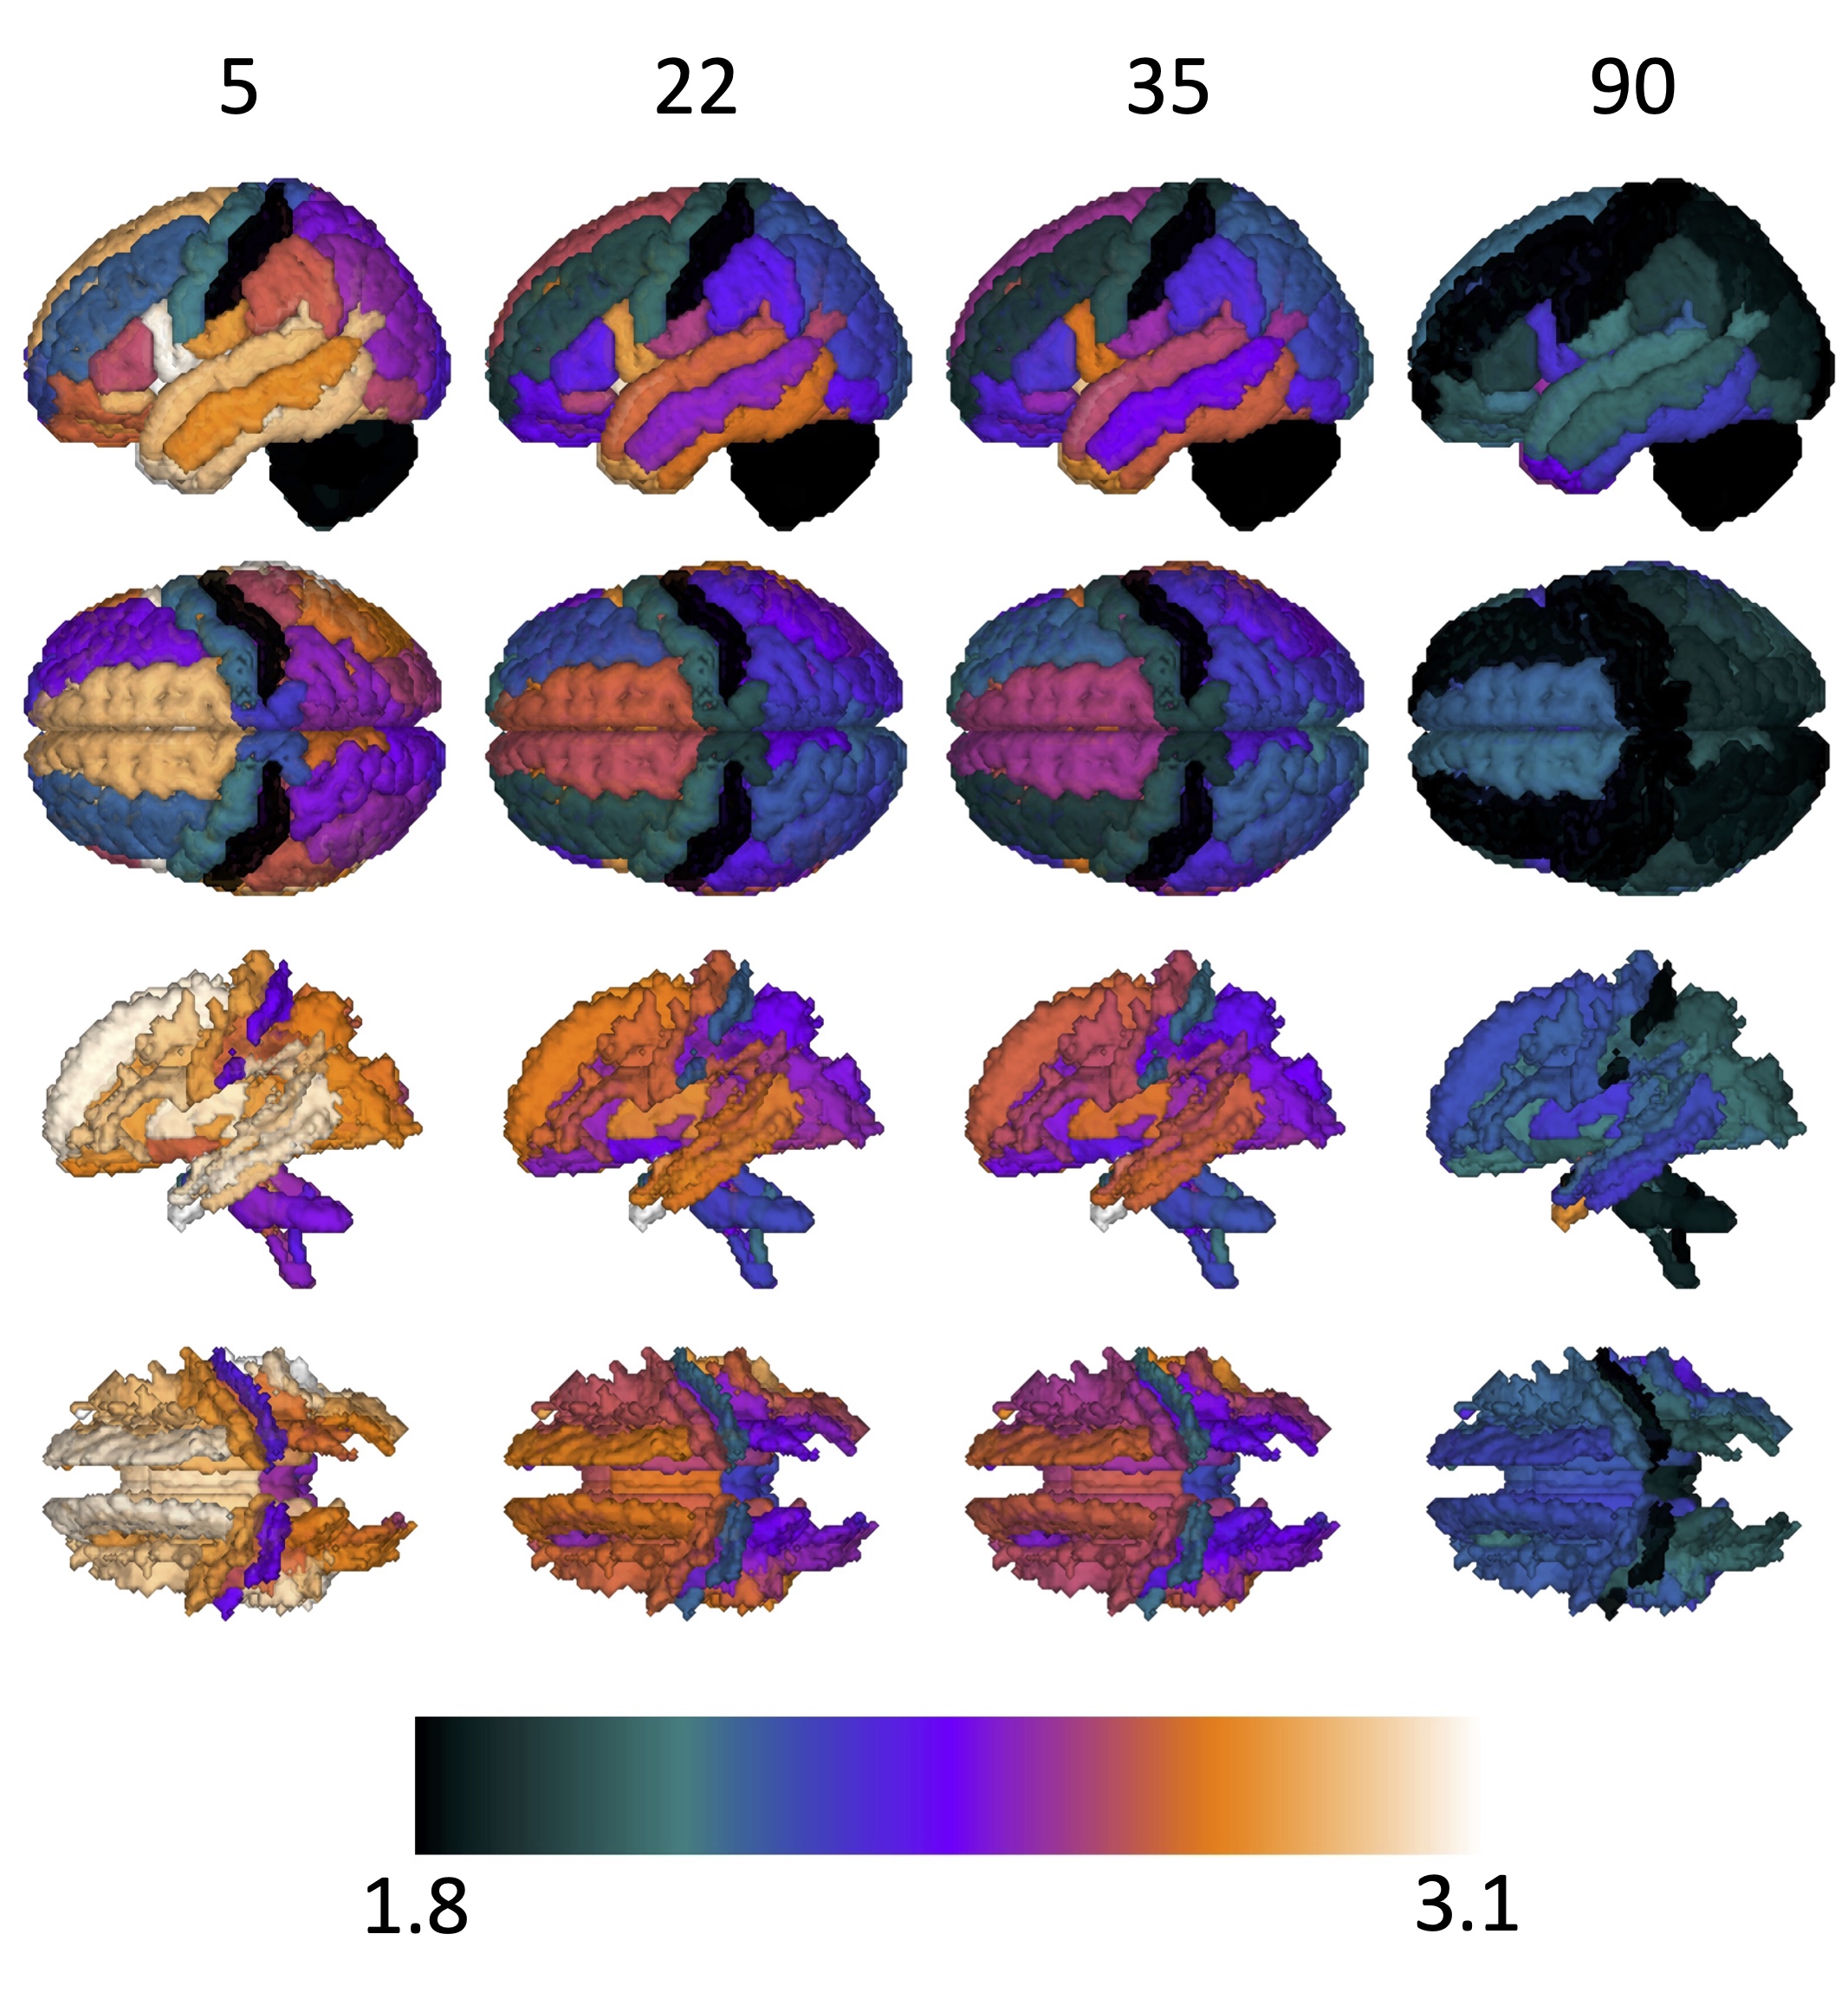
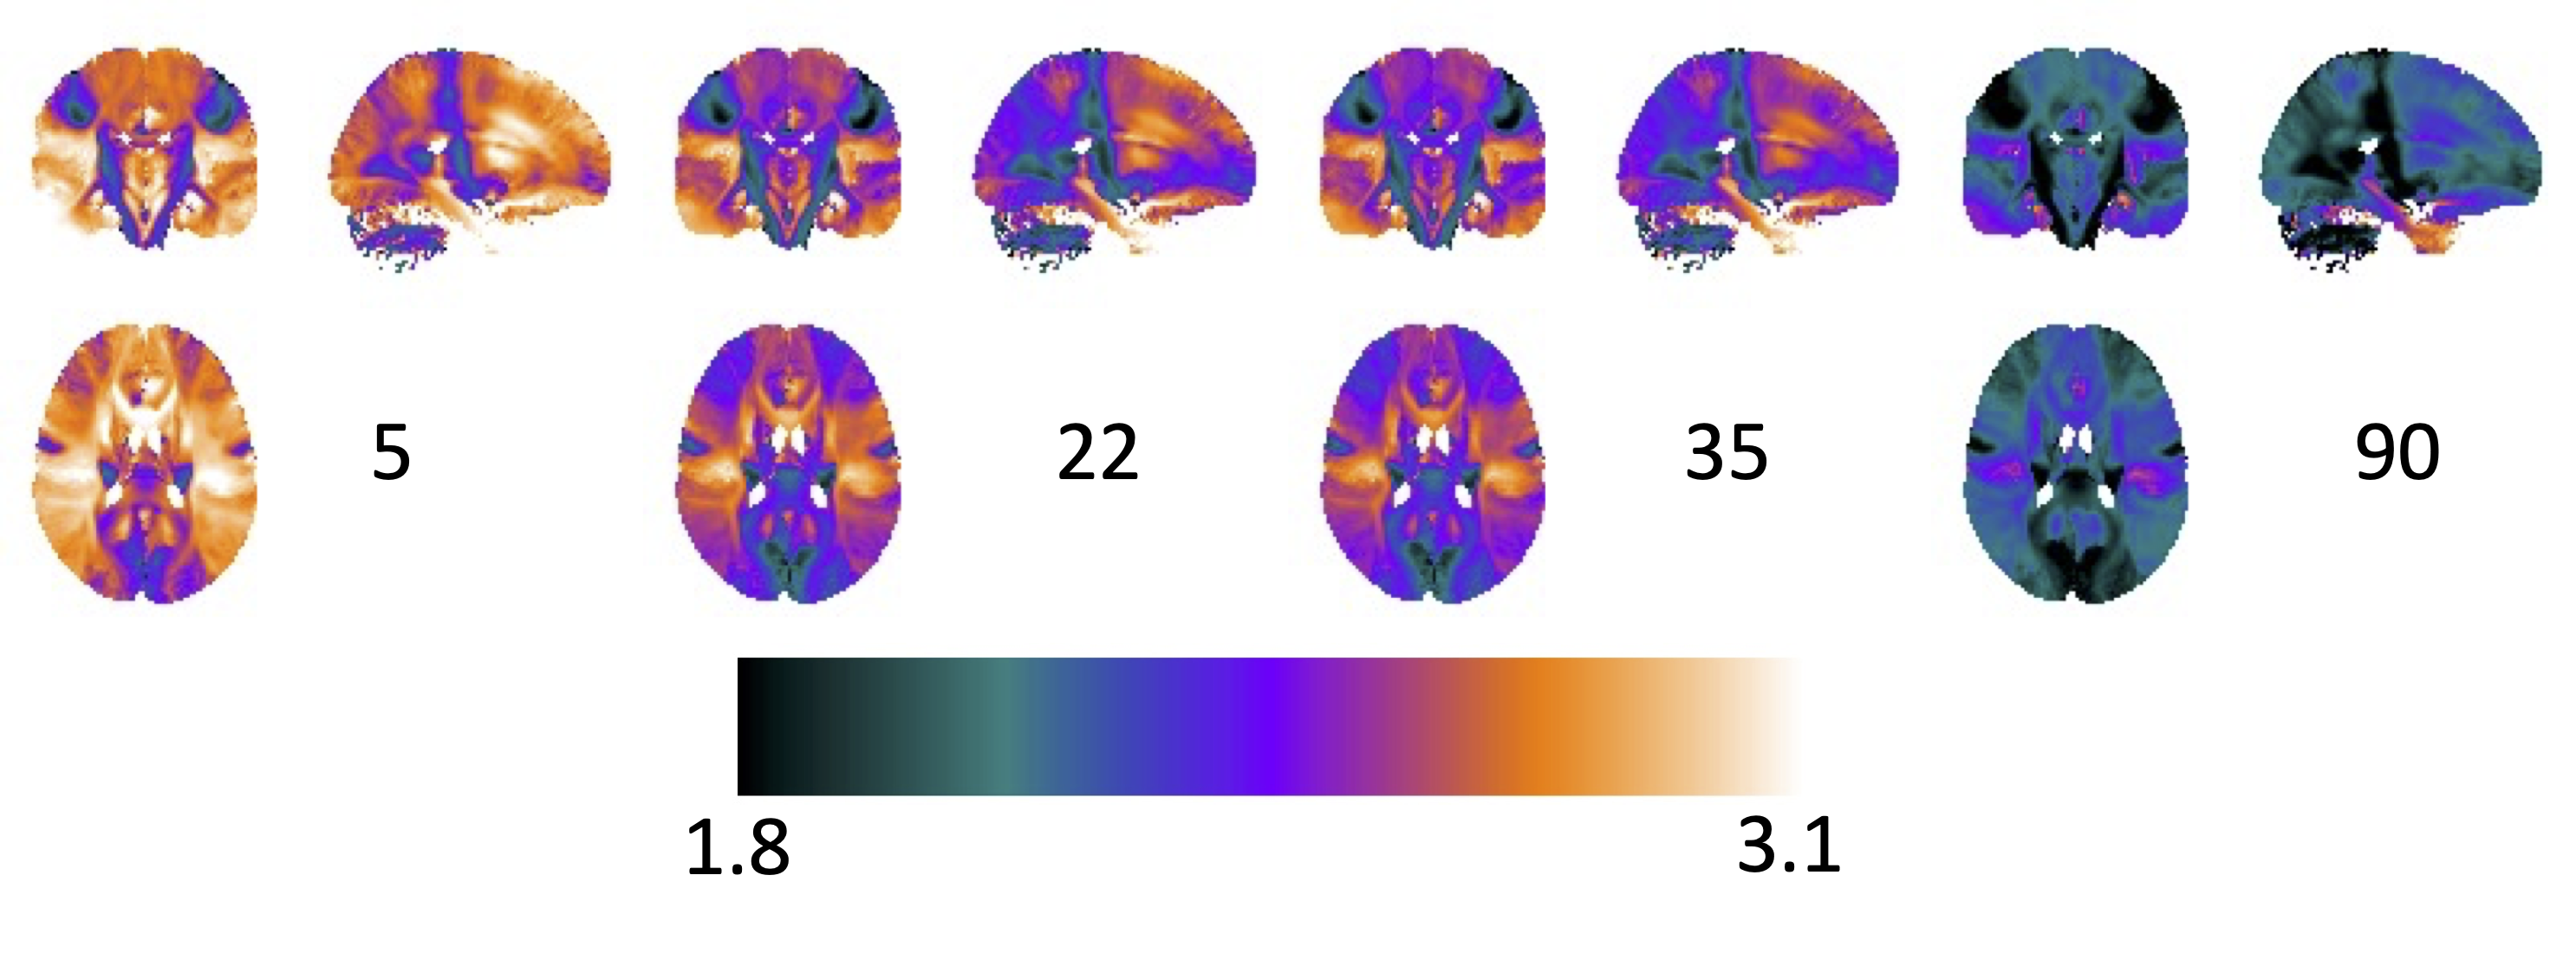
What is the average cortical thickness at different periods throughout the lifespan?Figure 2 shows the population averaged cortical thickness at several selected points in the human lifespan (top: cortical thickness; bottom: cortical thickness of associated WM). In agreement with literature [1], cortical thickness is greatest in childhood and decreases throughout adulthood, with regional variability across the brain that is laterally symmetric, and most thin in sensory areas [12, 13]. More uniquely, WM associated with these areas can now be visualized, with WMr in the superior frontal and superior temporal lobes associated with the thickest cortical areas. Similar results can be observed in Figure 3, which shows voxel-wise maps of cortical thickness of the same age periods.
How does the cortical thickness change throughout the lifespan?
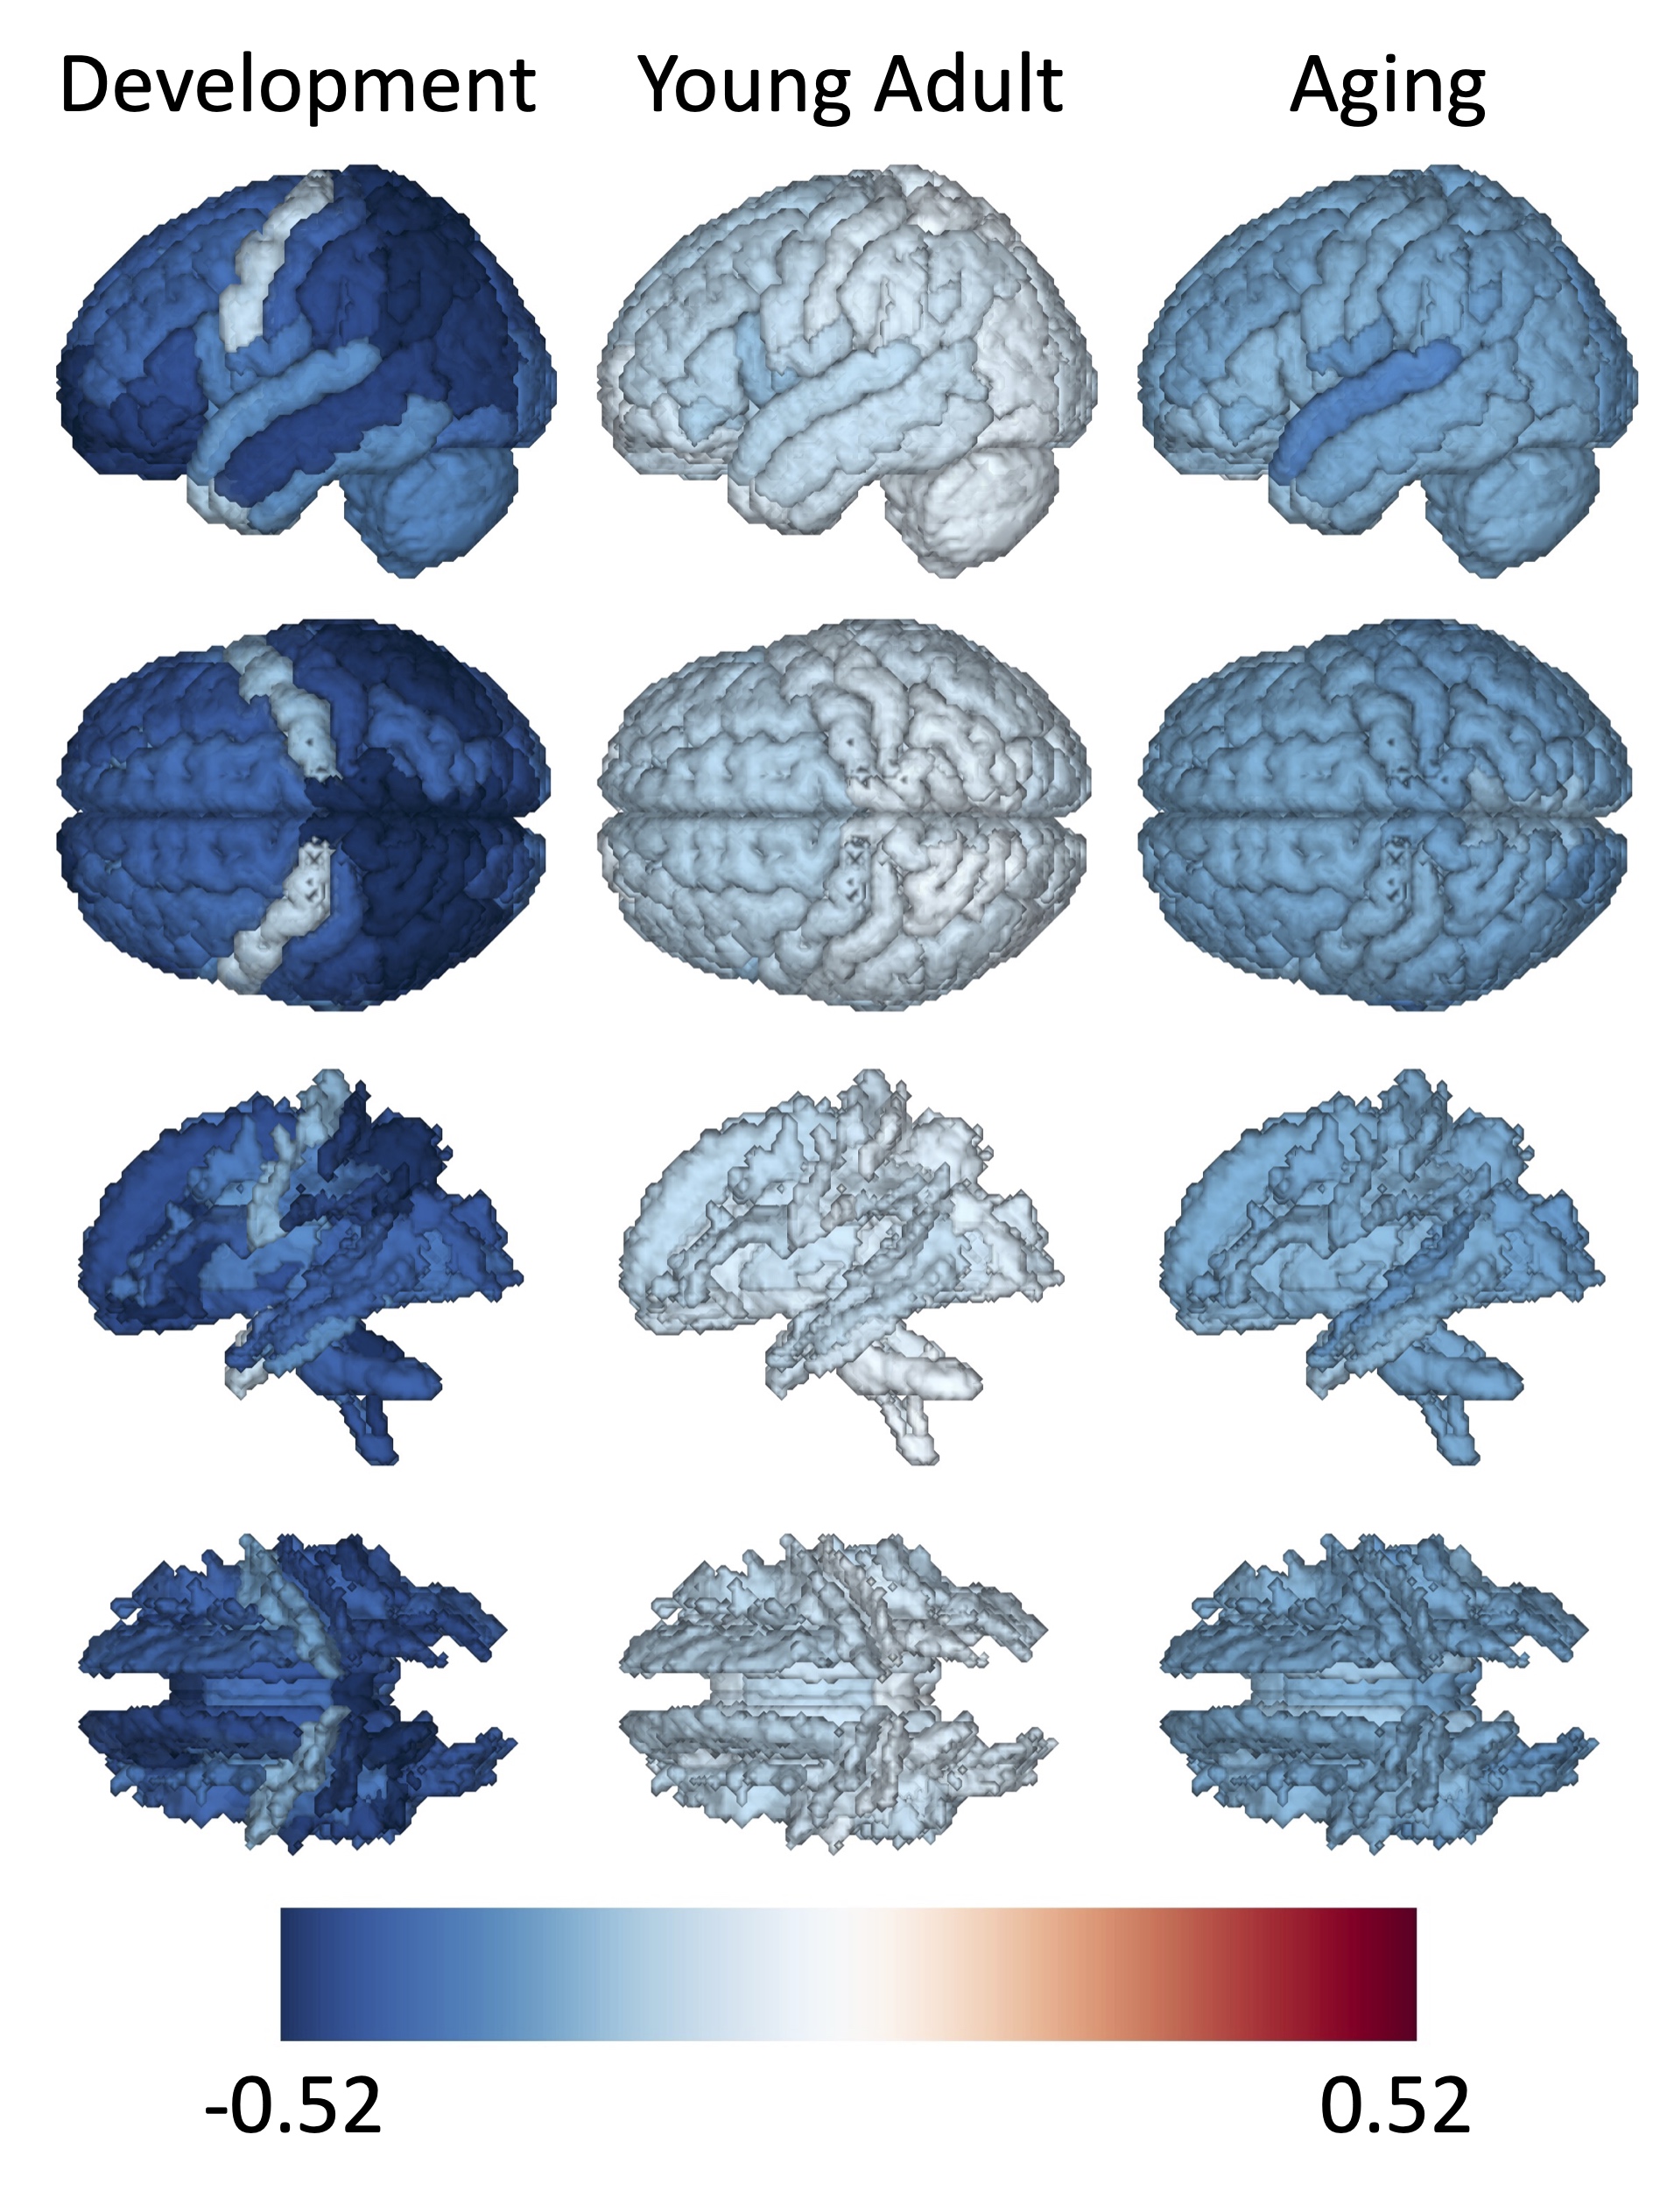
The percent change with age is shown in Figure 4 (top: GM; bottom: associated WM), showing the average percent change during development (5-21), young adulthood (21-35), and mid-late life aging (35+). Again, in agreement with the literature [1], there is a steep decrease in thickness during first 2-3 decades of life and gradual monotonic decrease in middle and late life, with heterogenous changes across the brain. While the percent change in WM is more homogenous from young adulthood and mid-life, the cortical spinal tract is responsible for the least decrease during development, whereas WM in the superior parietal lobe is associated with greater decrease in thickness.
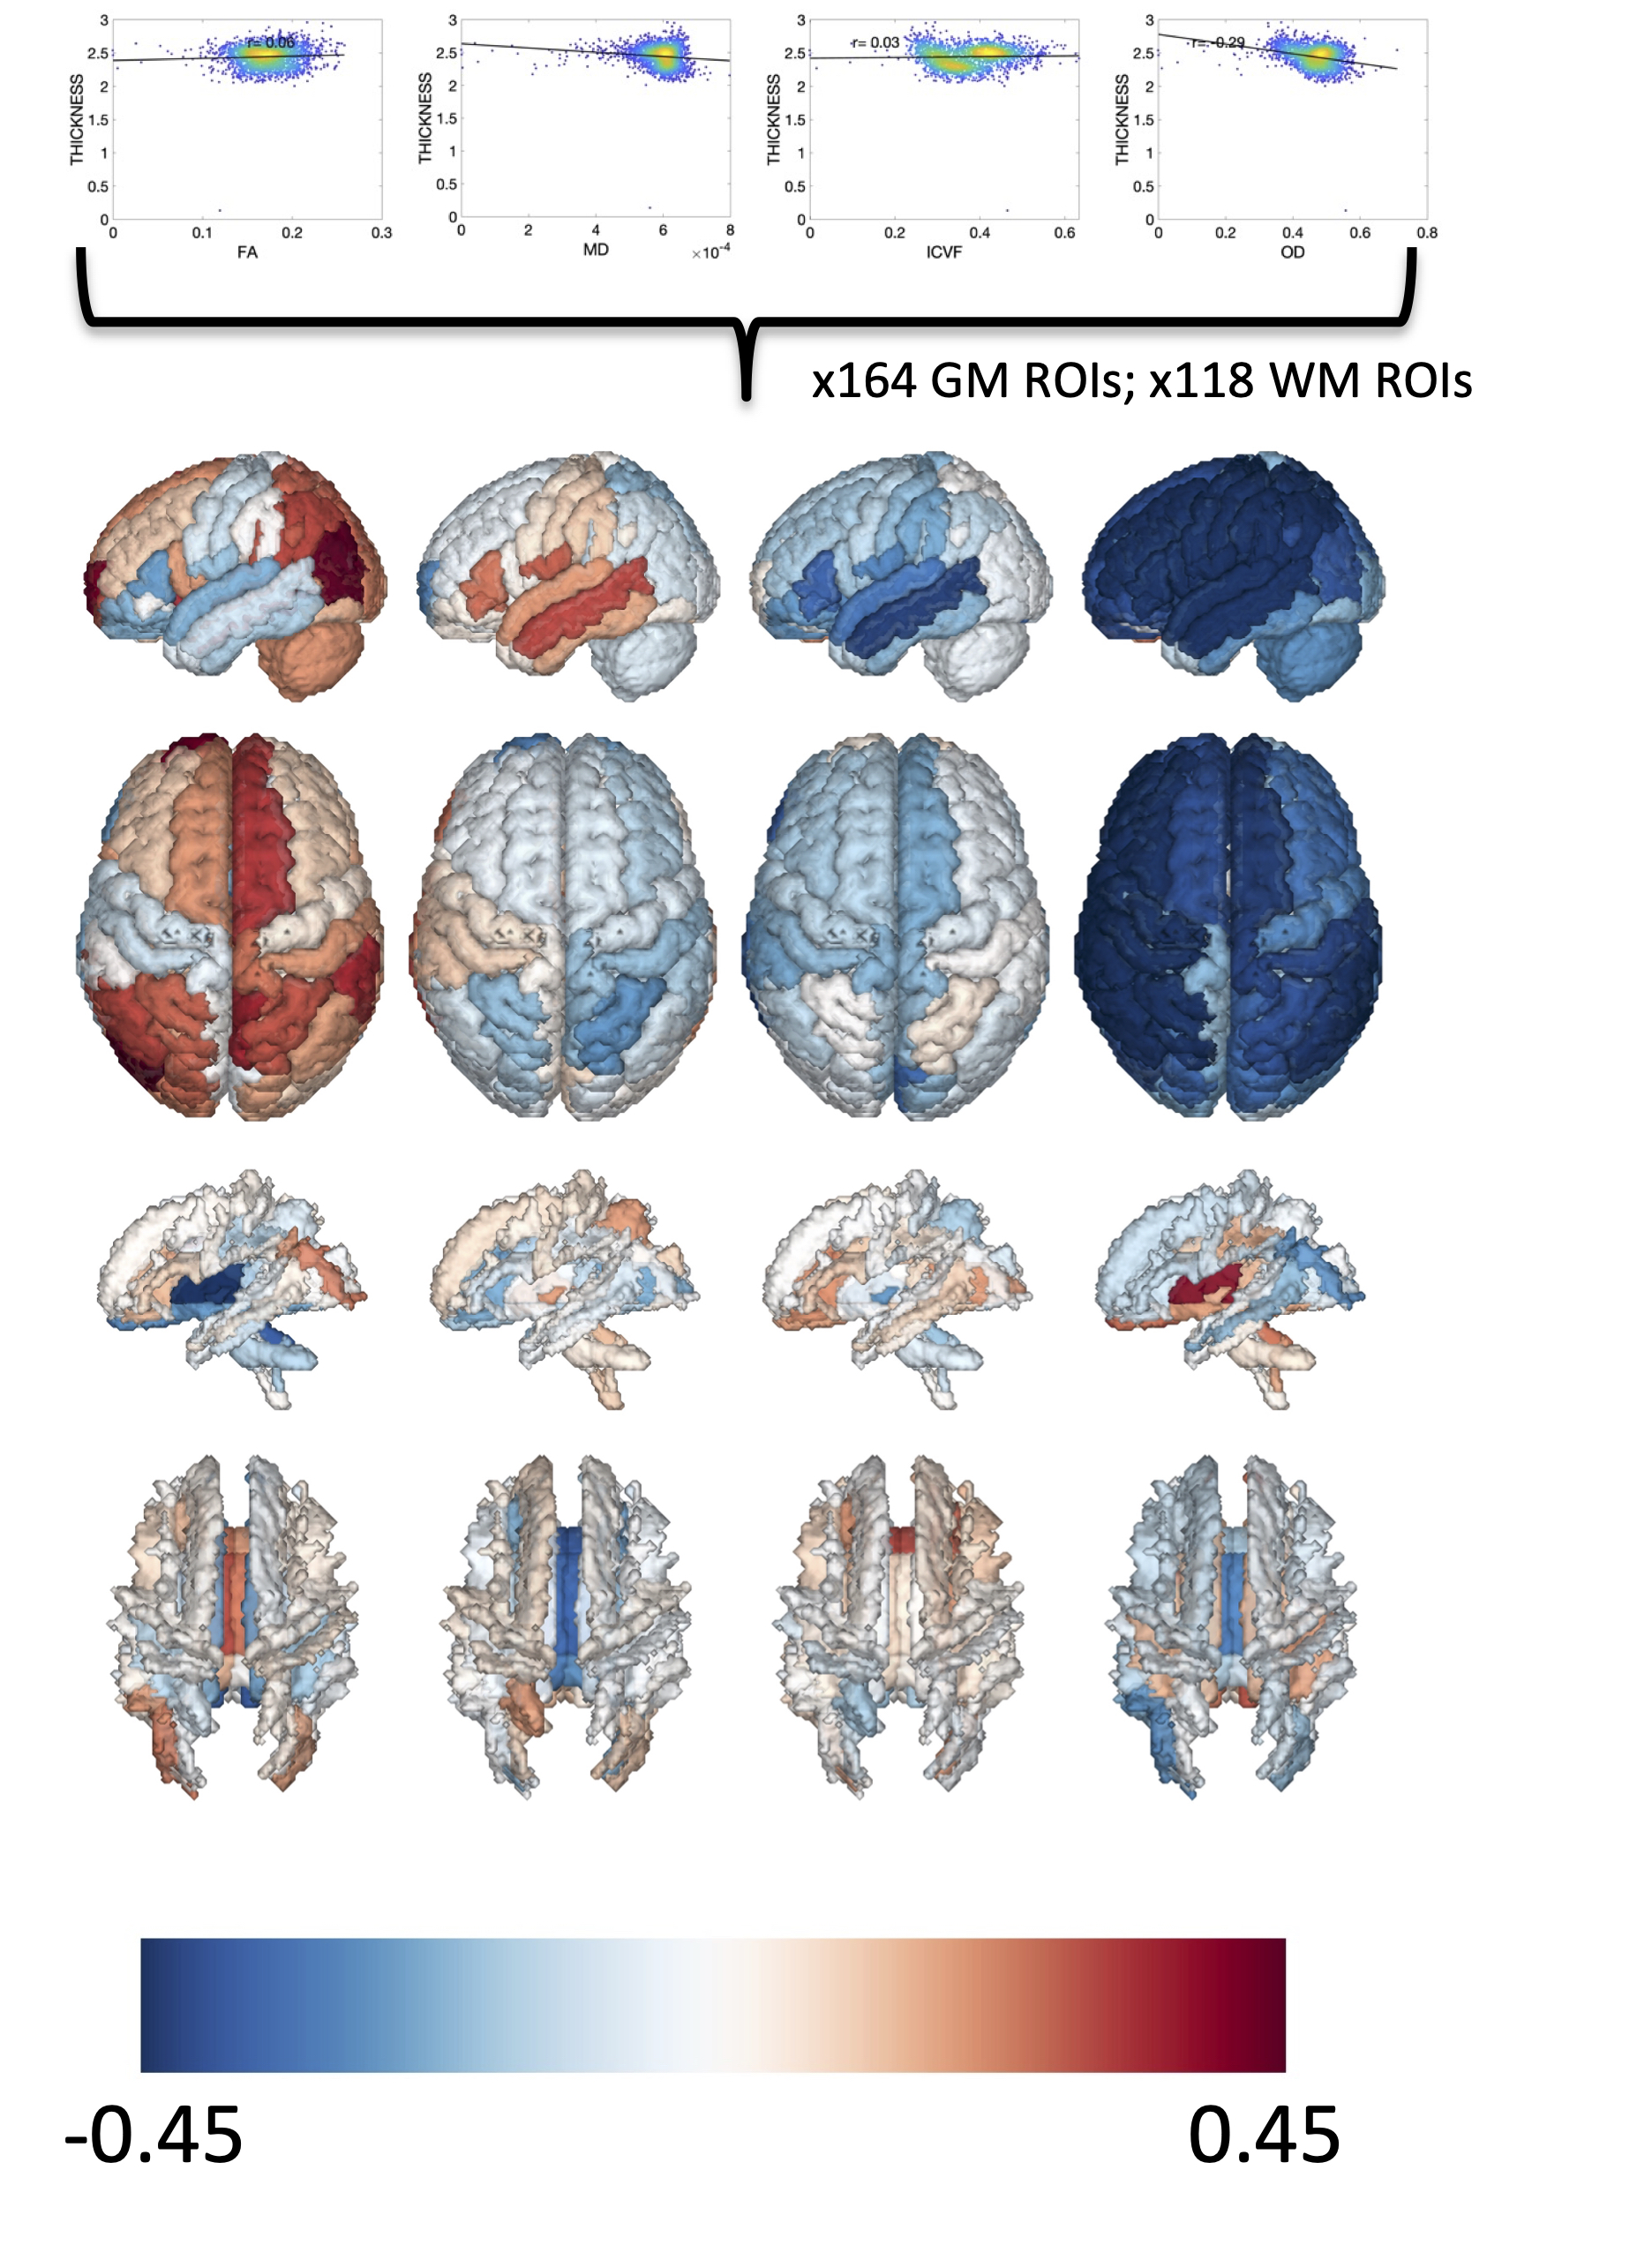
Where does tissue microstructure influence cortical morphology?
Figure 5 shows the relationship between white matter microstructure and cortical thickness in each region of interest. FA of the GM is positively related to cortical thickness in superior frontal, parietal, and occipital areas, and in the WM is positively associated with occipital white matter and the corpus callosum. In the GM, larger dispersion is negatively associated with thickness, with more homogenous changes in WM.
Discussion
We utilize the functionnectome framework to investigate WM associated with features of the cortex and its changes. While many of the relationships are intuitive (i.e., a change in cortical thickness of the precentral gyrus is clearly associated with the corticospinal tract), the next step in this analysis allows investigation of potential microstructural changes that may drive (or be driven by) these changes. We find strong correlative relationships between cross sectional analysis of white and gray matter regions and cortical thicknesses. Future work should investigate relative timings of microstructure and morphology, as well as other features of the cortex including curvature and surface areas. Finally, higher specificity may be enabled through subject specific tractography. Together, this framework can be used to integrate gray and white matter tissues to understand the interconnections between regions and between tissue types.Acknowledgements
This work was supported by the National Science Foundation Career Award #1452485, the National Institutes of Health under award numbers R01EB017230, K01EB032898, and in part by ViSE/VICTR VR3029 and the National Center for Research Resources, Grant UL1 RR024975–01.References
1. Frangou, S., et al., Cortical thickness across the lifespan: Data from 17,075 healthy individuals aged 3-90 years. Hum Brain Mapp, 2022. 43(1): p. 431-451.
2. Dominguez, E.N., et al., Regional Cortical Thickness Predicts Top Cognitive Performance in the Elderly. Front Aging Neurosci, 2021. 13: p. 751375.
3. Steffener, J., Education and age-related differences in cortical thickness and volume across the lifespan. Neurobiol Aging, 2021. 102: p. 102-110.
4. Habeck, C., et al., Cortical thickness and its associations with age, total cognition and education across the adult lifespan. PLoS One, 2020. 15(3): p. e0230298.
5. Jones, D.K., Diffusion MRI : theory, methods, and application. 2010, Oxford ; New York: Oxford University Press. xvi, 767 p.
6. Le Bihan, D. and M. Iima, Diffusion Magnetic Resonance Imaging: What Water Tells Us about Biological Tissues. PLOS Biology, 2015. 13(7): p. e1002203.
7. Nozais, V., et al., Functionnectome as a framework to analyse the contribution of brain circuits to fMRI.Commun Biol, 2021. 4(1): p. 1035.
8. Van Essen, D.C., et al., The Human Connectome Project: a data acquisition perspective. Neuroimage, 2012. 62(4): p. 2222-31.
9. Fischl, B., FreeSurfer. Neuroimage, 2012. 62(2): p. 774-81.
10. Zhang, H., et al., NODDI: practical in vivo neurite orientation dispersion and density imaging of the human brain. Neuroimage, 2012. 61(4): p. 1000-16.
11. Desikan, R.S., et al., An automated labeling system for subdividing the human cerebral cortex on MRI scans into gyral based regions of interest. Neuroimage, 2006. 31(3): p. 968-80.
12. Fjell, A.M. and K.B. Walhovd, Structural brain changes in aging: courses, causes and cognitive consequences. Rev Neurosci, 2010. 21(3): p. 187-221.
13. Fischl, B. and A.M. Dale, Measuring the thickness of the human cerebral cortex from magnetic resonance images. Proc Natl Acad Sci U S A, 2000. 97(20): p. 11050-5.
Figures