1310
Metabolite T1 relaxation times differ across the adult lifespan1The Russell H. Morgan Department of Radiology and Radiological Science, Johns Hopkins University School of Medicine, Baltimore, MD, United States, 2F.M. Kirby Research Center for Functional Brain Imaging, Kennedy Krieger Institute, Baltimore, MD, United States, 3Departments of Radiology, Shandong Provincial Hospital Affiliated to Shandong First Medical University, Shandong, China, 4Departments of Radiology, Shandong Provincial Hospital, Shandong University, Shandong, China
Synopsis
Keywords: Spectroscopy, Aging, T1 relaxation times, Macromolecules, Human brain
This work investigates the age-dependence of metabolite T1 relaxation times at 3T. T1 relaxation times were estimated by modeling the residual metabolite amplitudes in macromolecular spectra, acquired with pre-inversion. Posterior cingulate (PCC) and centrum semiovale (CSO) spectra were acquired in 102 healthy volunteers across five decades of adult life (20 to 69 years). T1 relaxation times of both tNAA2.0 and tCr3.0 significantly negatively correlated with age in CSO, and not in PCC. This has important implications for MRS studies of aging which tend to assume T1 relaxation times are constant as a function of age.Introduction
Understanding the neurometabolic changes that underly healthy aging is a major area of neuroscientific research. Proton magnetic resonance spectroscopy is the only methodology that can non-invasively quantify metabolite concentrations in the human brain. However, consensus methods for MRS assume that metabolite relaxation times are constant across the adult lifespan, meaning that it is not possible to separate age-related changes in metabolite levels and metabolite signal relaxation (which index different biophysical processes). For water-referenced MRS to be fully quantitative, we must establish whether T1 relaxation times of metabolites change with healthy aging in order to correct appropriately for T1-weighting of the measurement1-3.Metabolite T2 relaxation times have been relatively well studied in the human brain with aging4-11. Most studies report a decrease in metabolite T2 relaxation times with age, which is attributed to changes in the cellular microenvironment and accumulation of iron6,8-11. T1 relaxation times have only been observed twice in aging populations4,5. Christiansen et al4 found no significant difference in metabolite T1s in the occipital lobe at 1.5T with eight aged subjects. Subsequently, Kreis et al5 showed a significant decrease in the T1 relaxation times of N-acetylaspartate (NAA) and creatine (tCr) methyl groups in centrum semiovale (CSO) at 1.5T, with only five subjects above 60 years of age. No subsequent study has resolved these conflicting results. Therefore, the purpose of this study was to investigate metabolite T1 relaxation times at 3T in a large aging cohort in both gray matter (GM)- and white matter (WM)-rich regions.
Methods
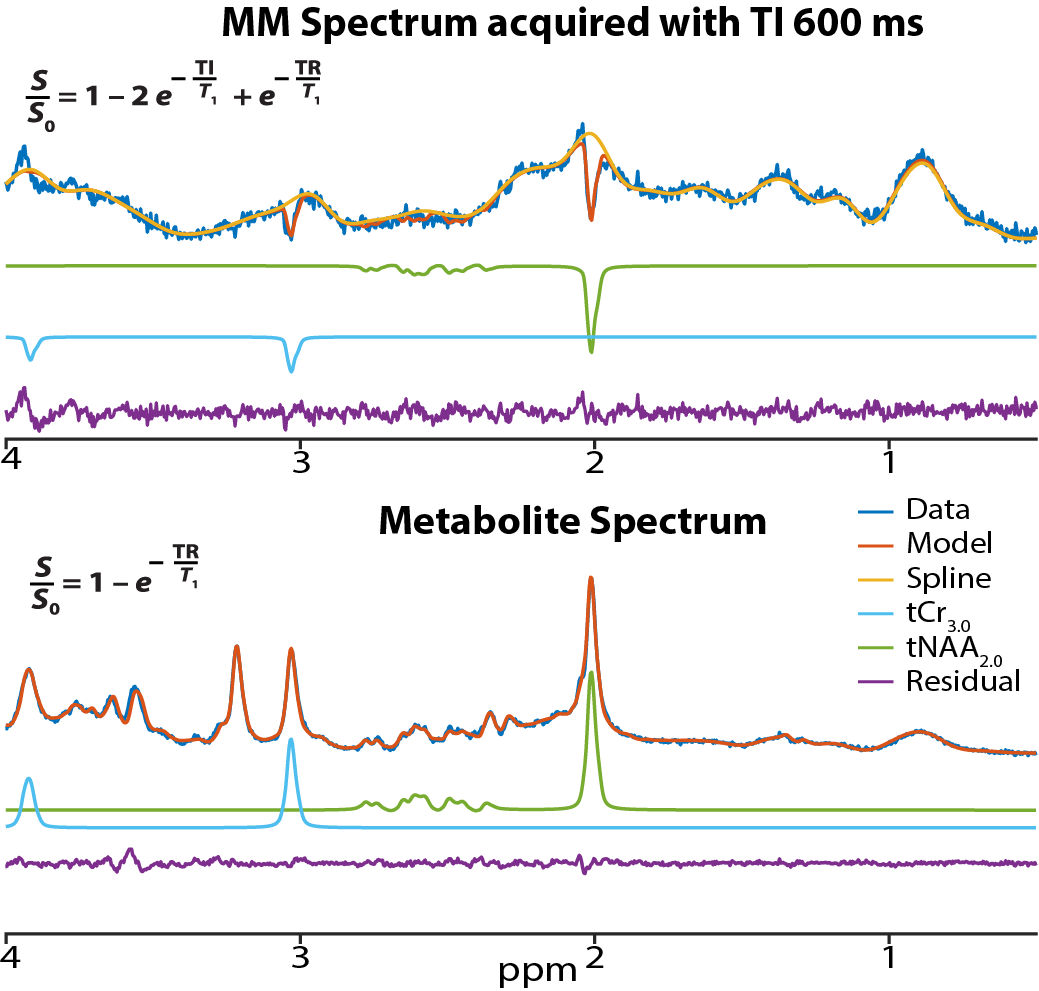
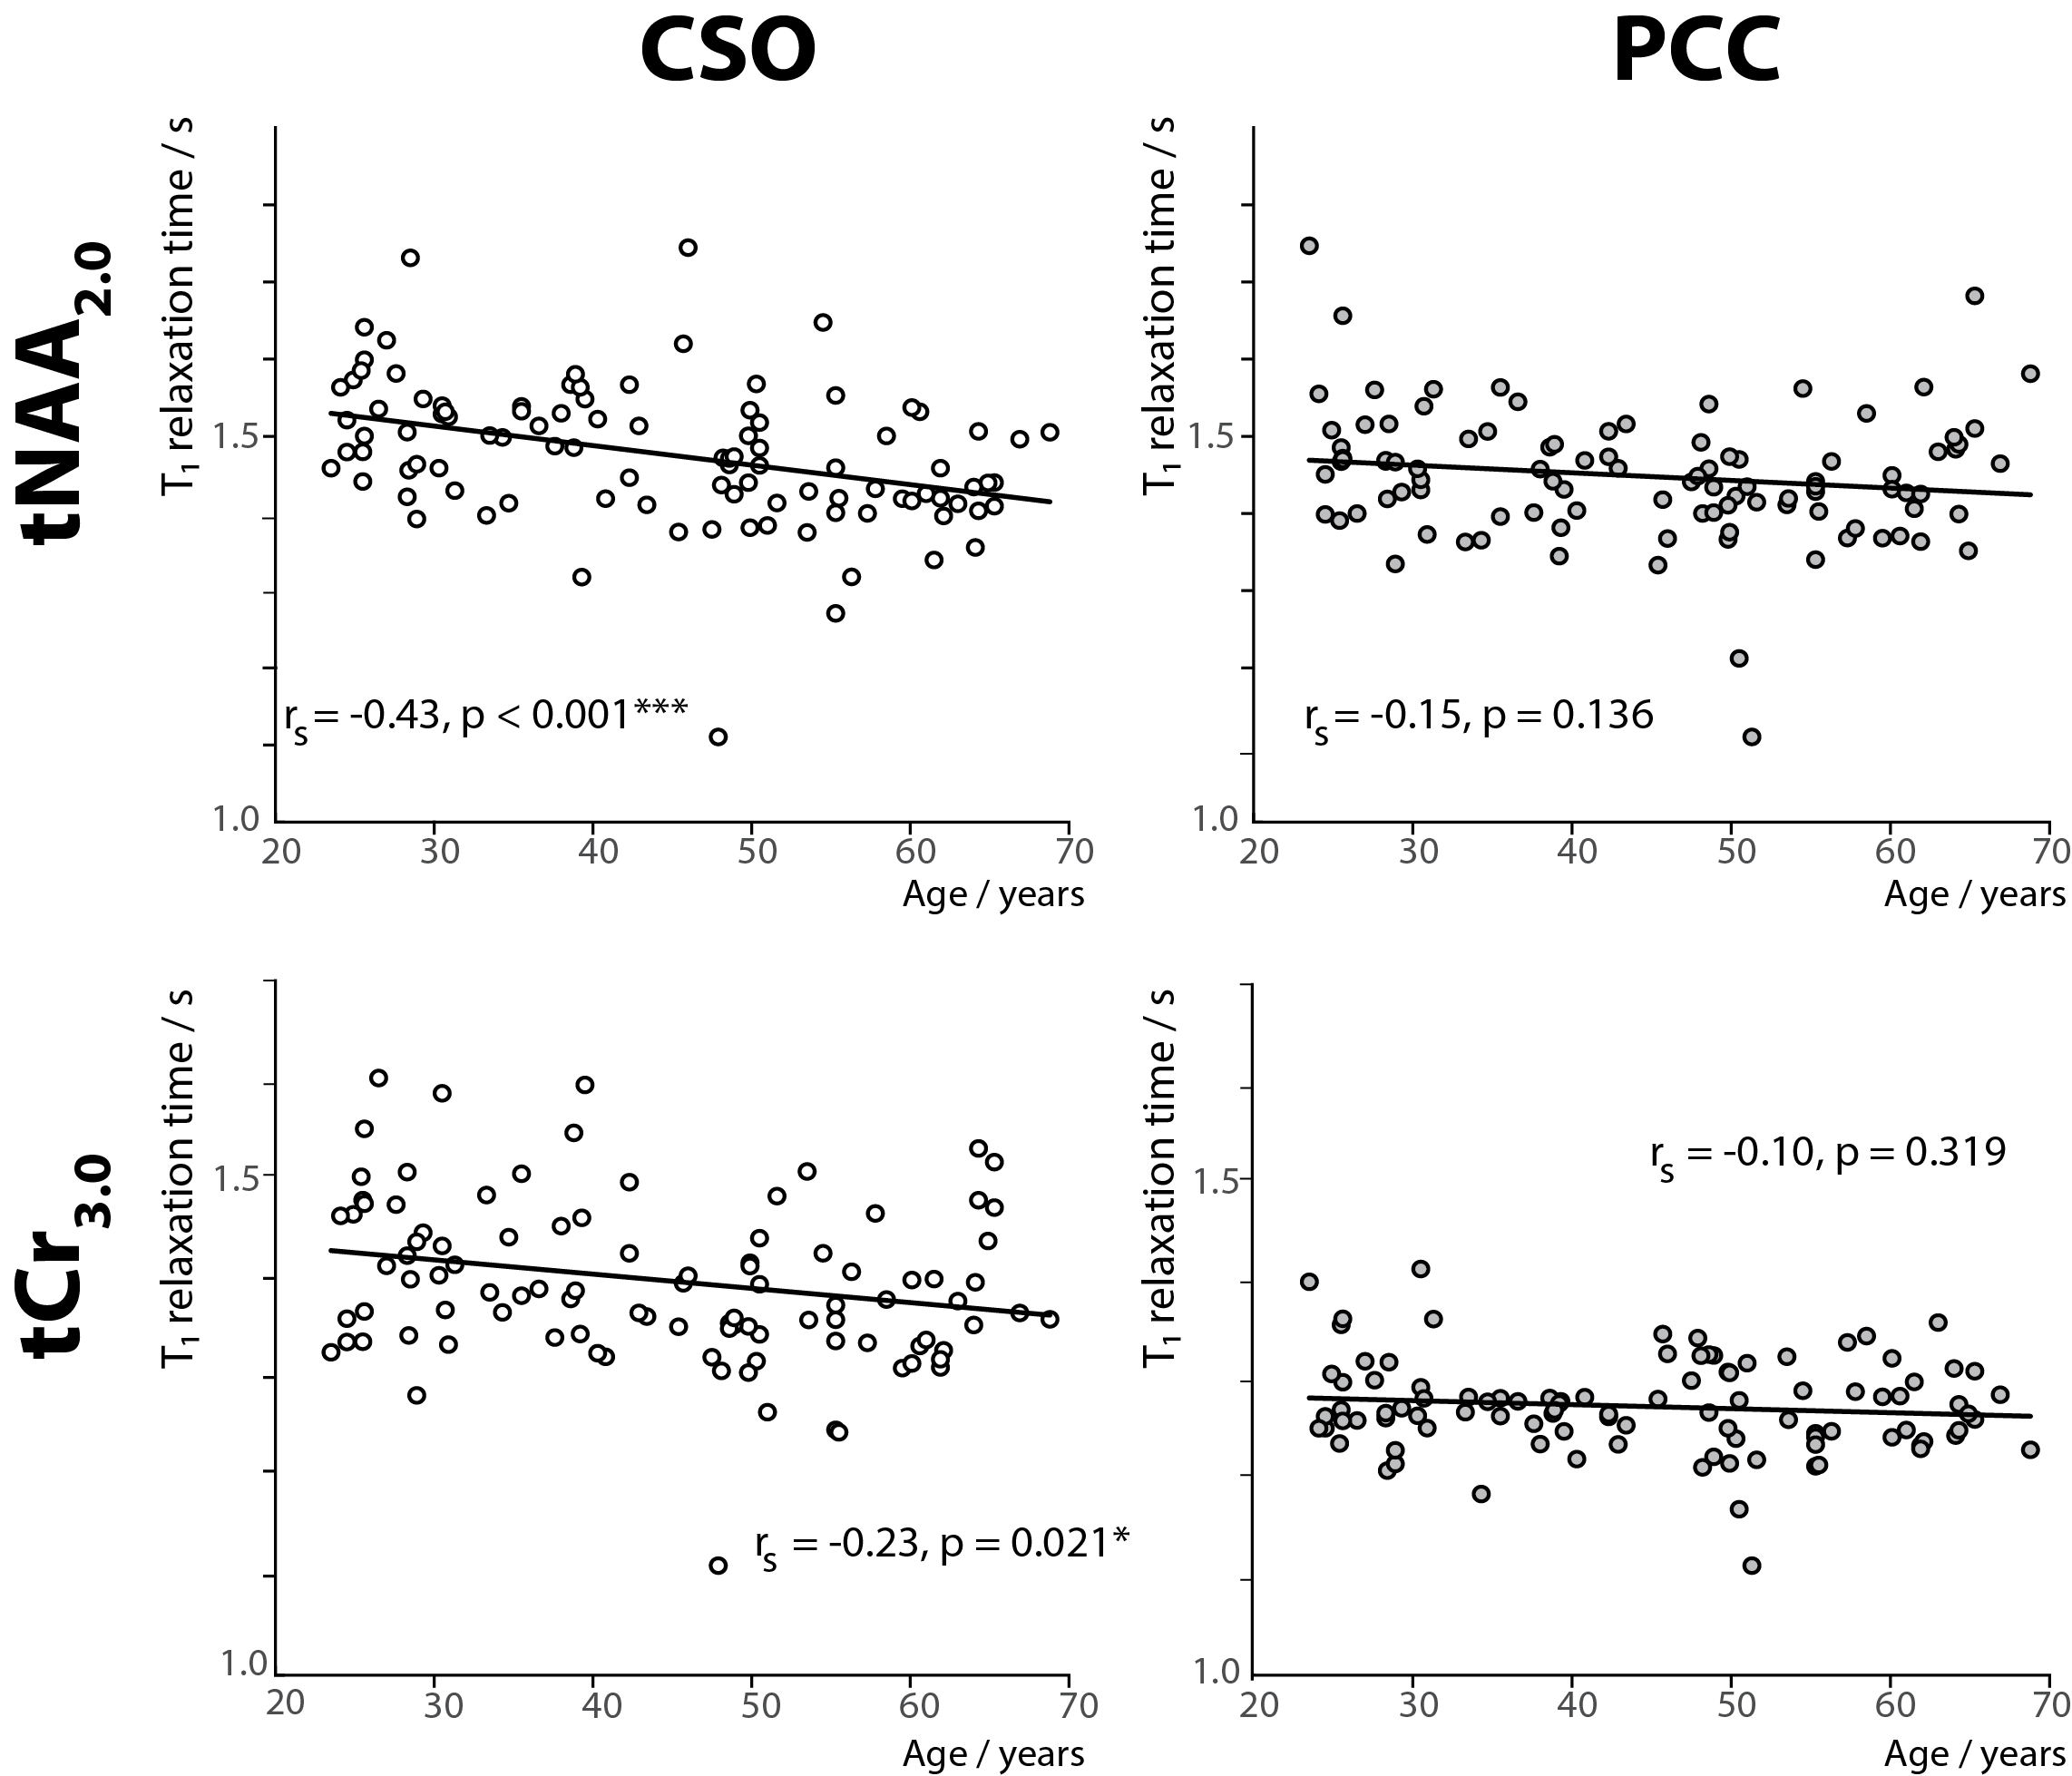
Data were acquired on a 3T Philips MRI scanner from 102 healthy volunteers (49M/53F) with approximately 10M/10F in each decade of life from 20s to 60s. Data were published previously to investigate age-related changes in the macromolecular (MM) spectra12-14 (data available on www.nitrc.org). MRS voxels in CSO and posterior cingulate cortex (PCC) regions were planned on MPRAGE images (TR/TE: 6.9/3.2 ms; FA 8°; 1 mm3 isotropic resolution). Metabolite-nulled MM spectra were acquired using single inversion recovery PRESS localization sequence (TR/TE/TI: 2000/30/600 ms) with Philips CHESS15 water suppression. Metabolite spectra were acquired from the same voxels using PRESS16 (TR/TE: 2000/30 ms) with VAPOR17 water suppression. Water reference spectra were also acquired. Data were processed using Osprey (v2.4.0)18, a MATLAB-based MRS analysis toolbox.Although pre-inversion aims to null metabolite signals to isolate the MM spectrum, such spectra always include residual metabolite signals. Preparation of a ‘clean’ MM spectrum involves modeling these metabolite residuals in order to subtract them out. However, the amplitudes of these modeled residual metabolite signals contain important information – the extent to which signals are imperfectly nulled is determined by their T1 relaxation times. It is therefore possible to make a simple two-point measurement of T1 by comparing the residual metabolite signal amplitude from the MM spectra to the signal amplitude in the metabolite spectra. The ratio of signal amplitudes in these two experiments can be expressed as the ratio of their respective T1 relaxation weightings:$$\frac{S_{met\:residual}}{S_{met}} = \frac{(1 - 2 e^{\frac{-TI}{T_1}} + e^{\frac{-TR}{T_1}})}{(1 - e^{\frac{-TR}{T_1}})}$$This equation was solved to estimate T1 relaxation times of tNAA2.0 and tCr3.0 methyl in CSO and PCC regions (since T1 is the only unknown). These estimated T1 relaxation times were then plotted against age. Spearman correlation coefficients were calculated to test for statistically significant relationships between T1 relaxation times and age for both tNAA2.0 and tCr3.0 in the CSO and PCC regions separately.
Results
Figure 1 shows an in vivo MM spectrum acquired in CSO with TI of 600 ms (with clear residuals for tNAA2.0 and tCr3.0) and the corresponding metabolite spectrum. The modeled residuals are also shown. Plots depicting age against estimated metabolite T1 relaxation times in PCC and CSO are shown in Figure 2. Age correlated negatively with T1s for both tNAA2.0 (rs = -0.43; p < 0.001) and tCr3.0 (rs = -0.23; p = 0.021) in CSO. Age did not correlate with tNAA2.0 or tCr3.0 estimated T1 relaxation times in PCC.Discussion and Conclusion
This analysis harnesses a large publicly available cross-sectional dataset12-14 to test an important hypothesis, that metabolite T1 relaxation times change with age. Our results confirm that T1 relaxation times of tNAA2.0 and tCr3.0 at 3T in CSO reduce with aging. Even though these T1 values result from a relatively simple relaxation model (ignoring e.g. imperfect inversion efficiency), the range of the estimated T1 relaxation times19 and GM-WM T1 trend are consistent with prior work20. T1 values derived from the two-point measurement must be interpreted cautiously, but the robust size of this cohort in comparison to prior work makes this a substantial piece of evidence.It is possible to calculate the impact of ignoring this age-related T1 change from the slopes and intercepts of the trendlines in Figure 2. The T1-weighting term (1 – exp(-TR/T1)) for tNAA2.0 and tCr3.0 changes by 8.2% and 5.0% respectively in CSO, and by 3.4% and 1.6% respectively in PCC, comparing 20 years of age to 70 years of age. This change in T1-weighting would be incorrectly interpreted as a change in metabolite concentration, using current consensus methods. Therefore, this study stresses the importance of further work to measure age-normed metabolite T1 relaxation times for accurate quantitative MRS in studies of aging.
Acknowledgements
This work was supported by NIH grants R01 EB016089, R01 EB023963, R21 AG060245, R00AG062230, K00AG068440, K99 DA051315 and P41 EB031771.References
1. Gasparovic C, Song T, Devier D, et al. Use of tissue water as a concentration reference for proton spectroscopic imaging. Magnetic Resonance in Medicine. 2006;55(6):1219-1226.
2. Near J, Harris AD, Juchem C, et al. Preprocessing, analysis and quantification in single‐voxel magnetic resonance spectroscopy: experts' consensus recommendations. NMR in Biomedicine. 2021;34(5):e4257.
3. Gussew A, Erdtel M, Hiepe P, Rzanny R, Reichenbach JR. Absolute quantitation of brain metabolites with respect to heterogeneous tissue compositions in 1H-MR spectroscopic volumes. Magnetic Resonance Materials in Physics, Biology and Medicine. 2012;25(5):321-333.
4. Christiansen P, Toft P, Larsson H, Stubgaard M, Henriksen O. The concentration of N-acetyl aspartate, creatine+ phosphocreatine, and choline in different parts of the brain in adulthood and senium. Magnetic resonance imaging. 1993;11(6):799-806.
5. Kreis R, Slotboom J, Hofmann L, Boesch C. Integrated data acquisition and processing to determine metabolite contents, relaxation times, and macromolecule baseline in single examinations of individual subjects. Magnetic Resonance in Medicine. 2005;54(4):761-768.
6. Longo R, Anna B, Vidimari R, Silvia M, Adelma G. Absolute Quantitation of Brain 1H Nuclear Magnetic Resonance Spectra. 1995.
7. Brooks JC, Roberts N, Kemp GJ, Gosney MA, Lye M, Whitehouse GH. A proton magnetic resonance spectroscopy study of age-related changes in frontal lobe metabolite concentrations. Cerebral cortex. 2001;11(7):598-605.
8. Kirov II, Fleysher L, Fleysher R, Patil V, Liu S, Gonen O. Age dependence of regional proton metabolites T2 relaxation times in the human brain at 3 T. Magnetic Resonance in Medicine. 2008;60(4):790-795.
9. Marjańska M, Emir UE, Deelchand DK, Terpstra M. Faster metabolite 1H transverse relaxation in the elder human brain. PloS one. 2013;8(10):e77572.
10. Jiru F, Skoch A, Wagnerova D, et al. The age dependence of T2 relaxation times of N‐acetyl aspartate, creatine and choline in the human brain at 3 and 4T. NMR in Biomedicine. 2016;29(3):284-292.
11. Deelchand DK, McCarten JR, Hemmy LS, Auerbach EJ, Eberly LE, Marjańska M. Changes in the intracellular microenvironment in the aging human brain. Neurobiology of aging. 2020;95:168-175.
12. Hui SC, Gong T, Zöllner HJ, et al. The macromolecular MR spectrum does not change with healthy aging. Magnetic resonance in medicine. 2022;87(4):1711-1719.
13. Zöllner HJ, Davies‐Jenkins CW, Murali‐Manohar S, et al. Feasibility and implications of using subject‐specific macromolecular spectra to model short‐TE MRS data. NMR in Biomedicine.e4854.
14. Gong T, Hui SC, Zollner HJ, et al. Neurometabolic timecourse of healthy aging. bioRxiv. 2022.
15. Haase A, Frahm J, Hanicke W, Matthaei D. 1H NMR chemical shift selective (CHESS) imaging. Physics in Medicine & Biology. 1985;30(4):341.
16. Bottomley PA. Selective volume method for performing localized NMR spectroscopy. In: Google Patents; 1984.
17. Tkáč I, Starčuk Z, Choi IY, Gruetter R. In vivo 1H NMR spectroscopy of rat brain at 1 ms echo time. Magnetic Resonance in Medicine. 1999;41(4):649-656.
18. Oeltzschner G, Zöllner HJ, Hui SC, et al. Osprey: Open-source processing, reconstruction & estimation of magnetic resonance spectroscopy data. Journal of neuroscience methods. 2020;343:108827.
19. Mlynárik V, Gruber S, Moser E. Proton T 1 and T 2 relaxation times of human brain metabolites at 3 Tesla. NMR in Biomedicine: An International Journal Devoted to the Development and Application of Magnetic Resonance In Vivo. 2001;14(5):325-331.
20. Ethofer T, Mader I, Seeger U, et al. Comparison of longitudinal metabolite relaxation times in different regions of the human brain at 1.5 and 3 Tesla. Magnetic Resonance in Medicine. 2003;50(6):1296-1301.
Figures