1309
Age-related alterations of hippocampal microstructure quantified using diffusion MRI in a unfolded hippocampal space1Radiology, Athinoula A. Martinos Center for Biomedical Imaging, Massachusetts General Hospital, Charlestown, MA, United States, 2Radiology, Harvard Medical School, Boston, MA, United States
Synopsis
Keywords: Neurodegeneration, Microstructure
The hippocampus plays an important role in cognition and memory. Microstructural alterations can happen in specific sub-regions within the hippocampus in normal aging. Applying more advanced diffusion models and pinpointing changes in specific locations in the hippocampus, though challenging, may offer greater insight into subfield-specific neurodegeneration. Here, we applied advanced biophysical models of dMRI and correlated tissue parameters with age across the unfolded hippocampal coordinates in 43 healthy adults covering a wide age span.Introduction
The hippocampus plays an important role in cognition and memory. Microstructural alterations can happen in specific sub-regions within the hippocampus in normal aging. Age-related microstructural alterations in the hippocampus have been investigated in previous studies using diffusion MRI (dMRI), mainly focusing on mean diffusivity (MD) and fractional anisotropy (FA) averaged over the entire hippocampus or subfield volume1-2. Applying more advanced diffusion models and pinpointing changes in specific locations in the hippocampus, though challenging, may offer greater insight into subfield-specific neurodegeneration. Here, we applied advanced biophysical models of dMRI and correlated tissue parameters with age across the unfolded hippocampal coordinates3 in 43 healthy adults covering a wide age span.Methods
In vivo MRI: 43 healthy subjects (age span: 22 to 72-year-old) were scanned on a 3T Connectom MRI scanner (maximal gradient=300 mT/m, slew rate=200 T/m/s) and a custom-built 64-channel head coil4. For each subject, diffusion MRI data using monopolar pulsed-gradient spin-echo sequence were acquired at two diffusion times (D=19, 49 ms) with a fixed pulse duration d=8 ms. Other parameters are as follows: TE/TR=77/4000 ms, 2 mm isotropic voxel size, DWIs of 8 b-values=50-6000 s/mm2 for D=19 ms, and DWIs of 8 b-values=200-17800 s/mm2 for D=49 ms. The b=0 images were acquired every 16 DWIs. 32 gradient directions were sampled for b-values<2300 s/mm2, and 64 directions otherwise. The scan time of diffusion MRI protocol is 55 min. To segment and unfold the hippocampus, T1-weighted anatomical images were acquired using 3D MEMPRAGE.Model fitting: After preprocessing DWIs, we fitted biophysical models to diffusion signals, such as DKI5, WMTI6, NODDI7, and SANDI8, AxCaliber-SMT9, where the parametric maps were co-registered to the T1-weighted anatomical image domain using linear interpolation. Parameters of each model are as follows:·
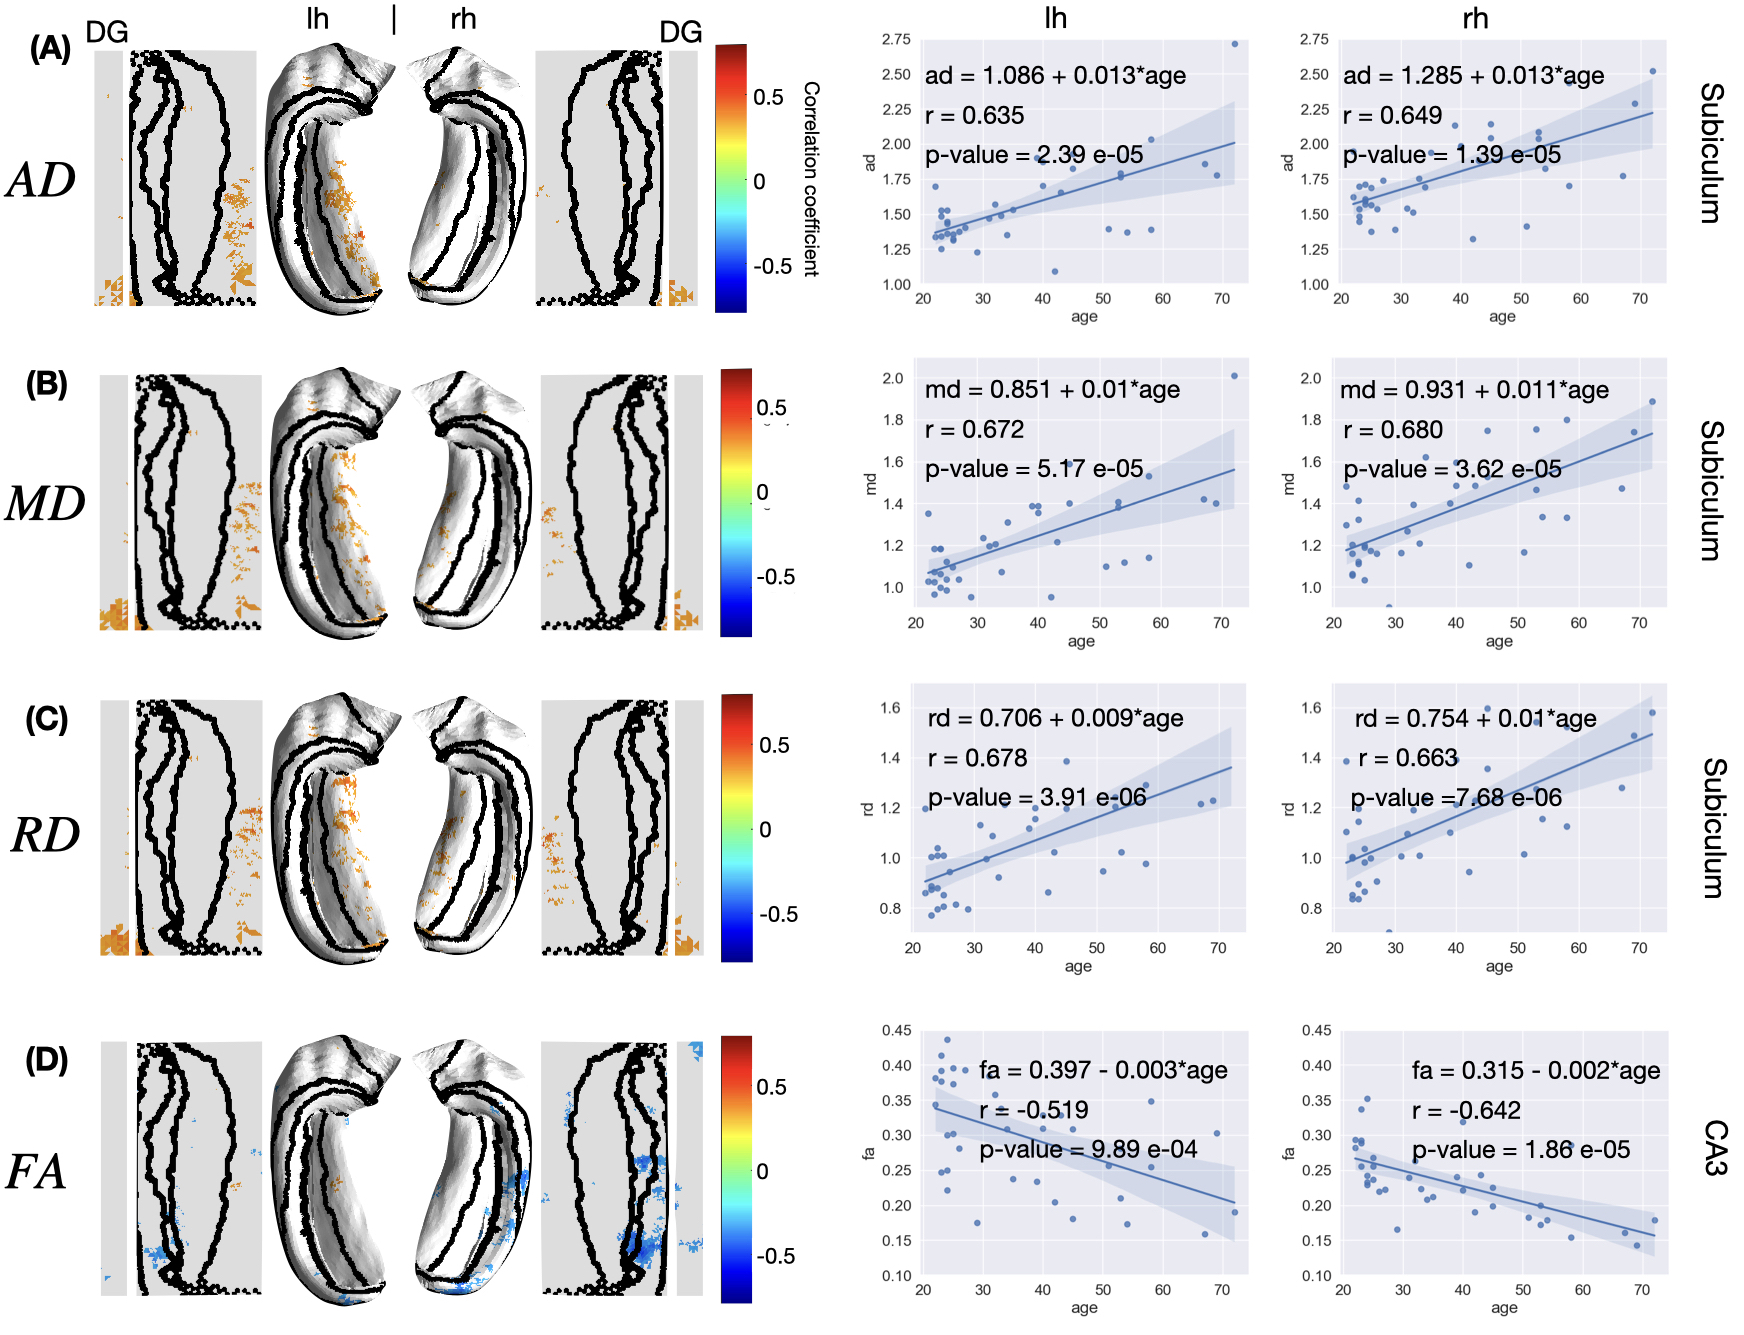
- DKI: mean/axial/radial diffusivity (MD/AD/RD), FA, mean/axial/radial kurtosis (MK/AK/RK)·
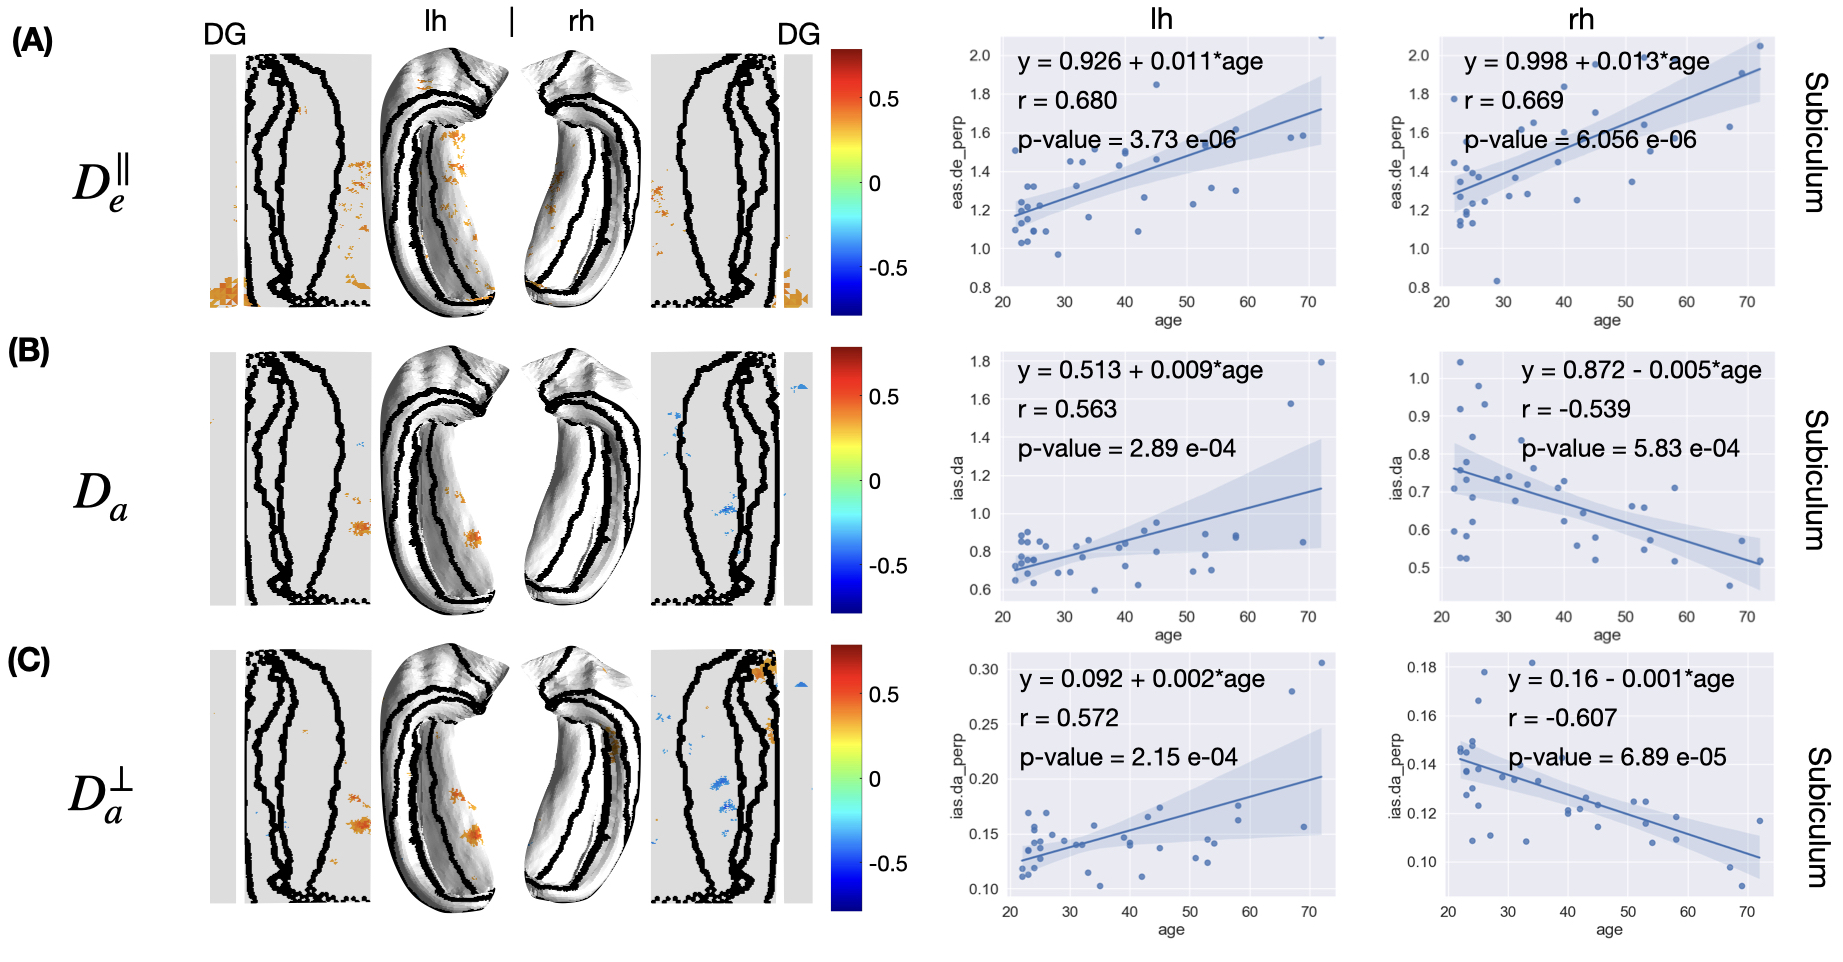
- WMTI: axonal water fraction (AWF), intra-cellular diffusivity ($$$D_a$$$), extra-cellular axial/radial diffusivity ($$$D_e^\parallel$$$, $$$D_e^\perp$$$), extra-cellular space tortuosity ($$$alpha$$$)·
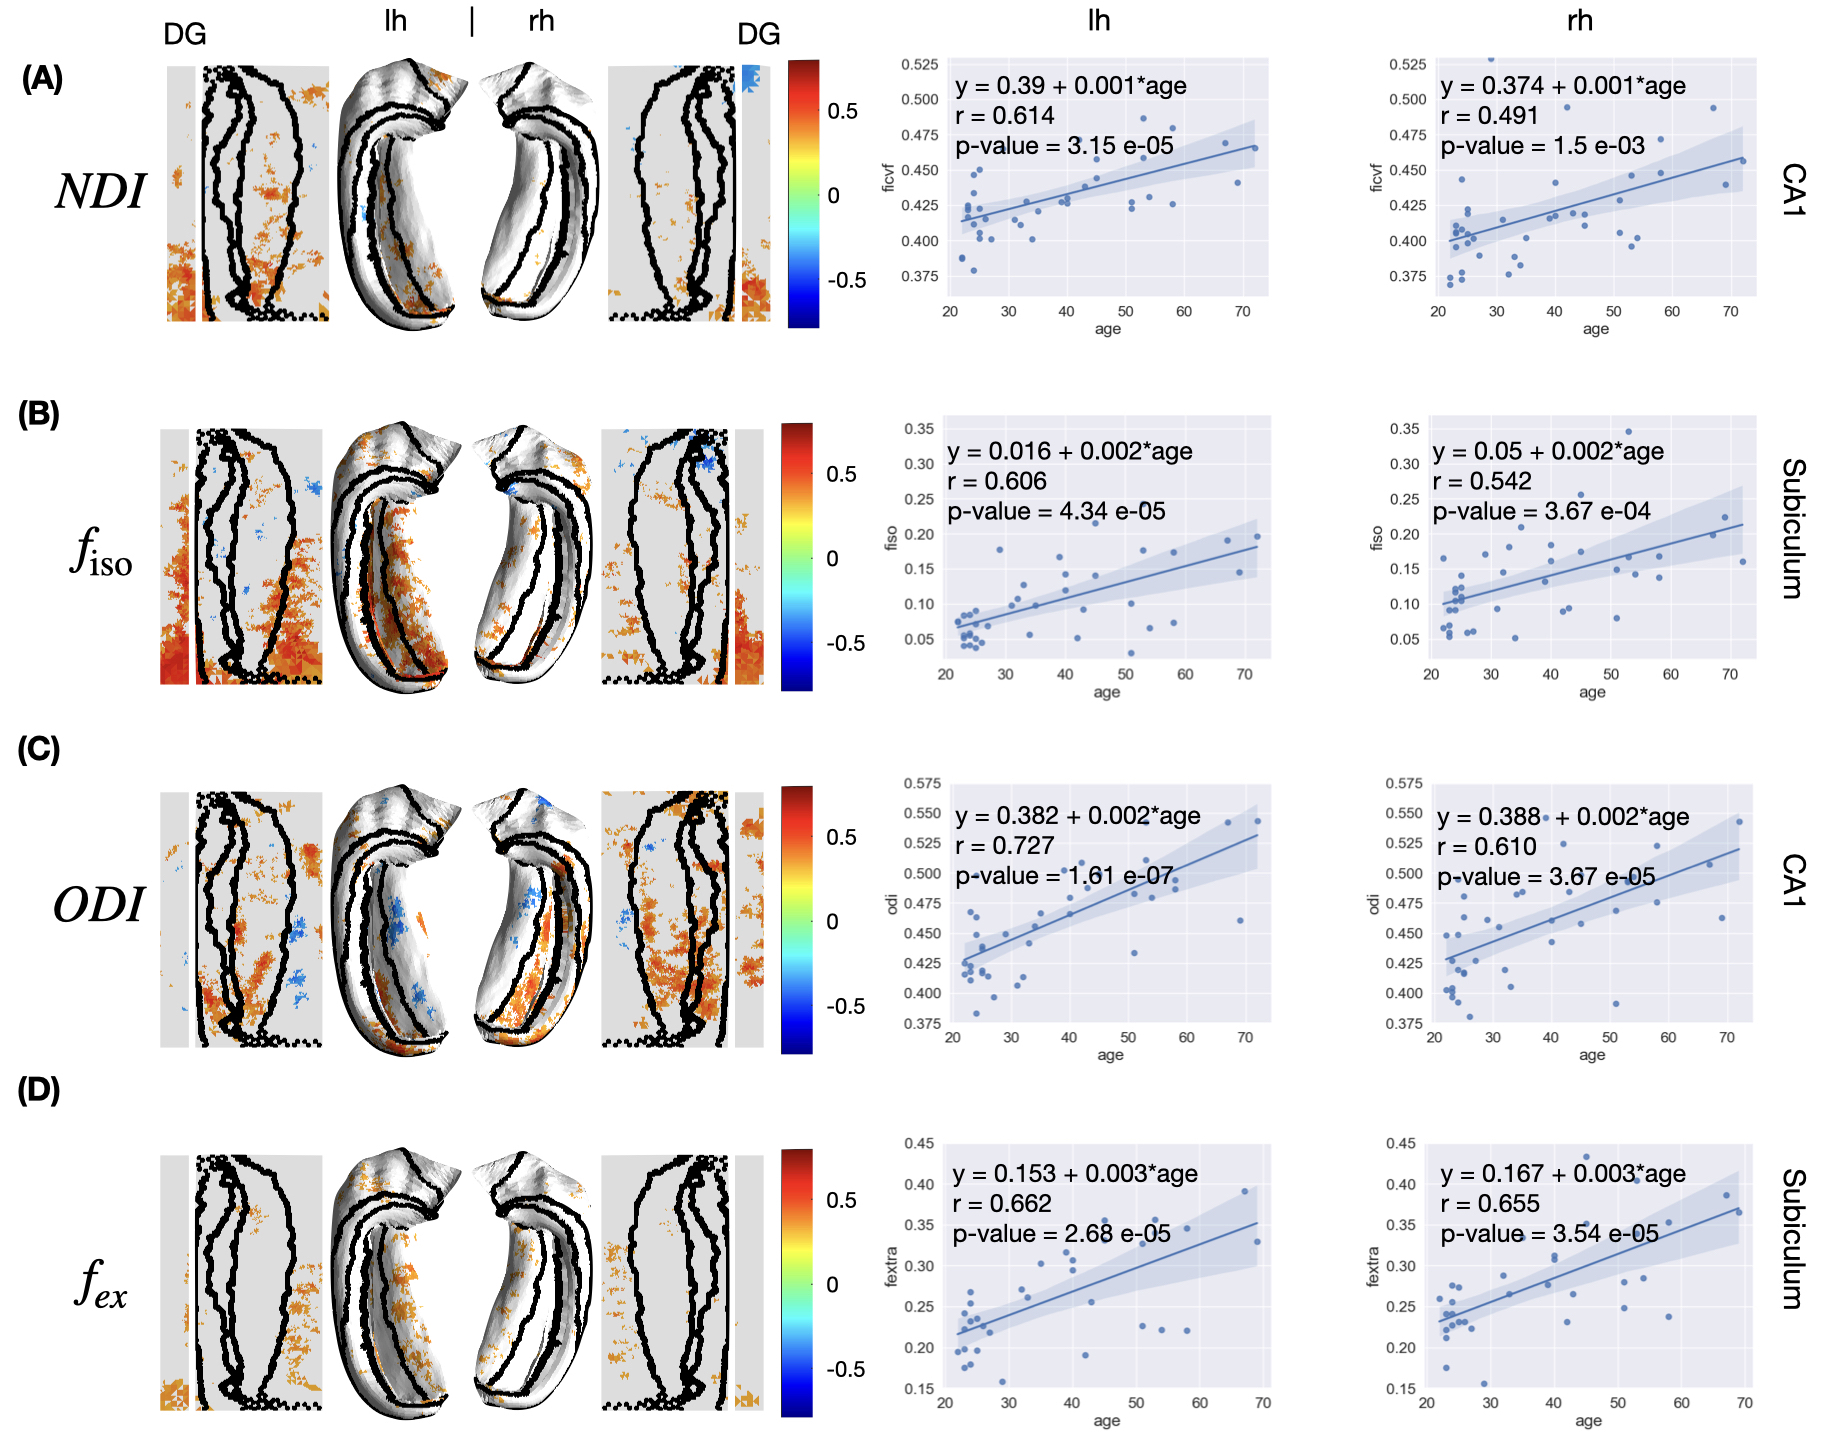
- NODDI: neurite density index (NDI), free water fraction ($$$f_{\rm iso}$$$), orientation dispersion index (ODI)·
- SANDI: neurite fraction ($$$f_{in}$$$), soma fraction ($$$f_s$$$), extra-cellular fraction ($$$f_{ex}$$$), intra-cellular diffusivity ($$$D_a$$$), extra-cellular diffusivity ($$$D_e$$$), soma radius ($$$r_s$$$)·
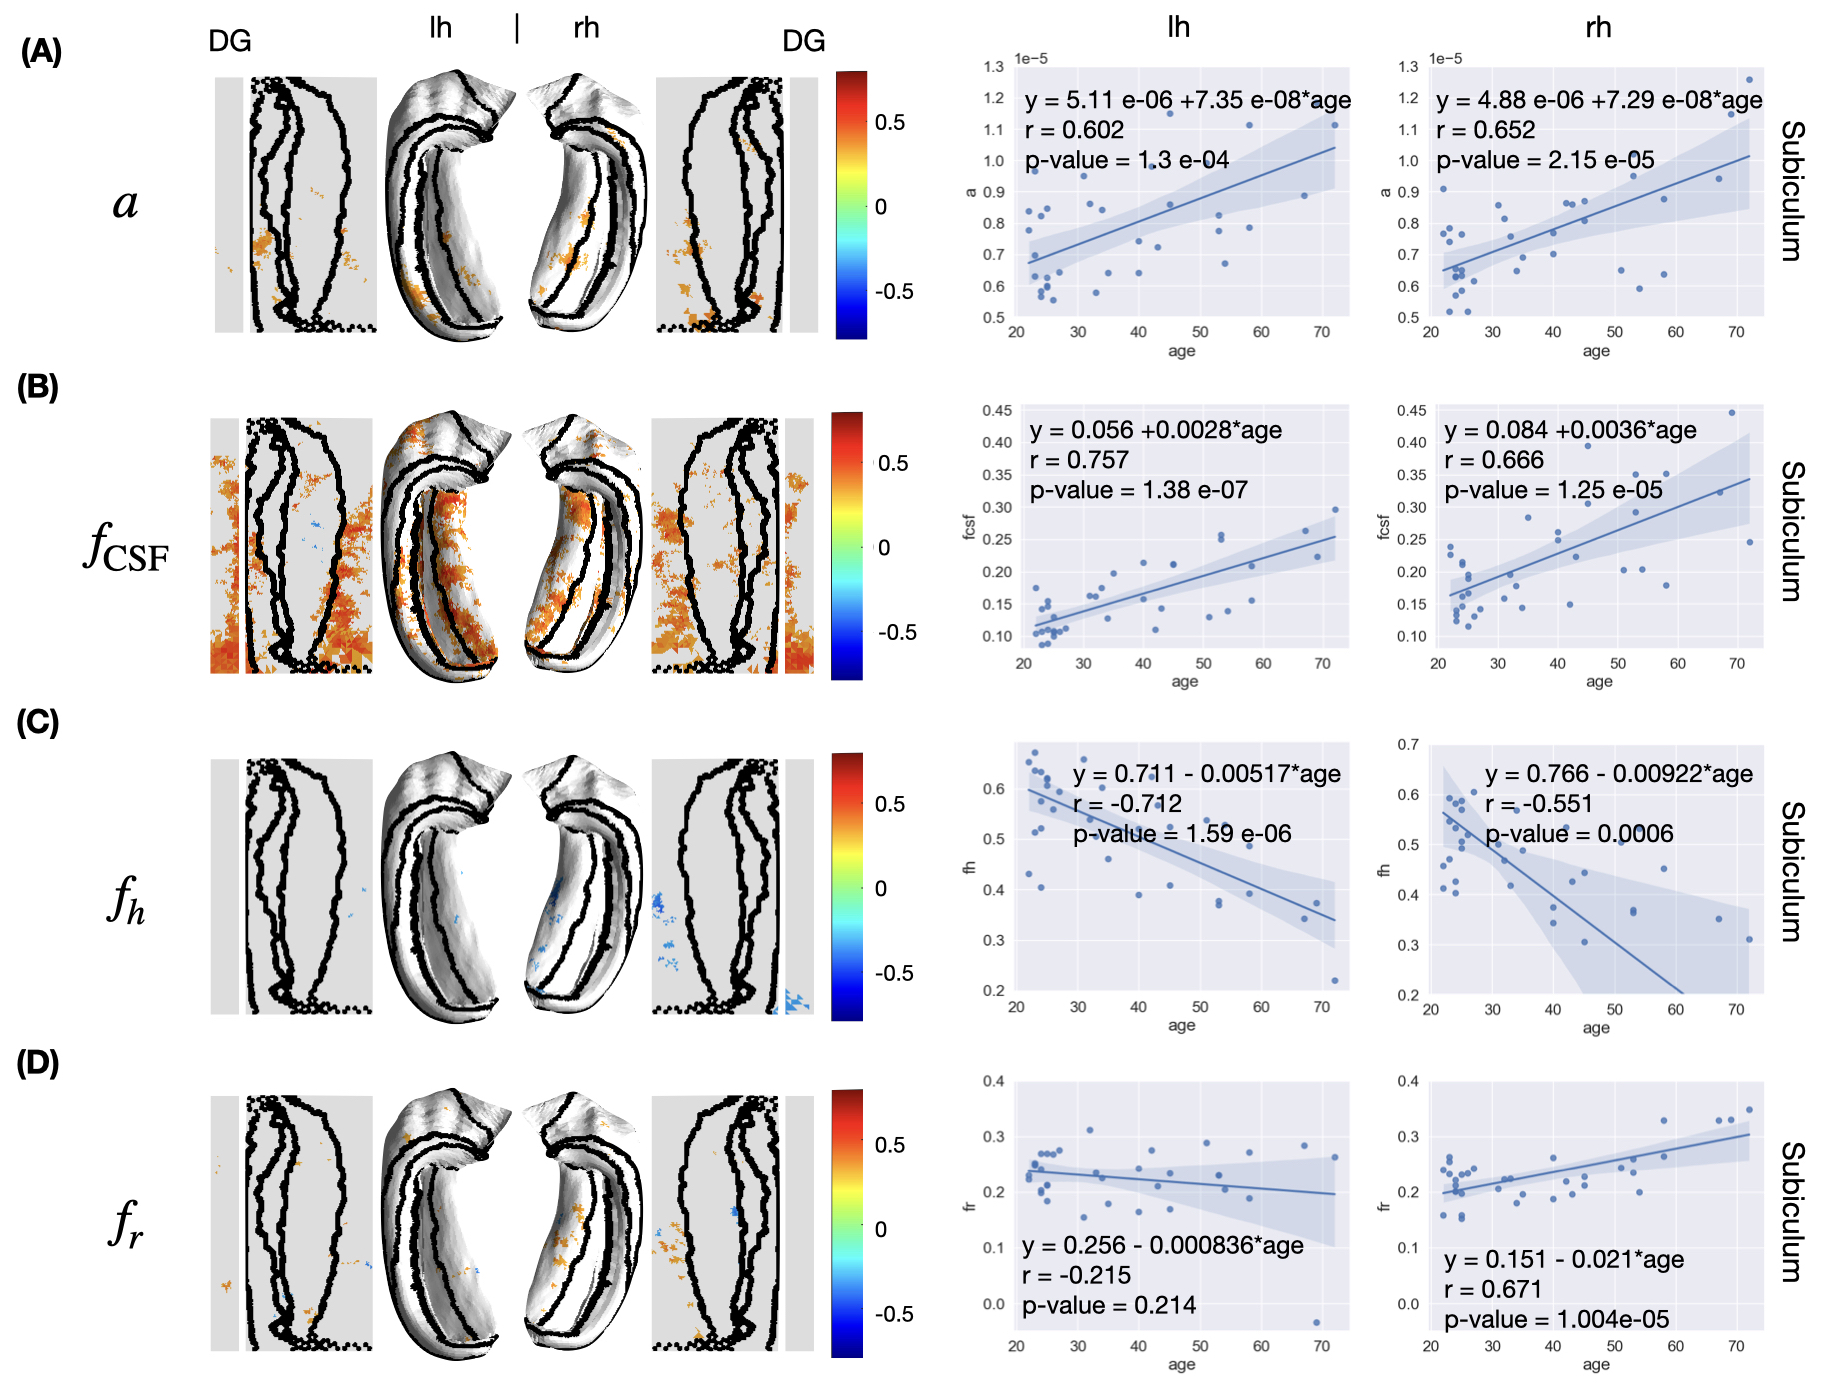
- AxCaliber-SMT: axon diameter ($$$a$$$), restricted fraction ($$$f_r$$$), hindered fraction ($$$f_h$$$), CSF fraction ($$$f_{\rm CSF}$$$), perpendicular hindered diffusivity ($$$D_h$$$)
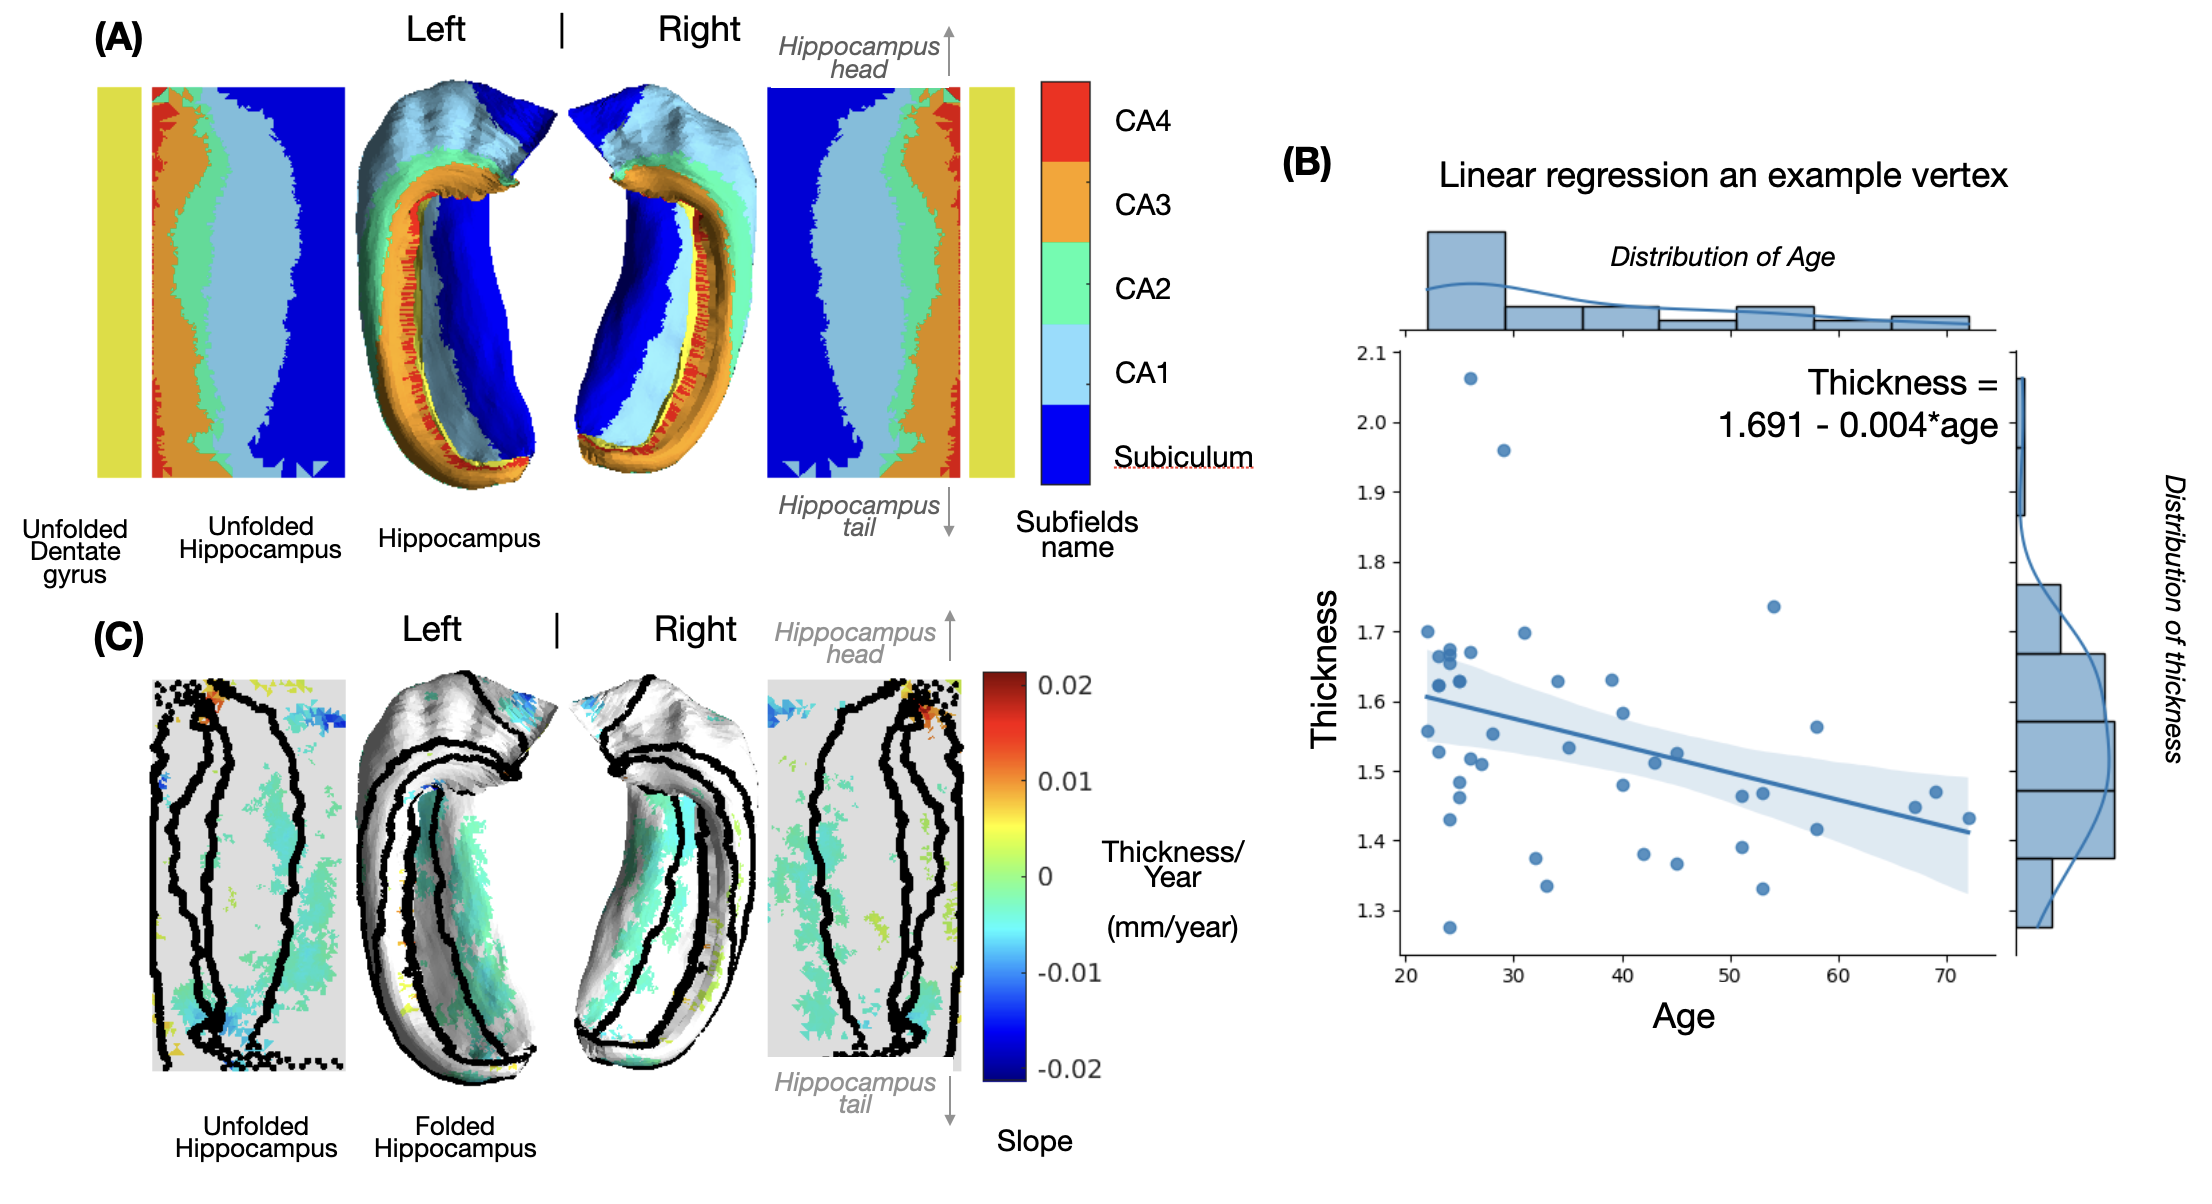
Age-related alterations: Linear regression was applied to evaluate the age-related alterations of the thickness and diffusion metrics at each vertex. The estimated slope (value change per year), Pearson correlation coefficient $$$R$$$, and corresponding p-value were calculated. The $$$R$$$ values were displayed in the original and unfolded hippocampal spaces to demonstrate correlations of diffusion metrics and aging. We only showed $$$R$$$ values at vertices with p-value < 0.05, i.e., at a 95% confidence level, we reject the null hypothesis that the metric does not correlate with age.
Results
In the unfolded hippocampal space (Fig.1), we observed decreases in thickness with age in the subiculum, CA2, tail of CA3, and fimbria. For DKI (Fig.2), we observed diffusivities (MD, AD, RD) increase with age in the subiculum and dentate gyrus, FA decrease with age in CA3-4, and MK, AK, and RK show no significant change across the unfolded hippocampal surface. For WMTI (Fig.3), we observed the increase of extra-cellular radial diffusivity in the subiculum and dentate gyrus. For NODDI (Fig.4), we observed the increase of NDI, free water fraction, and NDI with age in the hippocampus and dentate gyrus. for SANDI (Fig.4), we only observed the increase of extra-cellular fraction. Finally, for AxCaliber-SMT (Fig.5), we observed axon diameter increase with age in the subiculum and CA4, and CSF fraction increase with age in hippocampus and dentate gyrus. Other parameters with insignificant age-related alterations were not reported here.Discussion and Conclusions
The hippocampal subfields showing diffusivity increase (DKI, WMTI) and FA decrease (DKI) with age coincide with regions of age-related decline in thickness. The findings of changes in hippocampal diffusivity and FA with age are consistent with the previous studies1. In addition, the increase of CSF fraction with age was reliably observed in both NODDI and AxCaliber-SMT. Furthermore, we observed the increase of estimated axon size (AxCaliber-SMT) with age. However, the estimated soma size and soma fraction (SANDI) showed no significant correlations with age. The visualization pipeline of tissue parameters on an unfolded hippocampal space reveals an overlap of age-related microstructural alterations and hippocampal thinning, especially in the subiculum and CA4, offering a promising clinically deployable pipeline to evaluate the neuronal integrity for early diagnosis and monitoring treatment response of neurodegenerative diseases.Acknowledgements
This work was supported by NIH under the award number: DP5OD031854, R01NS118187, P41EB015896, P41EB030006, U01EB026996, S10RR023401, S10RR019307, S10RR023043, K99AG073506.References
[1] Pereira, Joana B., et al. "Regional vulnerability of hippocampal subfields to aging measured by structural and diffusion MRI." Hippocampus 24.4 (2014): 403-414.
[2] Wang, Dan, et al. "Examination of hippocampal differences between Alzheimer disease, amnestic mild cognitive impairment and normal aging: diffusion kurtosis." Current Alzheimer Research 12.1 (2015): 80-87.
[3] DeKraker, Jordan, et al. "HippUnfold: Automated hippocampal unfolding, morphometry, and subfield segmentation." bioRxiv (2021).
[4] Tian, Qiyuan, et al. "Comprehensive diffusion MRI dataset for in vivo human brain microstructure mapping using 300 mT/m gradients." Scientific Data 9.1 (2022): 1-11.
[5] Jensen, J. H., Helpern, J. A., Ramani, A., Lu, H., & Kaczynski, K. (2005). Diffusional kurtosis imaging: the quantification of non‐gaussian water diffusion by means of magnetic resonance imaging. Magnetic Resonance in Medicine: An Official Journal of the International Society for Magnetic Resonance in Medicine, 53(6), 1432-1440.
[6] Fieremans, E., Jensen, J. H., & Helpern, J. A. (2011). White matter characterization with diffusional kurtosis imaging. Neuroimage, 58(1), 177-188.
[7] Zhang, Hui, et al. "NODDI: practical in vivo neurite orientation dispersion and density imaging of the human brain." Neuroimage 61.4 (2012): 1000-1016.
[8] Palombo, Marco, et al. "SANDI: a compartment-based model for non-invasive apparent soma and neurite imaging by diffusion MRI." Neuroimage 215 (2020): 116835.
[9] Fan, Qiuyun, et al. "Axon diameter index estimation independent of fiber orientation distribution using high-gradient diffusion MRI." Neuroimage 222 (2020): 117197.
Figures