1308
Differences in age trajectories of intracortical myelin across lifespan measured by MTR and T1w/T2w
Yu Veronica Sui1, Ryn Flaherty1, Arjun V. Masurkar2,3,4, Thomas Wisniewski2,4,5,6, Henry Rusinek1,5, and Mariana Lazar1
1Department of Radiology, New York University Grossman School of Medicine, New York, NY, United States, 2Department of Neurology, New York University Grossman School of Medicine, New York, NY, United States, 3Department of Neuroscience and Physiology, New York University Grossman School of Medicine, New York, NY, United States, 4Neuroscience Institute, New York University Grossman School of Medicine, New York, NY, United States, 5Department of Psychiatry, New York University Grossman School of Medicine, New York, NY, United States, 6Department of Pathology, New York University Grossman School of Medicine, New York, NY, United States
1Department of Radiology, New York University Grossman School of Medicine, New York, NY, United States, 2Department of Neurology, New York University Grossman School of Medicine, New York, NY, United States, 3Department of Neuroscience and Physiology, New York University Grossman School of Medicine, New York, NY, United States, 4Neuroscience Institute, New York University Grossman School of Medicine, New York, NY, United States, 5Department of Psychiatry, New York University Grossman School of Medicine, New York, NY, United States, 6Department of Pathology, New York University Grossman School of Medicine, New York, NY, United States
Synopsis
Keywords: Neurodegeneration, Aging
In a large cohort of healthy participants (N=349, age range 18-90 years), we characterized intracortical myelin lifespan trajectories using two commonly used myelin proxies, magnetization transfer ratio (MTR) and T1w/T2w, combined with a surface-based image processing method. We showed that both measures exhibit an inverted-U shape trajectory for most cortical regions, with T1w/T2w values peaking later than MTR. A smoothed spline fitting of the trajectories allowed further delineation of onset decline age, a potential aging milestone. Frontal and temporal lobe regions showed consistently later peak ages than parietal and sensory motor regions across MRI metrics and curve fitting methods.Purpose
Myelination in the human brain has been shown to follow an inverted-U shape trajectory across the lifespan [1-3]. Intracortical myelin, which associates with higher order functions, has a more protracted development and substantial regional variations [4]. With the advances in in vivo myelin mapping using MRI, intracortical myelination during development and aging can be better understood by studies spanning sufficient age ranges [5] and utilizing multiple imaging methods [6]. The complexity of the cortex also calls for novel image processing techniques: distinct cytoarchitectural layers may differ in iron content [7] and presence of crossing myelinated fibers [8]. These variations may bias traditional MRI volumetric intracortical myelin approximation methods.To address current gaps, we aimed to characterize and compare trajectories of intracortical myelin from 18 to 90 years of age using magnetization transfer ratio (MTR) [9] and T1w/T2w [10] combined with a surface-based image processing method. We hypothesized that both measures would show inverted-U shape trajectories but with specific curve features given that each of these measures may be influenced by factors other than myelin.
Methods
We utilized data from healthy participants (ages 18.5-88.9) collected by the Cambridge Centre for Ageing and Neuroscience (Cam-CAN) project. The recruitment and MRI acquisition has been thoroughly described in previous papers [11, 12].Here, we used Cam-CAN high resolution T1w, T2w, and magnetization transfer (MT) images. The T1w and T2w structural images were acquired with 1mm isotropic voxels. Other main acquisition parameters included TR=2250ms, TE=2.99ms, TI=900ms, FA=9º for T1w MPRAGE, and TR=2800ms, TE=408ms for T2w SPACE. MT images were acquired using prepared SPGR sequences with TR=30ms, TE=5ms, FA=12º, and 1.5x1.5x1.6mm3 voxels. Off resonance saturation was achieved by applying a Gaussian pulse with FA=500º, pulse duration=9.984ms, and offset frequency=1950Hz.
We processed the structural images using the Human Connectome Project (HCP) preprocessing pipeline [13], which includes bias correction, surface reconstruction, and T1w/T2w calculation. The MT images were corrected for Gibbs ringing before being registered to the structural space [14, 15]. MTR maps were calculated as (M0-Ms)/M0, where Ms and M0 are signal intensities with and without saturation pulse. After image quality control, 349 participants were included in the analysis (Figure 1).
For intracortical myelin estimation, we used MTR and T1w/T2w value at 70% cortical thickness depth to minimize partial volume averaging from non-grey matter tissue [5]. FreeSurfer tools [16] were employed to expand surfaces (Figure 1B) and extract mean values from each region of interest (ROI) based on the HCP multimodal parcellation [17].
To characterize intracortical myelin trajectory, we first tested quadratic age effects with sex and linear age included as covariates in the regression. Multiple comparisons were corrected using the Benjamini-Hochberg method. For regions showing a significant quadratic age effect, we used a smoothing spline fitting (Matlab csaps) to further identify curve features. Derivatives were calculated for fitting curves to locate ages of peak myelination for quadratic fitting and onset age of decline for spline fitting (last peak in curve). All analyses were performed in Matlab.
Results
Intracortical myelin estimated by MTR and T1w/T2w showed similar distribution pattern across regions, with primary areas such as the sensory motor region showing higher values compared to association areas (Figure 2A-2B). While differences were observed in the occipital lobe regions, significant correlations were found between measures both across regions and across subjects (Figure 2C-2D).Inverted-U shape trajectories were observed in extended areas (Figure 3A-3B). Peak ages of the quadratic curve from the two measures showed a significant correlation. However, MTR values generally peaked much earlier than the T1w/T2w ratio (Figure 3C-3D).
Spline fitting of the trajectories revealed unique curve features. For MTR particularly, a relatively flat myelination period appeared during middle age (Figure 4) and the onset age of decline was delayed compared to the previously identified peak for many regions (Figure 5A). For T1w/T2w, more regions were shown to peak before the maximum age of 88.9, but the onset decline age was largely comparable to quadratic peak age (Figure 5B).
Discussion
Both MTR and T1w/T2w, although limited by their qualitative nature, were able to capture meaningful intracortical myelin trajectory features across the lifespan. Consistent with previous findings, we observed an inverted-U shape trajectory of intracortical myelination for most of the cerebral cortex. While the regional peak ages were correlated between measures, T1w/T2w increases were found to be more protracted than MTR. This may reflect potential contributions to T1w/T2w from iron content, which naturally occurs in the brain and accumulates throughout life [18].Frontal and temporal lobe regions showed consistently later peak ages compared with parietal and sensory motor regions. Differences in relative peak age between measures were observed in occipital and insular areas and may potentially reflect bias fields that persisted after taking the ratio of images to calculate MTR and T1w/T2w.
Using a spline fitting, more features of the myelination trajectory were identified for both measures. The wide age range, especially on the aging side, allowed us to distinguish an onset decline age in a larger number of regions than previously reported [5]. Overall, T1w/T2w appeared to be more accurate in relative myelin distribution across regions while MTR showed trajectories that are more in line with existing literature.
Acknowledgements
This study was supported in part by a Developmental Project Grant awarded by the NYU Langone Alzheimer’s Disease Research Center supported by the National Institute on Aging (NIA) grants P30AG066512. Data used here was provided by the Cambridge Centre for Ageing and Neuroscience (Cam-CAN). Cam-CAN funding was supported by the UK Biotechnology and Biological Sciences Research Council (grant number BB/H008217/1), together with support from the UK Medical Research Council and University of Cambridge, UK.References
1. Bartzokis, G., et al., Differential effects of typical and atypical antipsychotics on brain myelination in schizophrenia. Schizophr Res, 2007. 93(1-3): p. 13-22.
2. Arshad, M., J.A. Stanley, and N. Raz, Adult age differences in subcortical myelin content are consistent with protracted myelination and unrelated to diffusion tensor imaging indices. Neuroimage, 2016. 143: p. 26-39.
3. Grydeland, H., et al., Intracortical myelin links with performance variability across the human lifespan: results from T1- and T2-weighted MRI myelin mapping and diffusion tensor imaging. J Neurosci, 2013. 33(47): p. 18618-30.
4. Paquola, C. and S.-J. Hong, The potential of myelin-sensitive imaging: Redefining spatiotemporal patterns of myeloarchitecture. Biological Psychiatry, 2022.
5. Grydeland, H., et al., Waves of Maturation and Senescence in Micro-structural MRI Markers of Human Cortical Myelination over the Lifespan. Cereb Cortex, 2019. 29(3): p. 1369-1381.
6. Shams, Z., D.G. Norris, and J.P. Marques, A comparison of in vivo MRI based cortical myelin mapping using T1w/T2w and R1 mapping at 3T. PLoS One, 2019. 14(7): p. e0218089.
7. Fukunaga, M., et al., Layer-specific variation of iron content in cerebral cortex as a source of MRI contrast. Proc Natl Acad Sci U S A, 2010. 107(8): p. 3834-9.
8. Nieuwenhuys, R., The myeloarchitectonic studies on the human cerebral cortex of the Vogt-Vogt school, and their significance for the interpretation of functional neuroimaging data. Brain Struct Funct, 2013. 218(2): p. 303-52.
9. Henkelman, R., G. Stanisz, and S. Graham, Magnetization transfer in MRI: a review. NMR in Biomedicine, 2001. 14(2): p. 57-64.
10. Glasser, M.F. and D.C. Van Essen, Mapping human cortical areas in vivo based on myelin content as revealed by T1- and T2-weighted MRI. J Neurosci, 2011. 31(32): p. 11597-616.
11. Shafto, M.A., et al., The Cambridge Centre for Ageing and Neuroscience (Cam-CAN) study protocol: a cross-sectional, lifespan, multidisciplinary examination of healthy cognitive ageing. BMC Neurol, 2014. 14: p. 204.
12. Taylor, J.R., et al., The Cambridge Centre for Ageing and Neuroscience (Cam-CAN) data repository: Structural and functional MRI, MEG, and cognitive data from a cross-sectional adult lifespan sample. Neuroimage, 2017. 144(Pt B): p. 262-269.
13. Glasser, M.F., et al., The minimal preprocessing pipelines for the Human Connectome Project. Neuroimage, 2013. 80: p. 105-24.
14. Kellner, E., et al., Gibbs-ringing artifact removal based on local subvoxel-shifts. Magn Reson Med, 2016. 76(5): p. 1574-1581.
15. Jenkinson, M., et al., Fsl. Neuroimage, 2012. 62(2): p. 782-90.
16. Fischl, B., FreeSurfer. Neuroimage, 2012. 62(2): p. 774-81.
17. Glasser, M.F., et al., A multi-modal parcellation of human cerebral cortex. Nature, 2016. 536(7615): p. 171-178.
18. Moller, H.E., et al., Iron, Myelin, and the Brain: Neuroimaging Meets Neurobiology. Trends Neurosci, 2019. 42(6): p. 384-401.
Figures
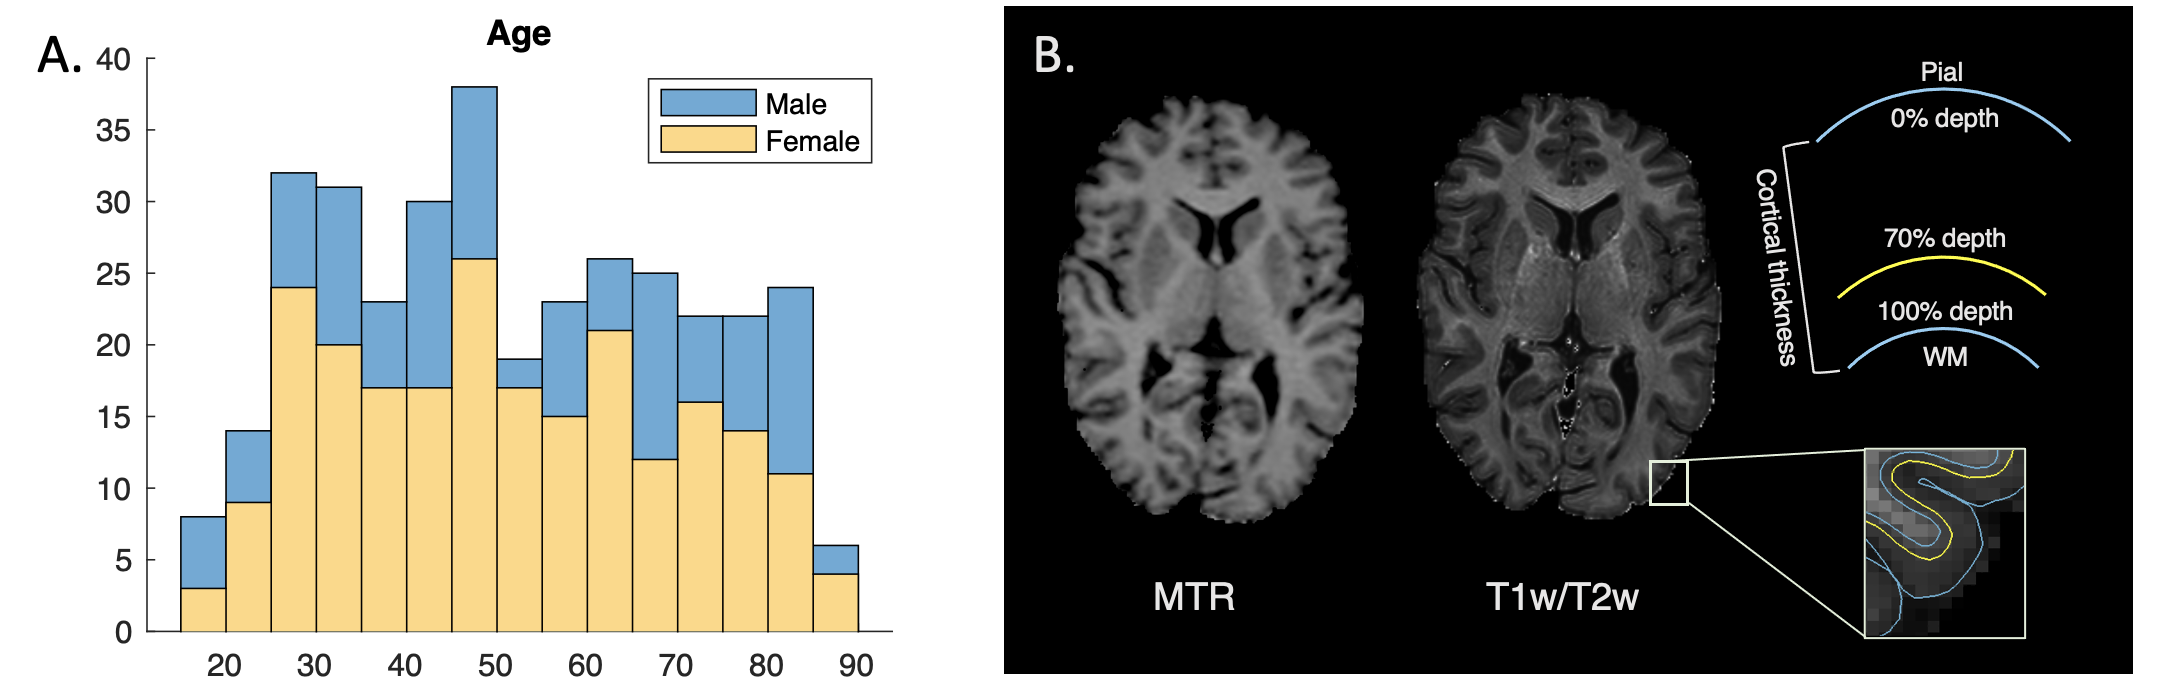
Figure 1. A. Age distribution of Cam-CAN participants included in the current study; B. Example MTR and T1w/T2w ratio image in axial view. A schematic graph of 70% depth surface in relation to the pial and white matter (WM) surface is shown.
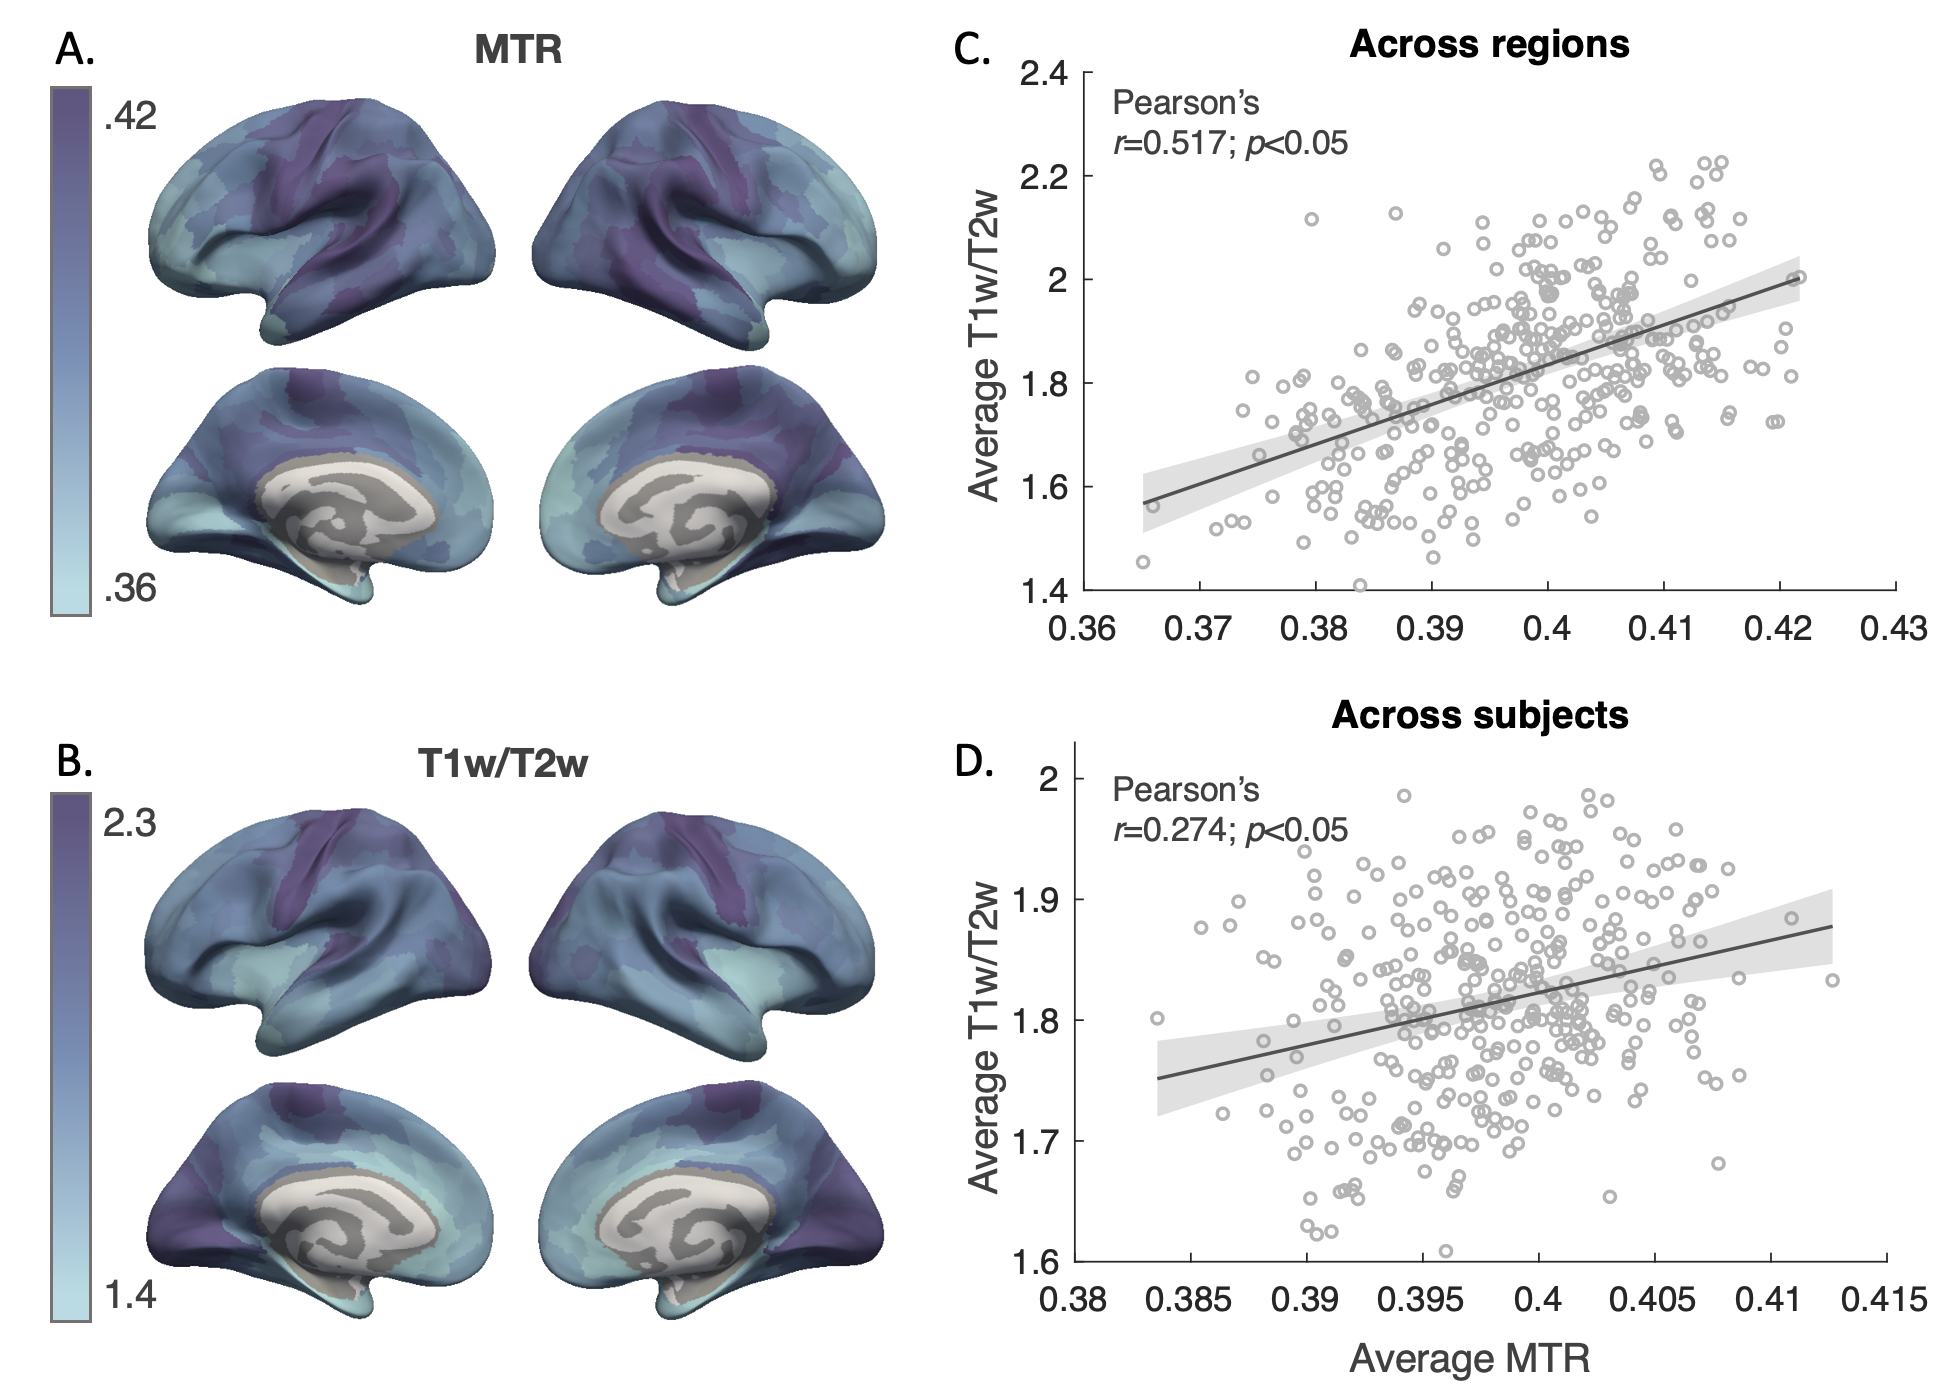
Figure 2. Intracortical MTR and T1w/T2w values. Average MTR (A) and T1w/T2w (B) across HCP multimodal parcellation regions are projected on surface. Scatter plots show Pearson’s correlation between MTR and T1w/T2w values averaged across regions (C) and across subjects (D). Shaded area represents 95% confidence interval.
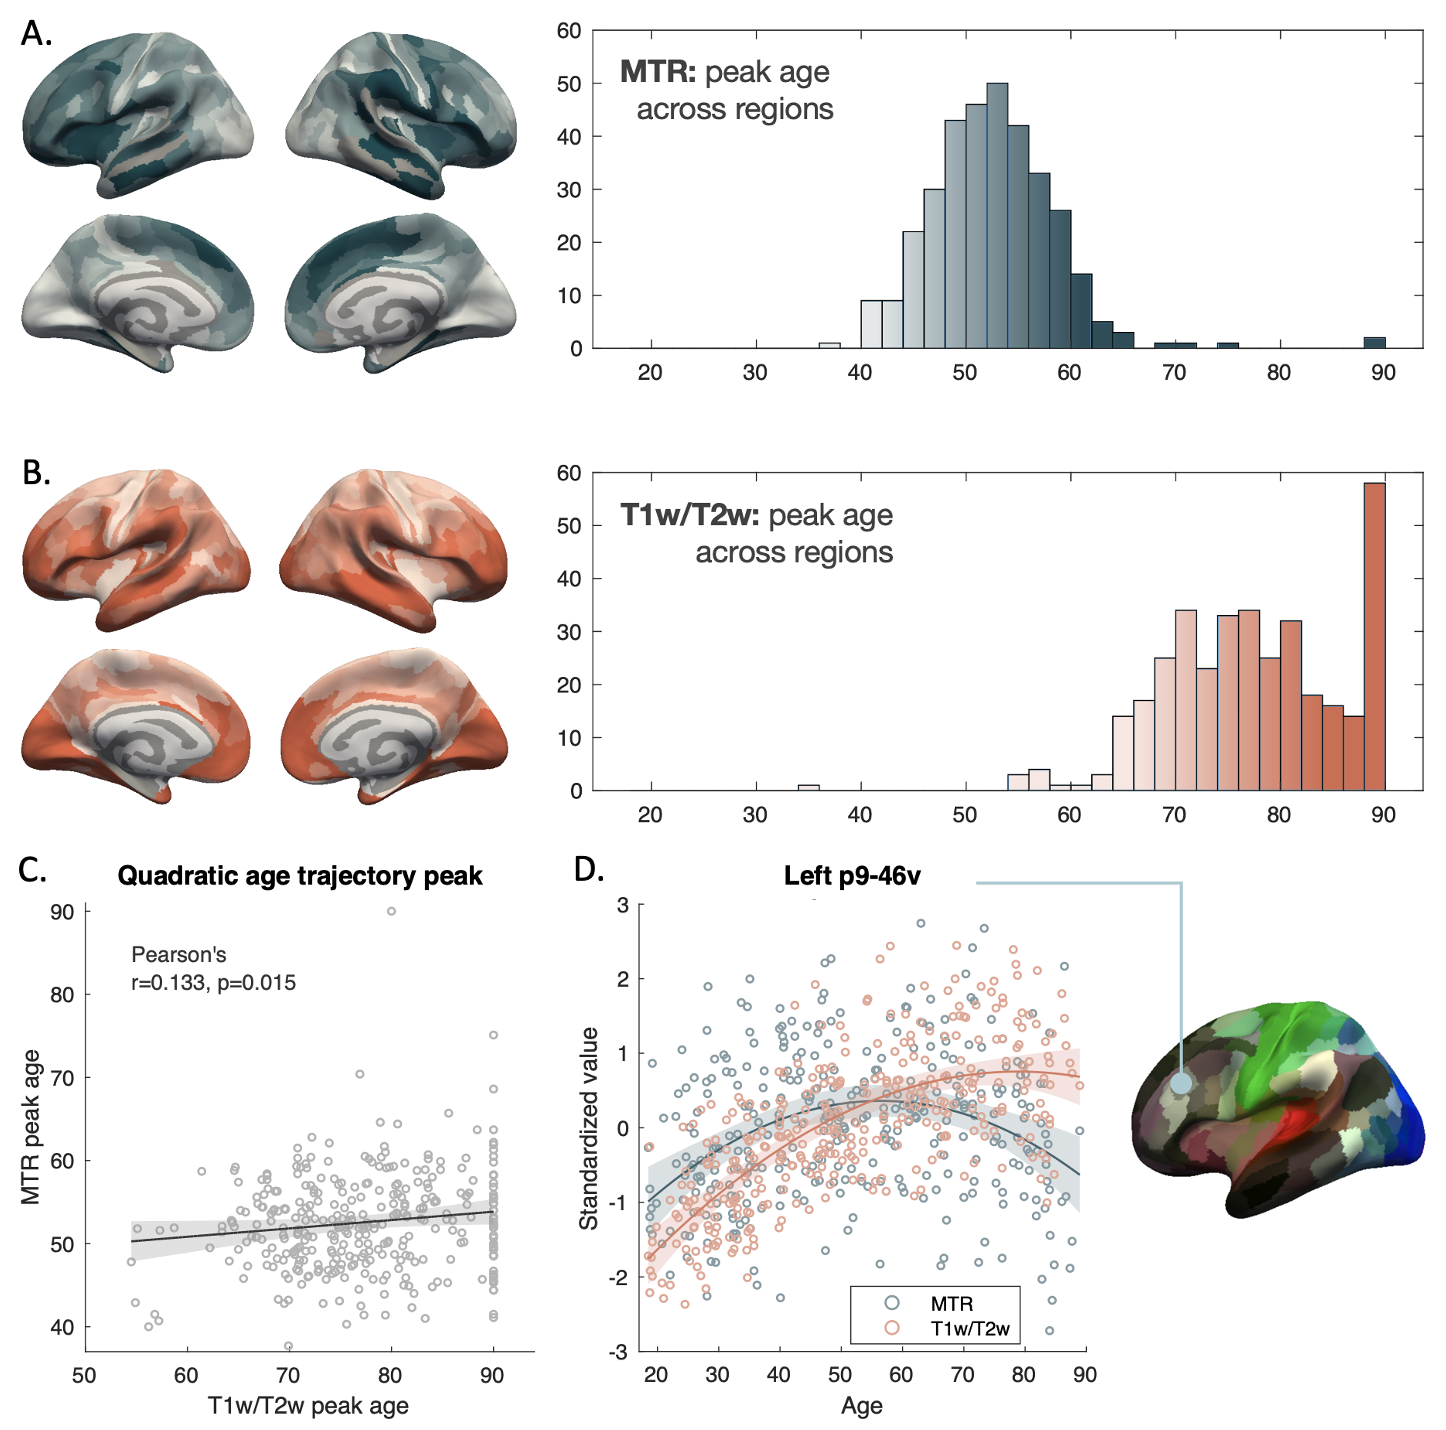
Figure 3. Peak ages measured by MTR (A) and T1w/T2w (B) based on a quadratic fitting across ROIs. Surface graph colors represent peak age values as indicated by the histograms. ROIs with significant quadratic effects that do not peak before age 90, or those with only significant linear age effects with positive increase are plotted as peak age = 90; ROIs with no significant age effects are shown in grey; C. Scatter plot of correlation between peak ages of MTR and T1w/T2w; D. Standardized age trajectories in an example prefrontal ROI. Shaded areas in C and D indicate 95% confidence interval.
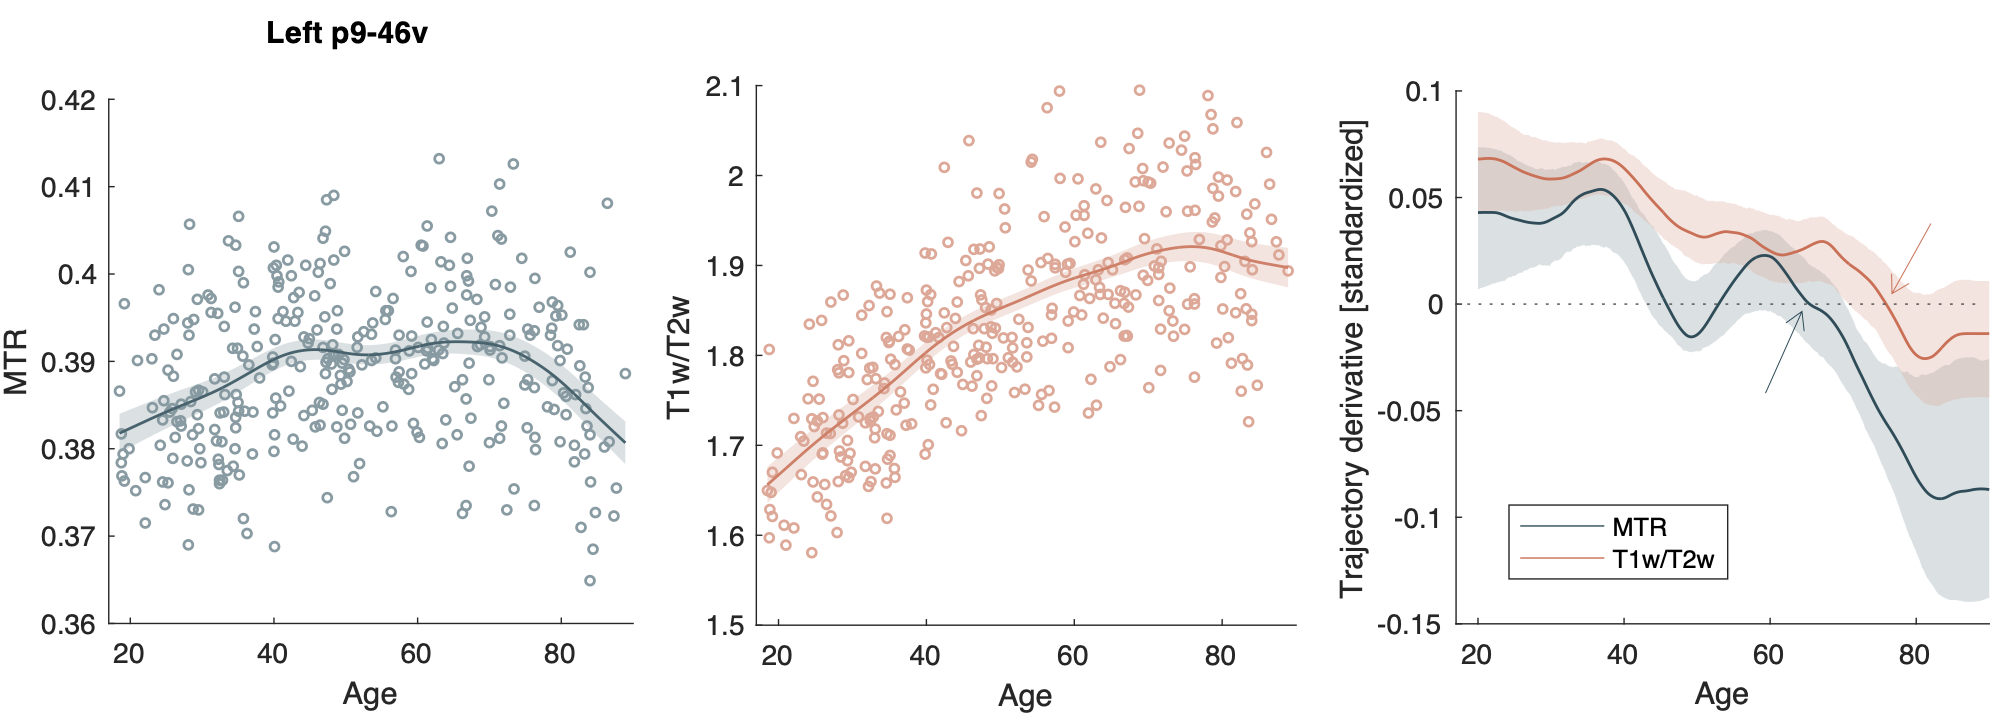
Figure 4. Spline fitted age trajectories of MTR and T1w/T2w in example prefrontal ROI shown in Figure 3D. Derivatives of the trajectories, shown on far right, were used to determine onset age of decline, which is indicated by the arrows. Confidence intervals of the derivatives, represented by the shaded area, were estimated using bootstrap with replacements across subjects over 500 iterations and a sample size of 200.
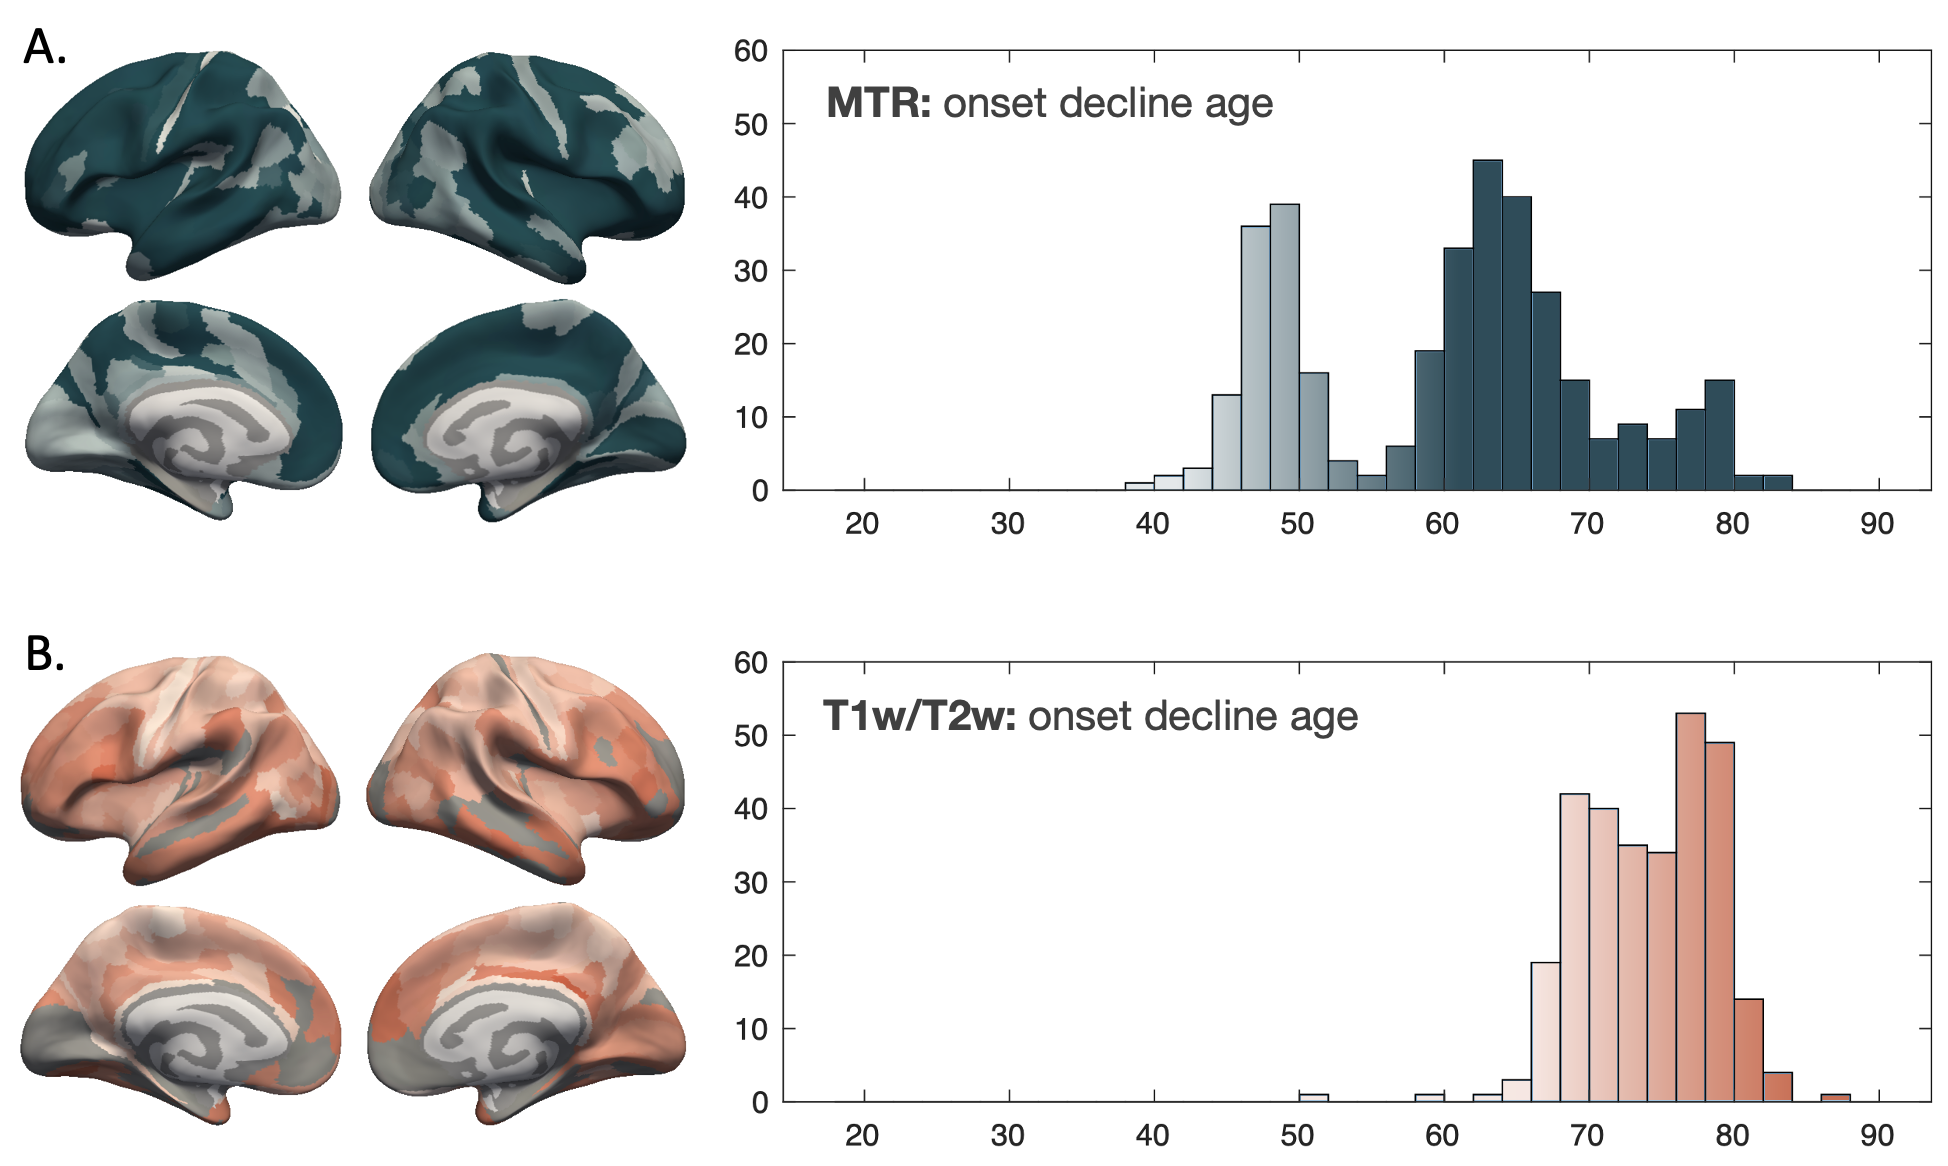
Figure 5. Onset decline ages measured by MTR (A) and T1w/T2w (B) across ROIs based on a spline fitting of intracortical myelin trajectories. Brain surface graph colors represent onset decline age values as indicated by the gradient histograms. ROIs with no significant quadratic age effects in previous analysis are plotted as grey on the surface graph.
DOI: https://doi.org/10.58530/2023/1308