1307
Normative trajectories of quantitative MRI parameters in sub-cortical grey matter on healthy ageing1Donders Institute for Brain, Cognition and Behaviour, Nijmegen, Netherlands, 2Department of Cognitive Neuroscience, Radboud University Medical Center, Nijmegen, Netherlands, 3The Erwin L. Hahn Institute, Essen, Germany, 4University of Twente, Twente, Netherlands
Synopsis
Keywords: Neurodegeneration, Aging
The effects of ageing on quantitative MRI, including R1, R2* and tissue susceptibility, are investigated in subcortical grey matter using a healthy cohort. General Linear Regression analysis indicates that ageing has significant impacts on these quantitative measures: the mean R1 has inverted U-shape appearances with time, while the mean R2* and susceptibility are closer to linear. We further studied the spatial variation in these structures and the results show that the spatial gradient of some structures (e.g. caudate and putamen) also changes with age. Normative trajectories of these parameters in subcortical grey matter associated with ageing are also investigated.
Introduction
Characterising brain development across the lifespan is essential not only to understand how our brain matures, but also to define normative space from which neurological disorders, such as Alzheimer’s and Parkinson’s diseases, can be detected and allows studies of the pathophysiology. Extensive studies demonstrated several structural changes in the brain with MRI1–4. Meanwhile, quantitative MRI (qMRI) parameters, including R1, R2* and tissue magnetic susceptibility ($$$\chi$$$), are receiving more attention as surrogate biomarkers of myelination5 and iron concentration6–8, providing more specific insights into the biochemical environment changes with ageing9. Previous research mainly investigated descriptive statistics of qMRI, for example, changes of the mean parameters across the entire cortical/subcortical structures10. Additionally, ageing and diseases may also affect the spatial distribution (gradient) of the quantitative parameters and functional connectivity11,12. In this work, we set out to investigate the cross-sectional mean and spatial effects of ageing on qMRI parameters R1, R2* and $$$\chi$$$ in subcortical grey matter (GM) structures using a healthy ageing cohort.Methods
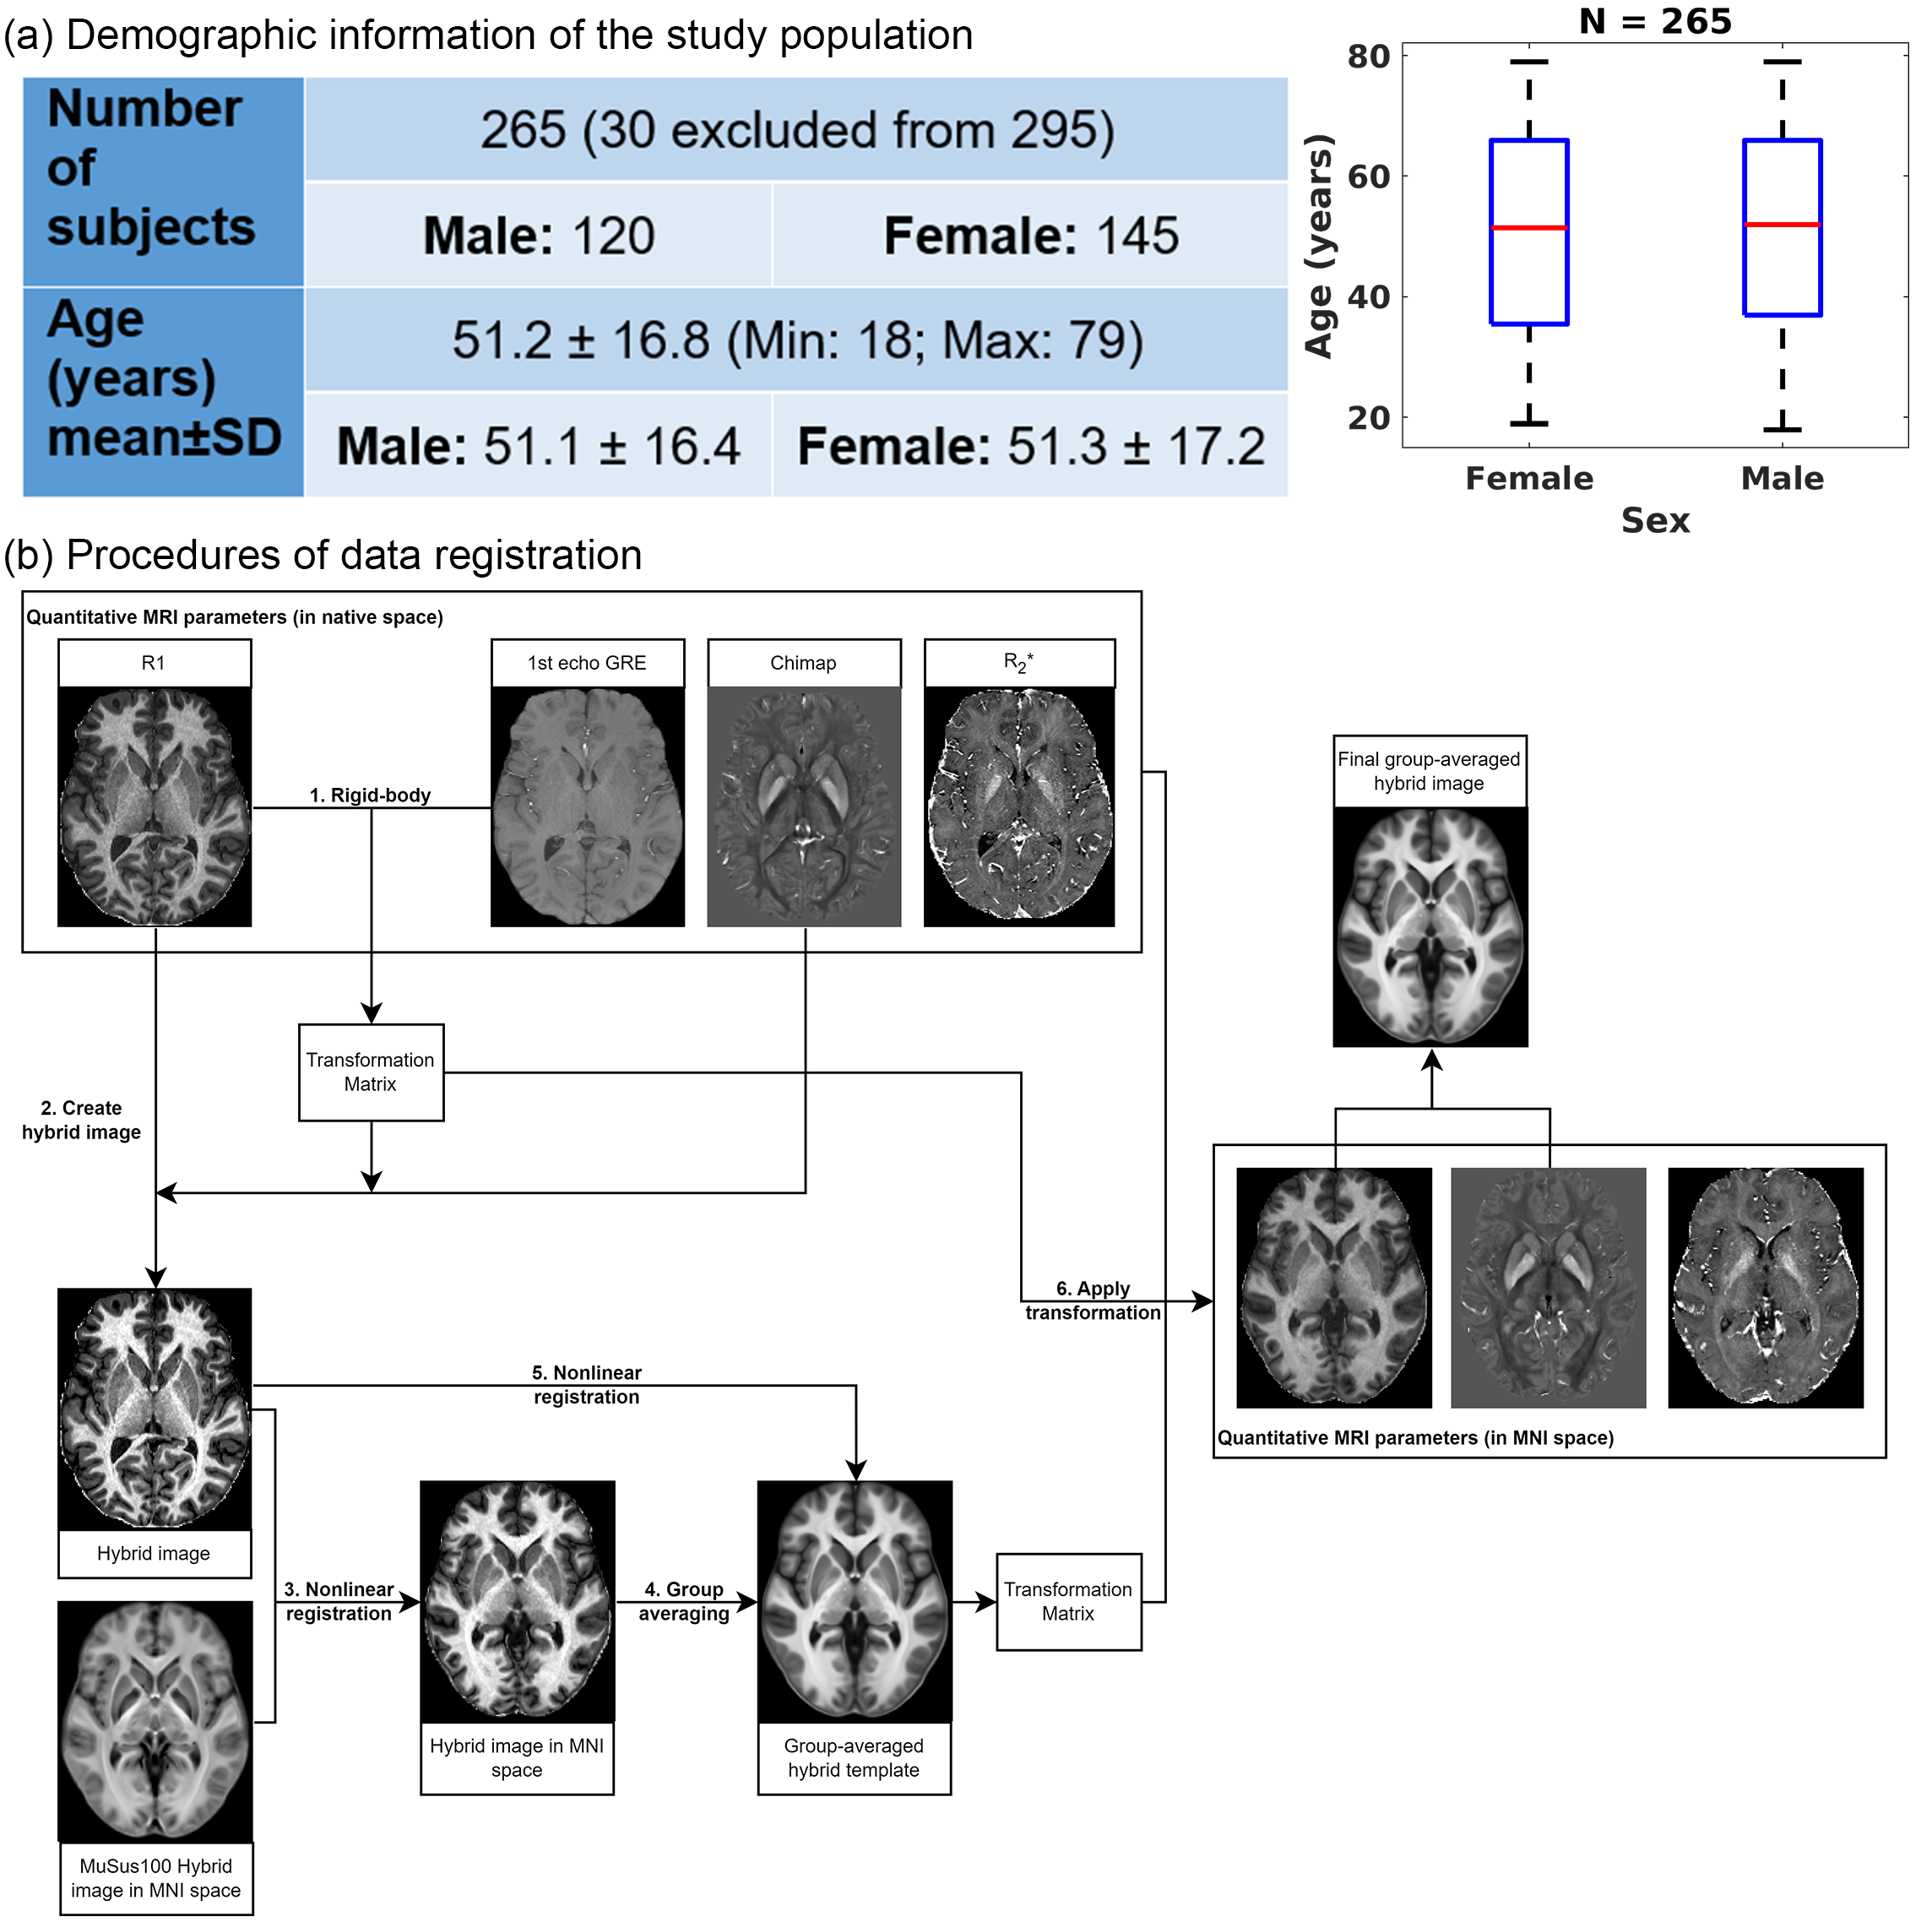
Data acquisitionData acquisition was performed at 3T (Siemens, Erlangen) on 295 healthy volunteers. Thirty subjects were excluded due to incidental findings and/or severe motion artefacts, resulting in 265 subjects included in the statistical analysis (range, 18-79years, mean±SD=51.2±16.8years, see Fig.1a). The imaging protocol consists of:
- Whole-brain T1 scan using MP2RAGE13, res=1mm iso., $$$\alpha_{1}$$$/$$$\alpha_{2}$$$=6°/5°, TI1/TI2=700ms/2000ms, TR/TE=6000ms/2.34ms, TA=7mins;
- Bipolar 3D multi-echo GRE, TR/TE1/$$$\Delta$$$TE/nTE=44ms/6.14ms/4ms/9, GRAPPA=3, res=0.8mm iso., $$$\alpha$$$=20°, TA=9.5min.
Data Processing
Brain extraction was performed using HD-BET14. The GRE brain masks were refined by excluding voxels with high R2* values on the edge to improve estimation robustness. $$$\chi$$$ maps were derived using SEPIA15 with the following pipeline: ROMEO16 for total field computation, V-SHARP17 for background field removal and LP-CNN18 for dipole field inversion. The mean susceptibility value across the whole brain was used as reference. For R2* mapping, MP-PCA denoising19,20 was applied to the complex-valued mGRE data to improve SNR and the magnitude of the denoised data was then extracted to derive R2* maps based on a closed-form solution21.
Subcortical grey matter parcellation
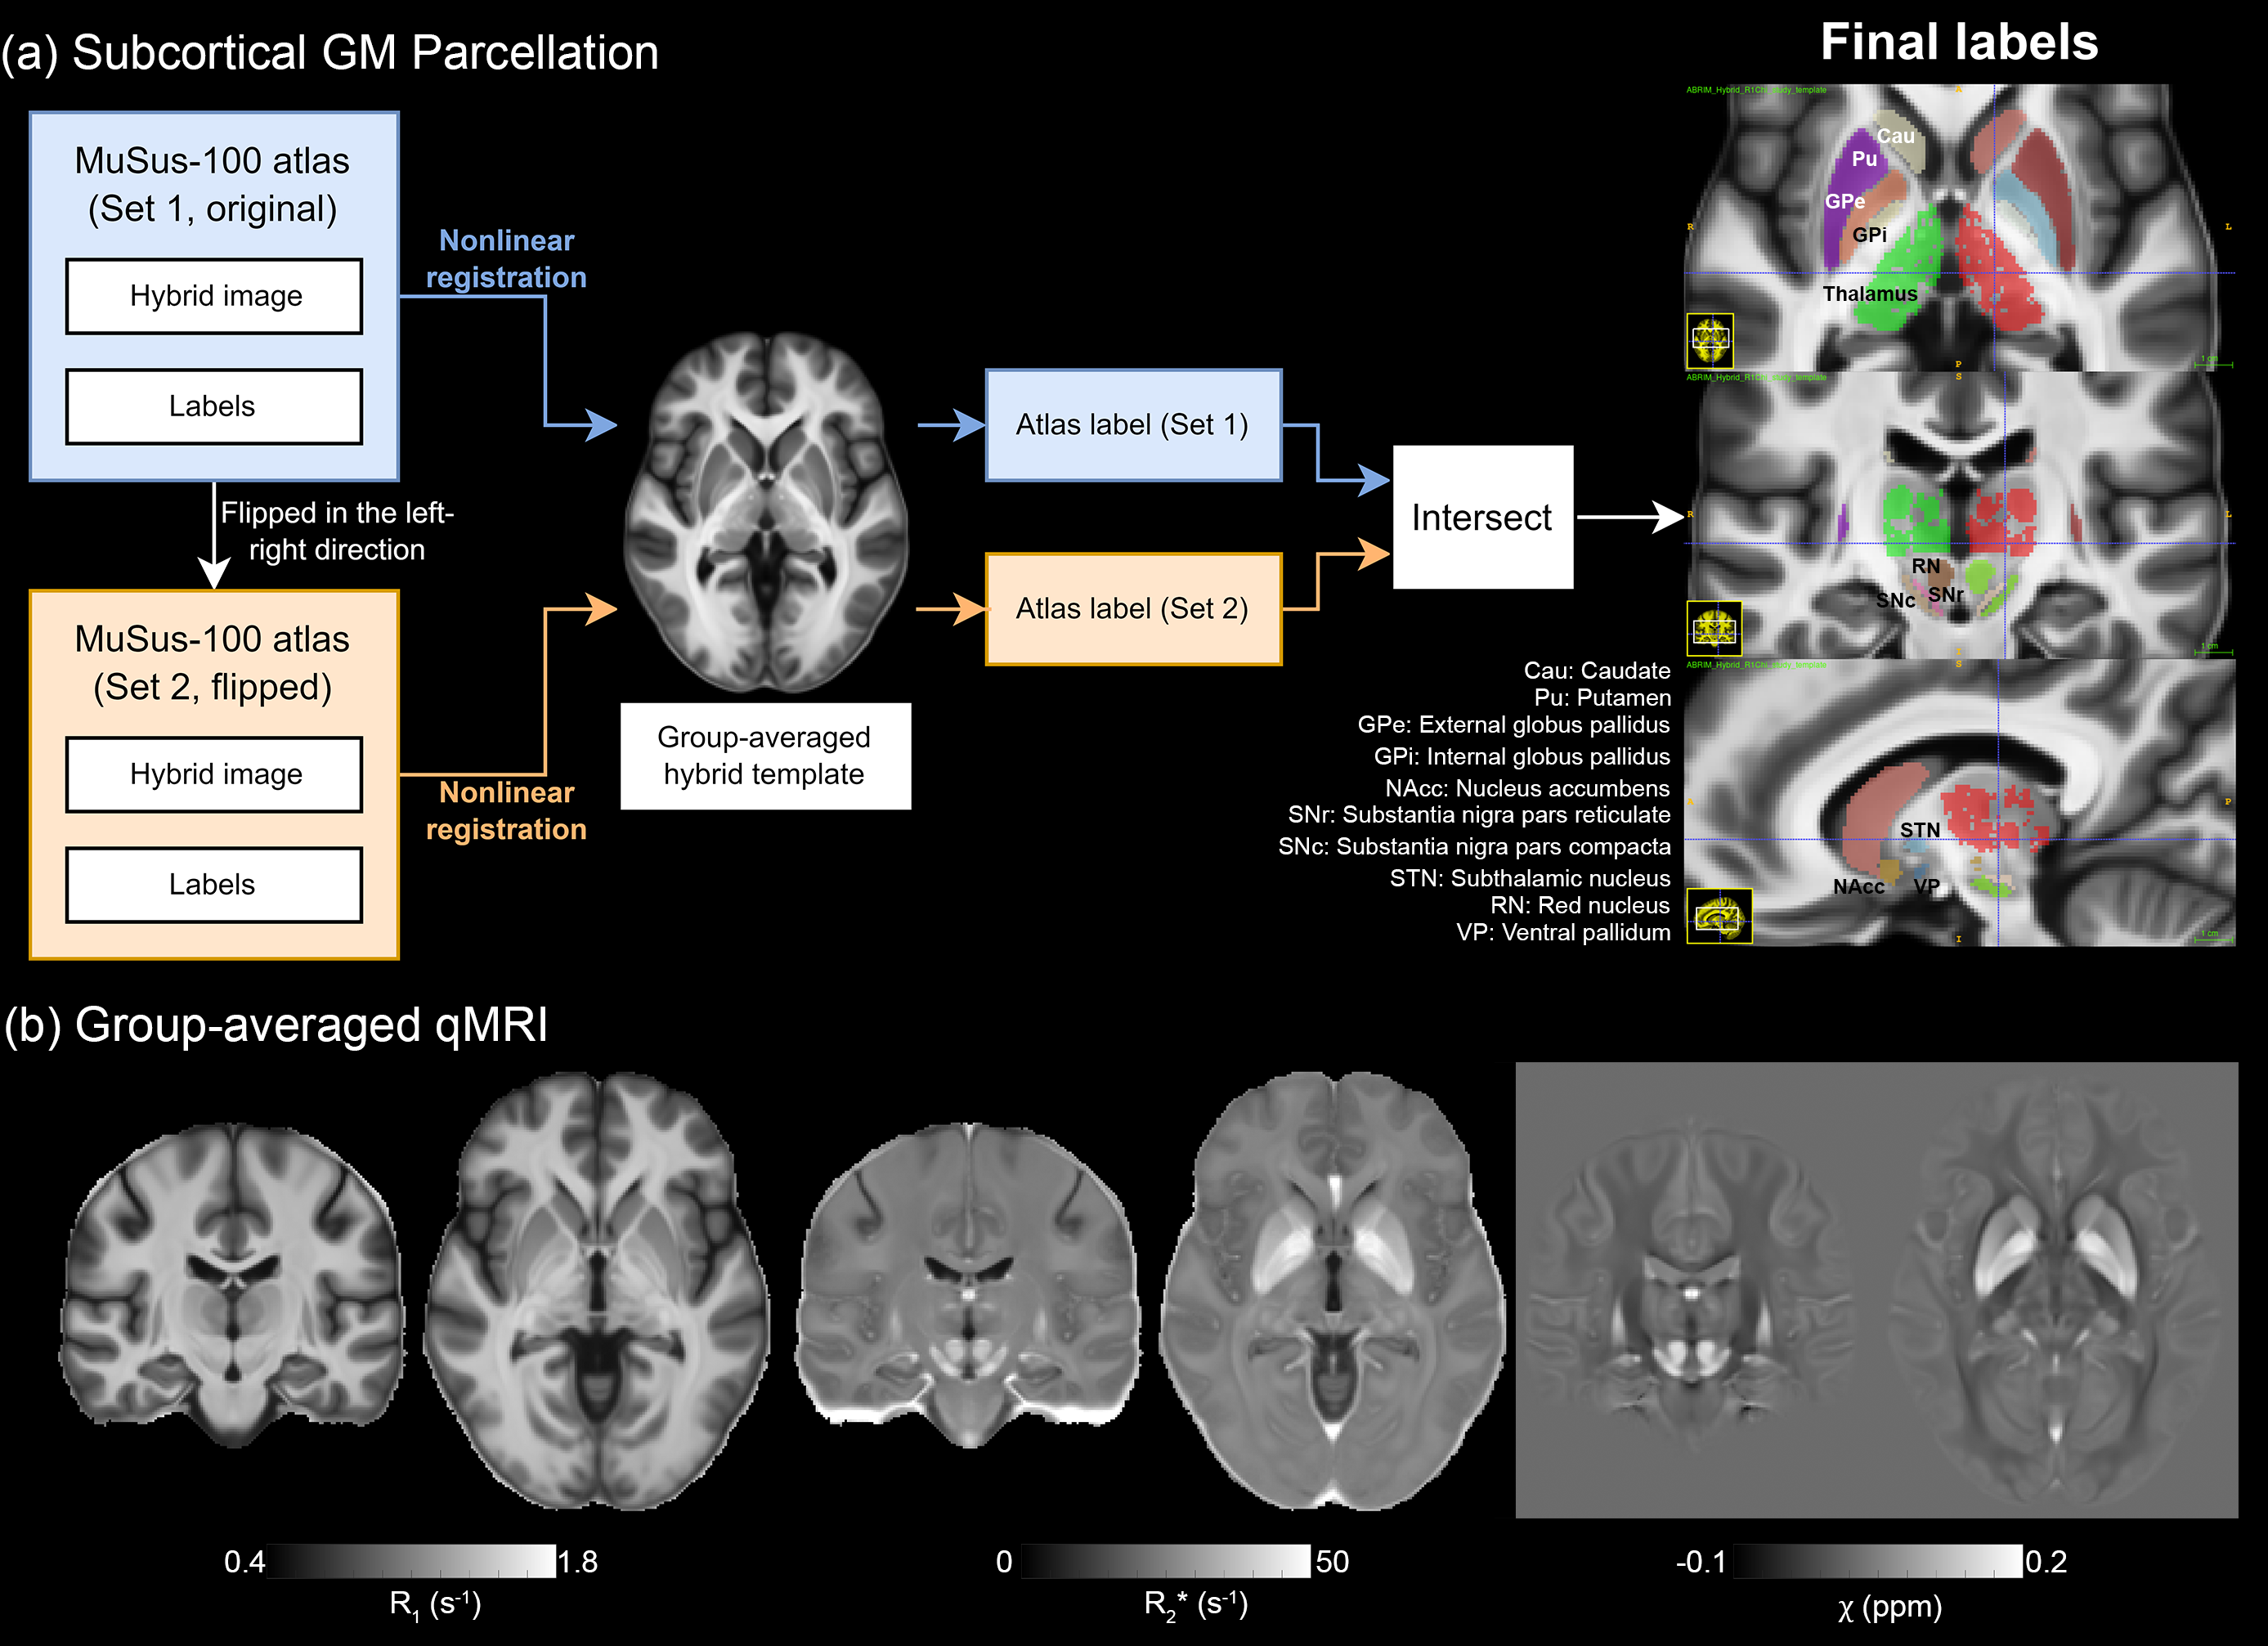
To facilitate data/statistical analysis in the common (MNI) space, image registration was performed between the R1 and GRE data, and across all subjects (see Fig.1b). R1-QSM hybrid images22 were used to deliver high-quality registration in subcortical regions. Subcortical GM parcellation was achieved by non-linear image registration23 between the group-averaged hybrid image and the template from the MuSus-100 atlas24, from which the derived transformation matrices were applied to the atlas labels. The mean qMRI (R1, R2* and $$$\chi$$$) values were computed for each structure. Additionally, a 1st order 3D polynomial function was employed to fit the spatial distribution of the qMRI parameters across the mask of each subcortical GM structure so that the spatial gradients (Posterior-Anterior/Lateral-Medial/Ventral-Dorsal of the MNI coordinate) could also be studied.
Statistical analysis
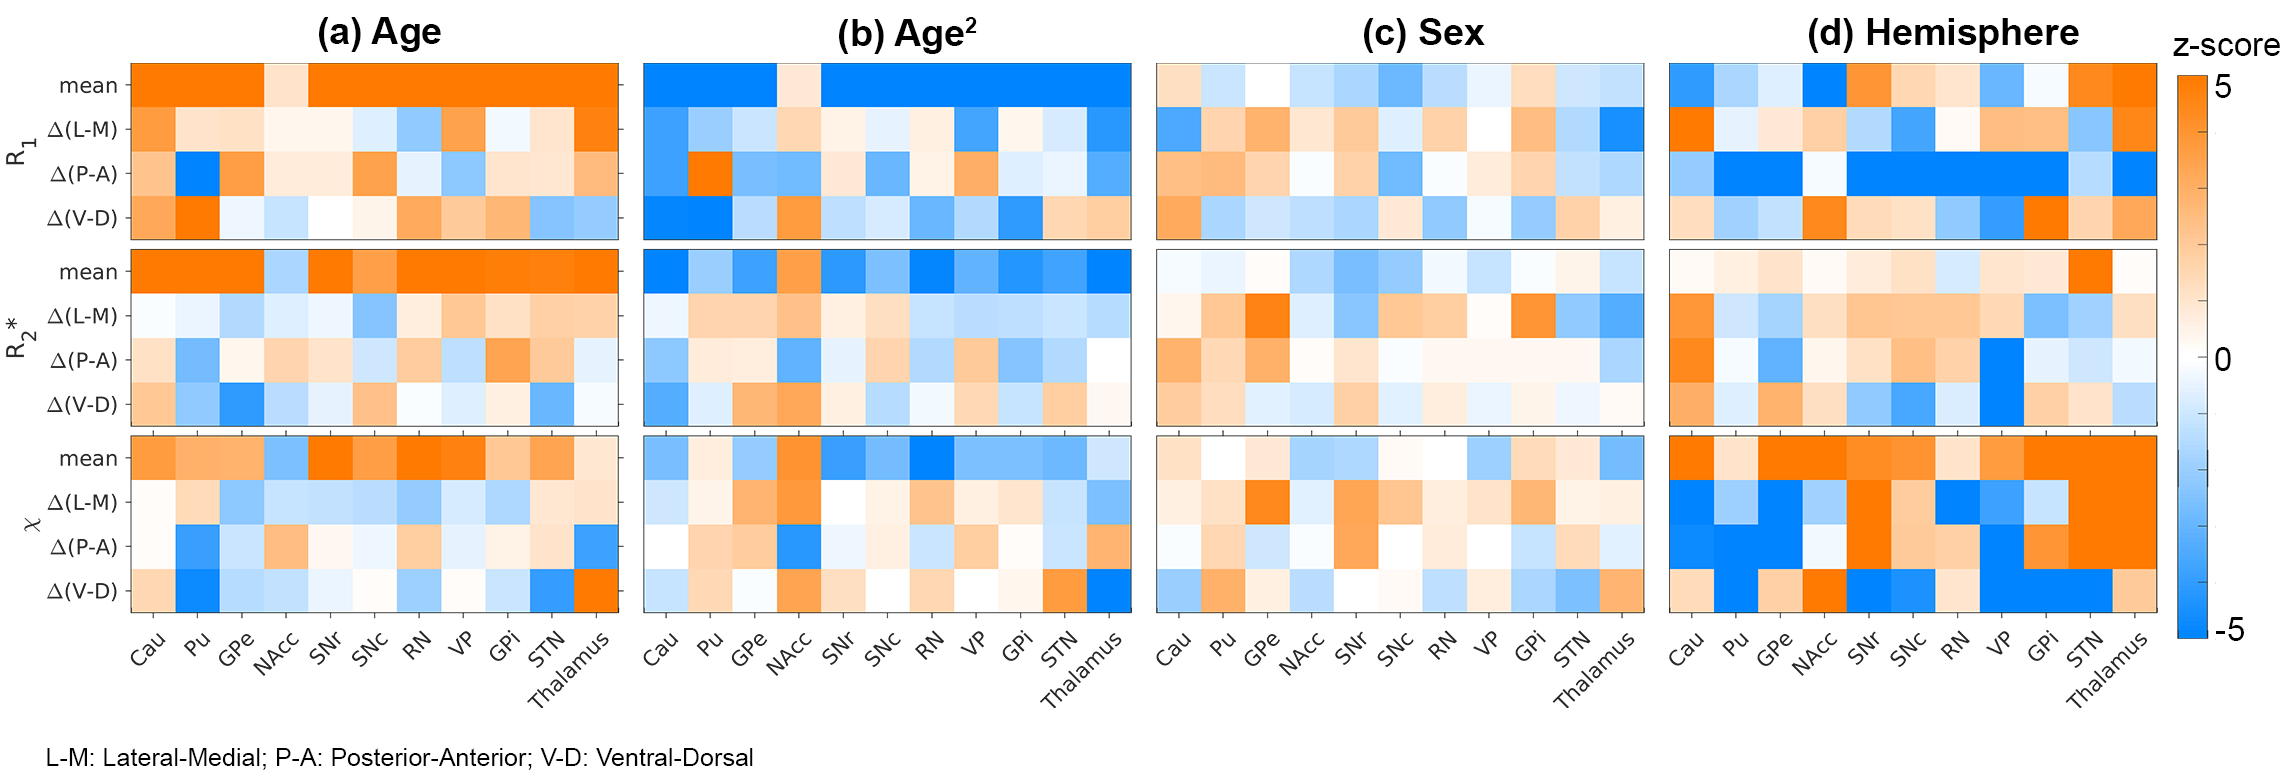
The general linear model (GLM) analysis was conducted to investigate the impact of ageing on qMRI parameters in various structures (ROI). The design matrix comprised four regressors: Age, Age2, Sex, and (left-/right-)Hemisphere:
$$qMRI_{mean/\Delta(A-P)/\Delta(L-M)/\Delta(V-D)}=\beta_{constant}+\beta_{Age}Age+\beta_{Age^2}Age^2+\beta_{Sex}Sex+\beta_{Hemisphere}Hemisphere[Eq.1]$$
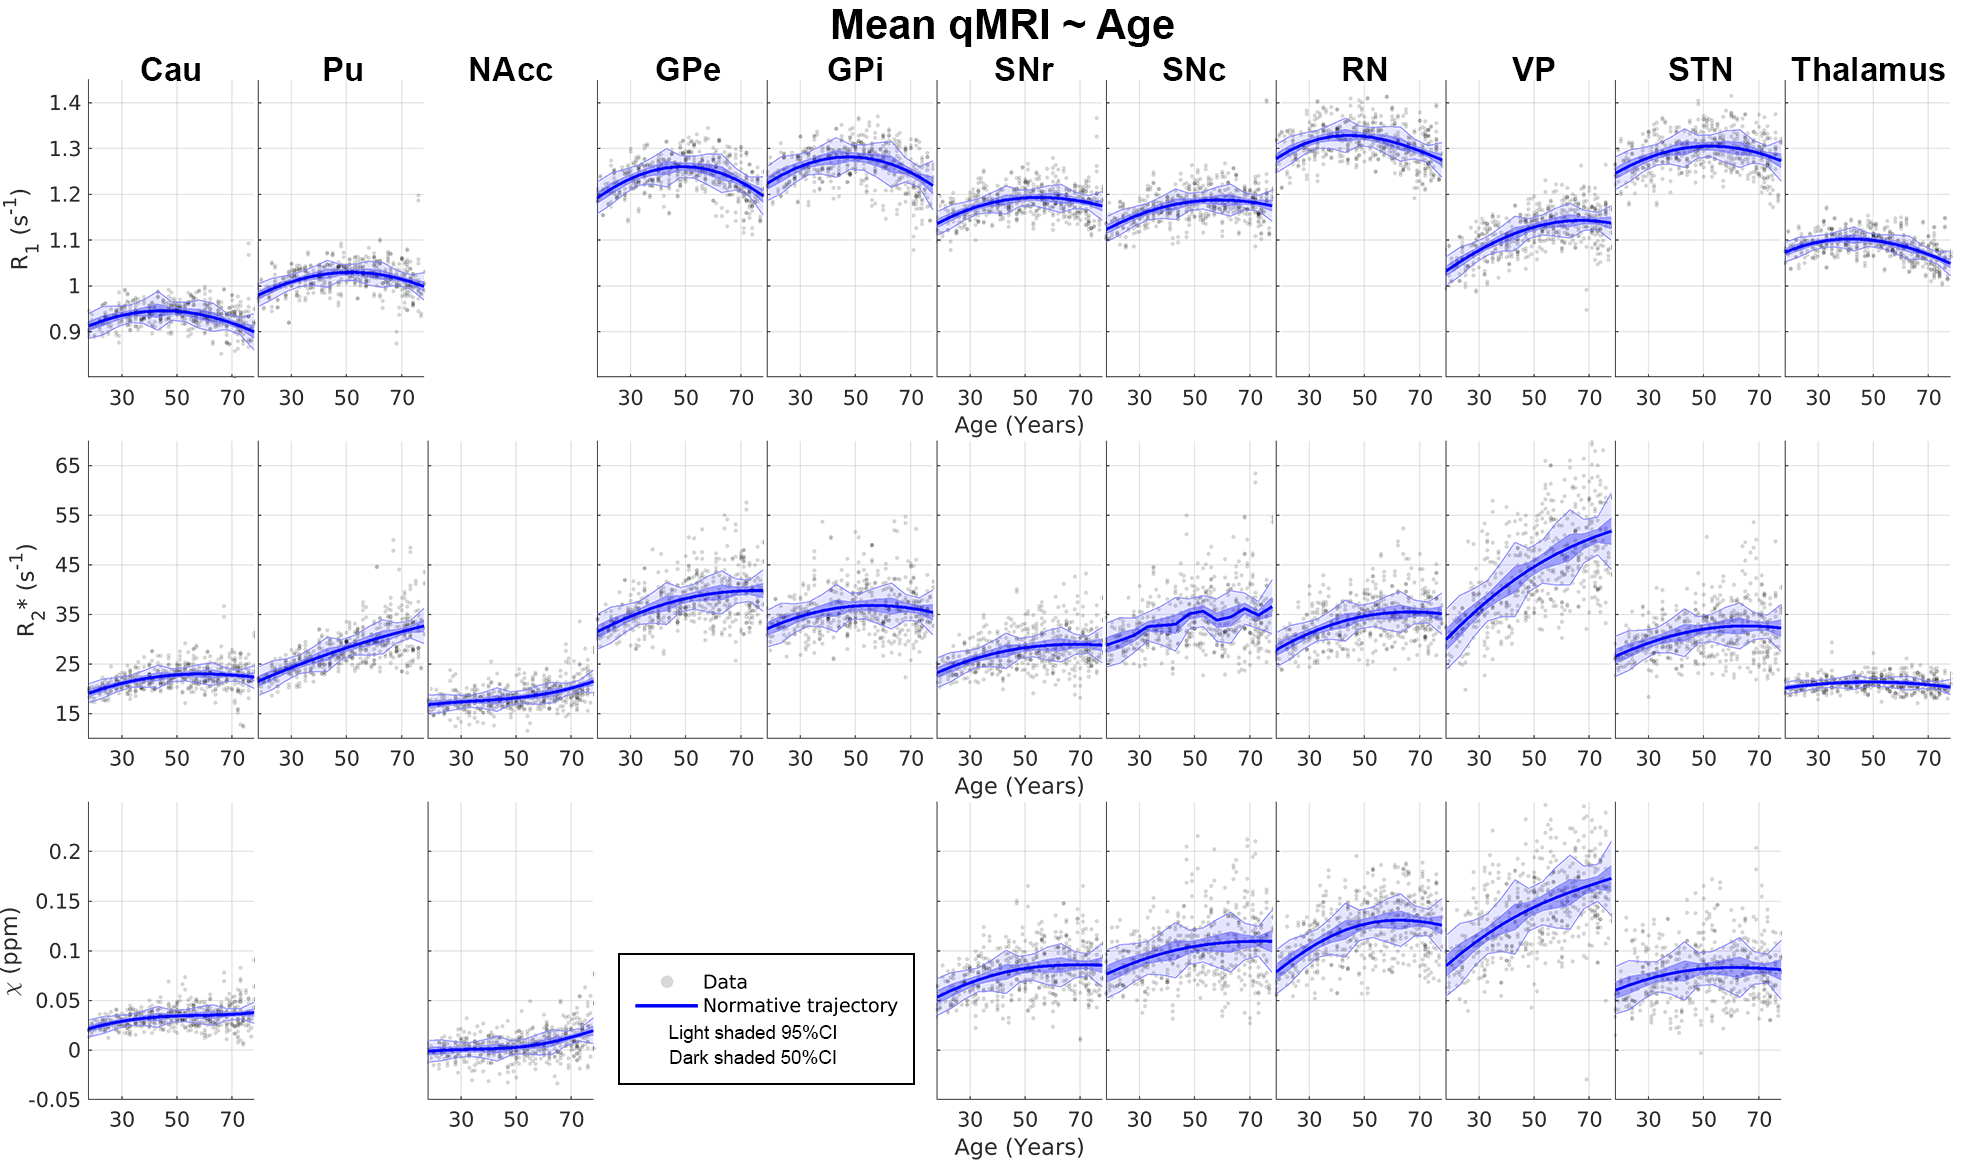
The utility of Age2 as a regressor is to consider the inverted-U shape effect observed in our R1 data which was also shown previously25. Z-statistics for each regressor was computed by converting the t-statistic of GLM using fsl_glm26. In the following normative modelling analysis, only the structures with a |z-score| greater than 3.1 on age-related effects (Age or Age2) were studied, and the data were corrected for the sex-specific and inter-hemispherical effects based on the GLM results. Further, Gaussian process regression (GRP)27 was used to compute the normative trajectory on the corrected qMRI parameters as a function of age.
Results and Discussion
The group-averaged qMRI parameters maps and the parcellation results are shown in Fig.2.The GLM results are shown in Fig.3, where the significances of the regressors are expressed in z-statistic. All means of the qMRI parameters show age-dependency except in nucleus accumbens (NAcc)(Fig.3a). The strong gradient in the P-A direction of the caudate R1 (reproducing, in a continuous manner, the findings in 11) and susceptibility are also clearly highlighted. Among the three qMRI parameters, R1 has a consistently strong Age2 effect (Fig.3b). Sex had a relatively small impact on all qMRI (Fig. 3c), whereas inter-hemispherical differences are seen in the P-A direction of R1 and in various susceptibility metrics (Fig. 3d).
The GPR analysis of the mean qMRI parameters is shown in Fig.4 highlighting the varying rates and shapes of these quantities and the increasing variance with ageing.
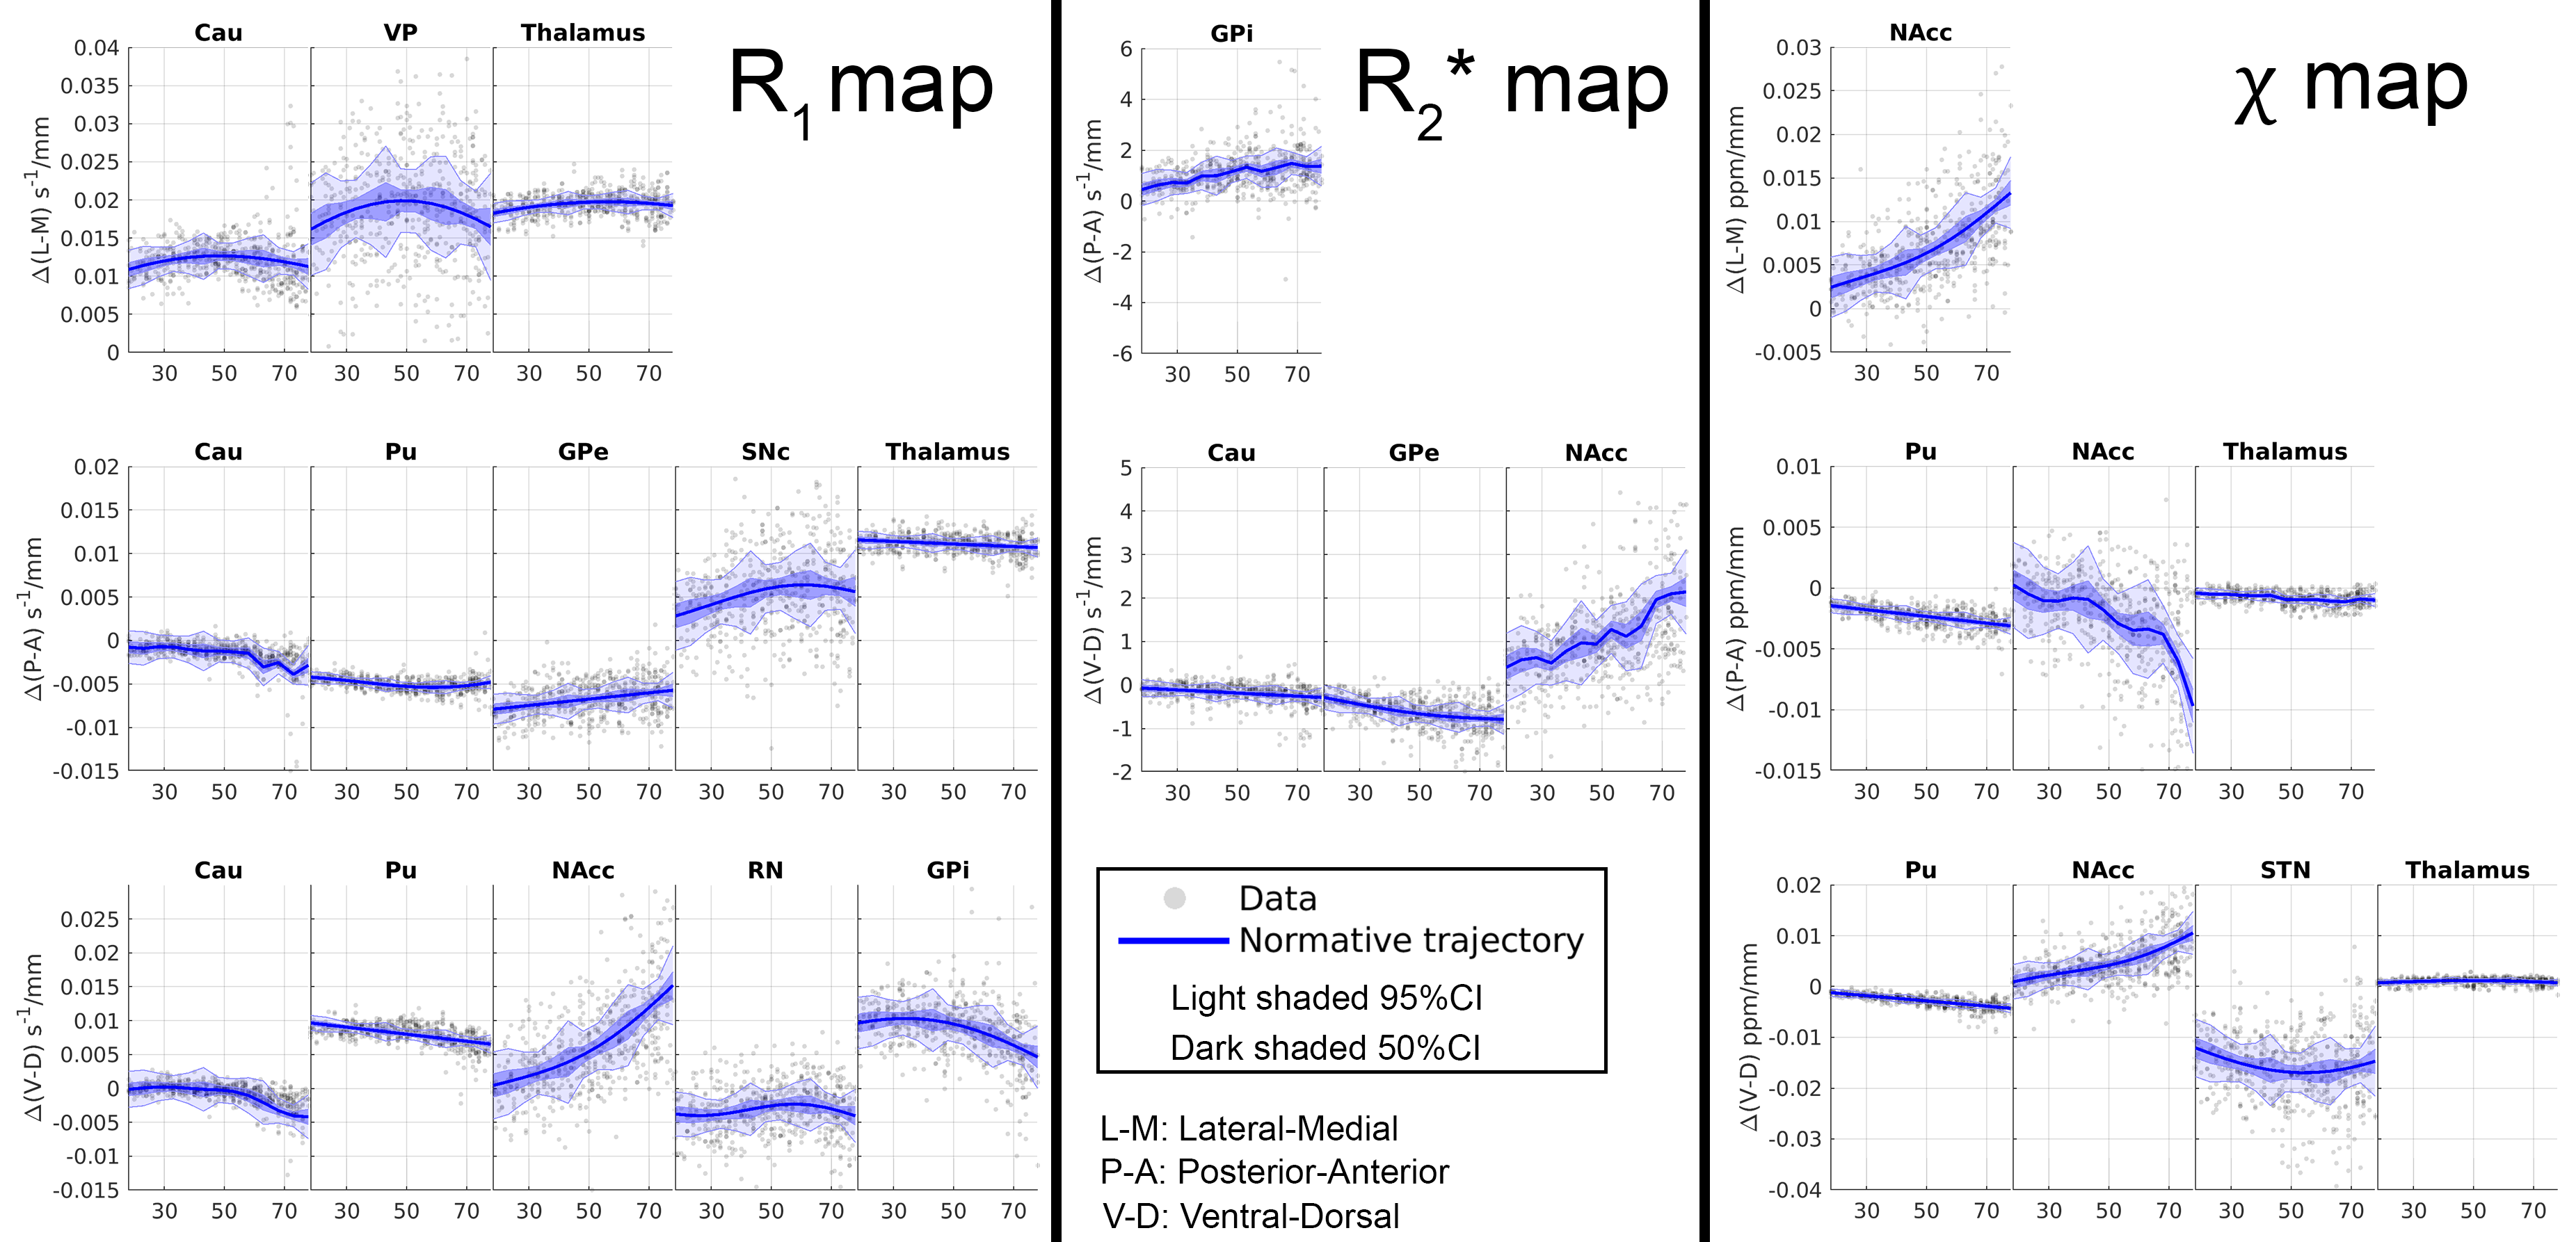
The GPR analysis of the spatial gradient qMRI parameters is shown in Fig.5. Clearly, gradients have very different variances which are likely related to the size, shape and segmentation quality of individual structures (e.g. NAcc). Further investigation is required to confirm these findings.
Conclusions
Most results on the mean qMRI parameters reproduce the previous findings on discretised age ranges. To the best of our knowledge, the spatial pattern variations have only been partially previously reported on 11. Future work will focus on: (i)interpreting the meaning of such gradients and whether they can be related to variations of the mean of different substructures (e.g. thalamus); (ii)extending the analysis to white matter and cortical GM; and (iii)evaluate the impact of cognitive markers in explaining the age-related variance.Acknowledgements
This work is part of the Marie Curie “Initial Training Networks” action from the European Union with the project reference “FP7-PEOPLE-2013-ITN”. CFB gratefully acknowledges funding from the Wellcome Trust Collaborative Award in Science 215573/Z/19/Z and the Netherlands Organization for Scientific Research Vici Grant No. 17854.References
1. Bethlehem RAI, Seidlitz J, White SR, et al. Brain charts for the human lifespan. Nature 2022;604:525–533 doi: 10.1038/s41586-022-04554-y.
2. Terribilli D, Schaufelberger MS, Duran FLS, et al. Age-related gray matter volume changes in the brain during non-elderly adulthood. Neurobiol Aging 2011;32:354–368 doi: 10.1016/j.neurobiolaging.2009.02.008.
3. Scahill RI, Frost C, Jenkins R, Whitwell JL, Rossor MN, Fox NC. A Longitudinal Study of Brain Volume Changes in Normal Aging Using Serial Registered Magnetic Resonance Imaging. Arch Neurol-chicago 2003;60:989–994 doi: 10.1001/archneur.60.7.989.
4. Ramanoël S, Hoyau E, Kauffmann L, et al. Gray Matter Volume and Cognitive Performance During Normal Aging. A Voxel-Based Morphometry Study. Front Aging Neurosci 2018;10:235 doi: 10.3389/fnagi.2018.00235.
5. Lutti A, Dick F, Sereno MI, Weiskopf N. Using high-resolution quantitative mapping of R1 as an index of cortical myelination. Neuroimage 2014;93:176–188 doi: 10.1016/j.neuroimage.2013.06.005.
6. Stüber C, Morawski M, Schäfer A, et al. Myelin and iron concentration in the human brain: A quantitative study of MRI contrast. Neuroimage 2014;93:95–106 doi: 10.1016/j.neuroimage.2014.02.026.
7. Ghadery C, Pirpamer L, Hofer E, et al. R2* mapping for brain iron: associations with cognition in normal aging. Neurobiol Aging 2015;36:925–932 doi: 10.1016/j.neurobiolaging.2014.09.013.
8. Pontillo G, Petracca M, Monti S, et al. Clinical correlates of R1 relaxometry and magnetic susceptibility changes in multiple sclerosis: a multi-parameter quantitative MRI study of brain iron and myelin. Eur Radiol 2022:1–10 doi: 10.1007/s00330-022-09154-y.
9. Wang C, Martins-Bach AB, Alfaro-Almagro F, et al. Phenotypic and genetic associations of quantitative magnetic susceptibility in UK Biobank brain imaging. Nat Neurosci 2022;25:818–831 doi: 10.1038/s41593-022-01074-w.
10. Seiler A, Schöngrundner S, Stock B, et al. Cortical aging – new insights with multiparametric quantitative MRI. Aging Albany Ny 2020;12:16195–16210 doi: 10.18632/aging.103629.
11. Drori E, Berman S, Mezer AA. Mapping microstructural gradients of the human striatum in normal aging and Parkinson’s disease. Sci Adv 2022;8:eabm1971 doi: 10.1126/sciadv.abm1971.
12. Oldehinkel M, Llera A, Faber M, et al. Mapping dopaminergic projections in the human brain with resting-state fMRI. Elife 2022;11:e71846 doi: 10.7554/elife.71846.
13. Marques JP, Kober T, Krueger G, Zwaag W van der, Moortele PFV de, Gruetter R. MP2RAGE, a self bias-field corrected sequence for improved segmentation and T1-mapping at high field. Neuroimage 2010;49:1271–1281 doi: 10.1016/j.neuroimage.2009.10.002.
14. Isensee F, Schell M, Pflueger I, et al. Automated brain extraction of multisequence MRI using artificial neural networks. Hum Brain Mapp 2019;40:4952–4964 doi: 10.1002/hbm.24750.
15. Chan K-S, Marques JP. SEPIA—Susceptibility mapping pipeline tool for phase images. Neuroimage 2021;227:117611 doi: 10.1016/j.neuroimage.2020.117611.
16. Dymerska B, Eckstein K, Bachrata B, et al. Phase unwrapping with a rapid opensource minimum spanning tree algorithm (ROMEO). Magnet Reson Med 2020 doi: 10.1002/mrm.28563.
17. Li W, Wu B, Liu C. Quantitative susceptibility mapping of human brain reflects spatial variation in tissue composition. Neuroimage 2011;55:1645–1656 doi: 10.1016/j.neuroimage.2010.11.088.
18. Lai K-W, Aggarwal M, Zijl P van, Li X, Sulam J. Medical Image Computing and Computer Assisted Intervention – MICCAI 2020, 23rd International Conference, Lima, Peru, October 4–8, 2020, Proceedings, Part II. Lect Notes Comput Sc 2020;12262:125–135 doi: 10.1007/978-3-030-59713-9_13.
19. Veraart J, Novikov DS, Christiaens D, Ades-aron B, Sijbers J, Fieremans E. Denoising of diffusion MRI using random matrix theory. Neuroimage 2016;142:394–406 doi: 10.1016/j.neuroimage.2016.08.016.
20. Does MD, Olesen JL, Harkins KD, et al. Evaluation of principal component analysis image denoising on multi-exponential MRI relaxometry. Magnetic resonance in medicine 2019;81:mrm.27658-3514 doi: 10.1002/mrm.27658.
21. Gil R, Khabipova D, Zwiers M, Hilbert T, Kober T, Marques JP. An in vivo study of the orientation-dependent and independent components of transverse relaxation rates in white matter. NMR in biomedicine 2016;29:1780–1790 doi: 10.1002/nbm.3616.
22. Zhang Y, Wei H, Cronin MJ, He N, Yan F, Liu C. Longitudinal data for magnetic susceptibility of normative human brain development and aging over the lifespan. Data Brief 2018;20:623–631 doi: 10.1016/j.dib.2018.06.005.
23. Avants BB, Tustison NJ, Song G, Cook PA, Klein A, Gee JC. A reproducible evaluation of ANTs similarity metric performance in brain image registration. Neuroimage 2011;54:2033–2044 doi: 10.1016/j.neuroimage.2010.09.025.
24. He C, Guan X, Zhang W, et al. Quantitative susceptibility atlas construction in Montreal Neurological Institute space: towards histological-consistent iron-rich deep brain nucleus subregion identification. Brain Struct Funct 2022:1–23 doi: 10.1007/s00429-022-02547-1.
25. Yeatman JD, Wandell BA, Mezer AA. Lifespan maturation and degeneration of human brain white matter. Nature communications 2014;5:4932 doi: 10.1038/ncomms5932.
26. Jenkinson M, Beckmann CF, Behrens TEJ, Woolrich MW, Smith SM. FSL. Neuroimage 2012;62:782–790 doi: 10.1016/j.neuroimage.2011.09.015.
27. Rutherford S, Kia SM, Wolfers T, et al. The normative modeling framework for computational psychiatry. Nat Protoc 2022;17:1711–1734 doi: 10.1038/s41596-022-00696-5.
28. Erramuzpe A, Schurr R, Yeatman JD, et al. A Comparison of Quantitative R1 and Cortical Thickness in Identifying Age, Lifespan Dynamics, and Disease States of the Human Cortex. Cereb Cortex 2020;31:1211–1226 doi: 10.1093/cercor/bhaa288.
29. Li Y, Sethi SK, Zhang C, et al. Iron Content in Deep Gray Matter as a Function of Age Using Quantitative Susceptibility Mapping: A Multicenter Study. Front Neurosci-switz 2021;14:607705 doi: 10.3389/fnins.2020.607705.
30. Treit S, Naji N, Seres P, et al. R2* and quantitative susceptibility mapping in deep gray matter of 498 healthy controls from 5 to 90 years. Hum. Brain Mapp. 2021;42:4597–4610 doi: 10.1002/hbm.25569.
Figures