1303
Pronounced gender and lifestyle effects in the oxygen extraction fraction (OEF) of the ageing brain1INM-4, Research Centre Juelich, Juelich, Germany, 2Department of Radiology, Weill Cornell Medical College, New York, NY, United States, 3INM-1, Research Centre Juelich, Juelich, Germany, 44Institute for Anatomy I, Medical Faculty & University Hospital Düsseldorf, Heinrich Heine University, Duesseldorf, Germany, 5Institute for Anatomy I, Medical Faculty & University Hospital Düsseldorf, Heinrich Heine University, Duesseldorf, Germany, 6RWTH Aachen University, Aachen, Germany, 7INM-11, JARA, Forschungszentrum Jülich, Juelich, Germany, 8JARA - BRAIN - Translational Medicine, Aachen, Germany, 9Department of Neurology, RWTH Aachen University, Aachen, Germany
Synopsis
Keywords: Neurodegeneration, Aging, oxygen extraction fraction, OEF, gender differences, menopause
Regionally-resolved oxygen extraction fraction was investigated in an elderly cohort. OEF was obtained from a single 3D mGRE scan using a novel integrated model of QSM phase signal and quantitative blood oxygenation level dependent magnitude signal. Whereas age showed little influence on this metabolic parameter, a pronounced gender effect was observed. A lifestyle index reflecting physical and social activity as well as alcohol and nicotine consumption showed strong correlations with OEF. Venous blood volume fraction and tissue R2*, but not tissue QSM, also reflected lifestyle influence, showing that brain age is more than number of years.
Introduction
The fraction of oxygen extracted from blood by brain tissue (OEF) reports on the balance between oxygen delivery and consumption and is a key parameter in characterizing the energy metabolism of the brain1. OEF can be used to assess disturbances of physiological homeostasis and has been suggested as a biomarker in several diseases, among which Alzheimer’s disease2, brain tumours3, stroke4 and MS5.It is expected and reported that OEF will increase with age1. However, alterations in both vascular and metabolic factors will have an effect on OEF and might influence the outcome in a given cohort. For example, it was shown that OEF is differentially affected by Alzheimer’s disease and vascular pathology in elderly individuals with cognitive impairment2. Strong correlation between CBF and OEF at the whole-brain level was found6, together with pronounced gender aspects in ageing6 and significant circadian rhythm dependence6.
We examine below the influence of age, gender and lifestyle factors on region-specific OEF using data acquired with a 3D multi-echo gradient echo (mGRE) sequence from 155 healthy volunteers representing a subset of the population-based cohort 1000BRAINS7,8. The conversion of magnitude and phase multi-echo information to OEF is done using a novel integrated model of QSM phase signal and quantitative blood oxygenation level dependent magnitude signal (qBOLD) (QSM+qBOLD, or QQ) 9-11 shown to provide OEF measurements that are in good agreement with the gold standard 15O PET-OEF12 .
Materials and Methods
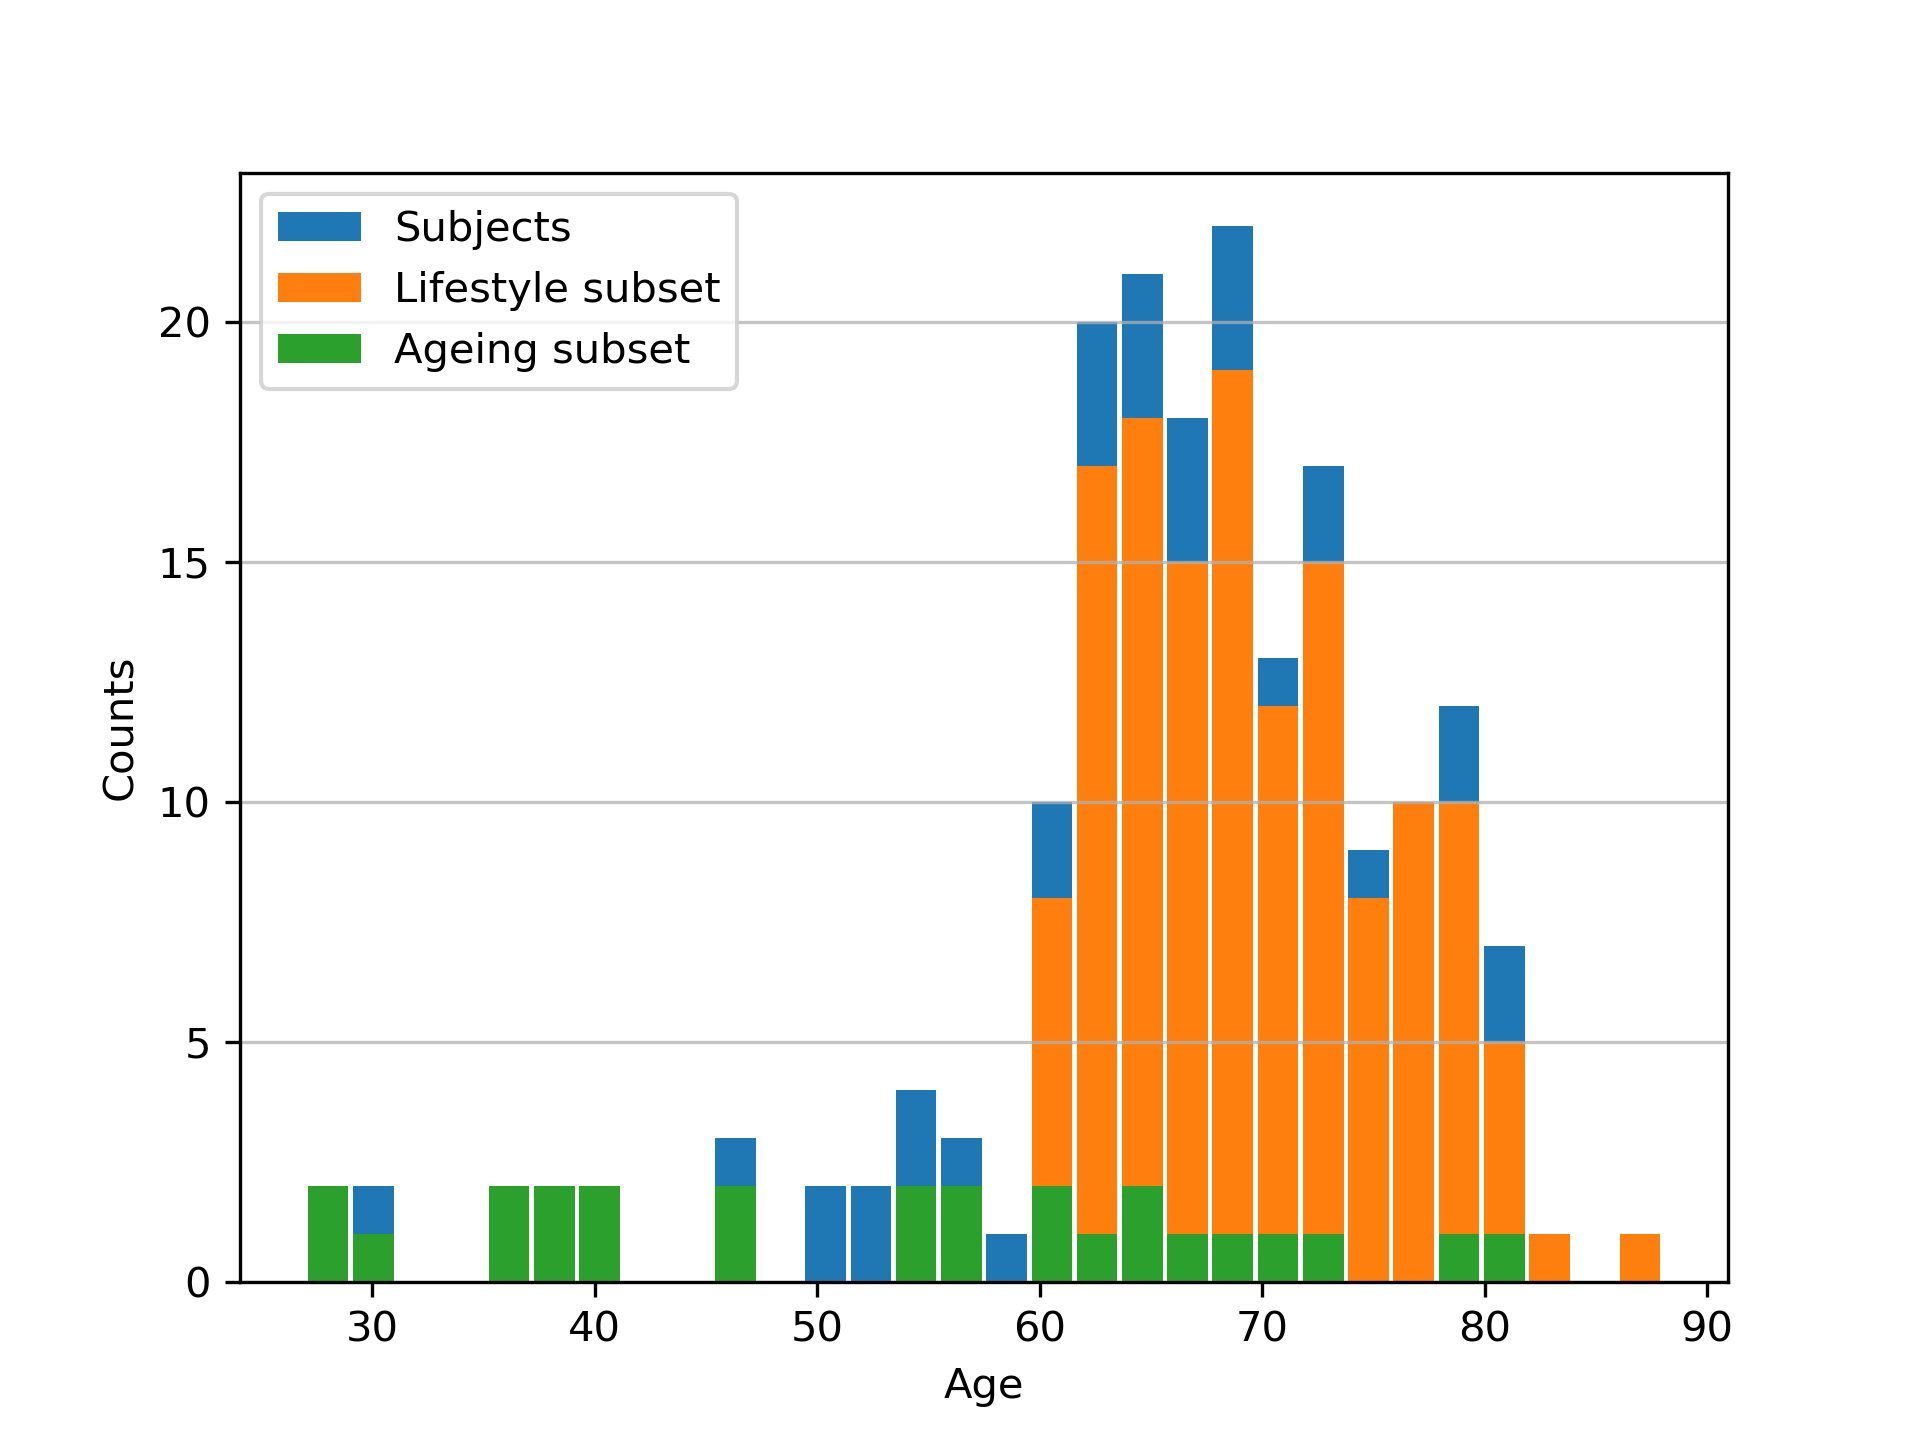
A 155-volunteer subcollective of the population-based 1000BRAINS cohort (age distribution in Fig.1) was investigated with an extensive multiparametric quantitative protocol13-15 at a 3T Siemens scanner. The scan relevant to this study was a 3D multi-echo gradient echo acquisition (TR=50ms, 7deg, 18 echoes, 1x1x2mm3, TA=4min:30s) used for OEF processing. In addition to neuropsychological tests, self-reported data on physical activity, social integration, alcohol consumption and smoking, as well as blood samples were acquired for the majority of the participants. Data on all four lifestyle variables were combined in a lifestyle risk factor7, which was shown to correlate with changes in gyrification index and resting state functional connectivity in the full 1000BRAINS cohort7. We further defined an ‘age dependence subsample’13-15 from our 1000BRAINS subcohort, consisting of 26 volunteers spanning 7 decades as uniformly as possible (demographics in Fig.1). Data for all volunteers for which the 3D mGRE scan and lifestyle scores were available were included in the lifestyle risk factor analysis. Thus, a total of 139 volunteers are included in the ‘lifestyle cohort’ analysis, and 26 volunteers in the ‘age dependence subsample’ analysis, with overlap of 10 volunteers between the subcollectives.OEF values were derived from the magnitude and phase data of the single mGRE scan using the QQ-CC-TV method 9-11.
Brain parcellation was done with Freesurfer using the MPRAGE anatomical scan of the 1000BRAINS imaging protocol and ROI masks were registered to the quantitative maps using ANTs. Mean values, age and lifestyle dependence and correlations between the quantitative parameters were calculated for each ROI using Python (statsmodels and Pingouin packages). P-values below 0.05 were considered significant.
Results and Discussion
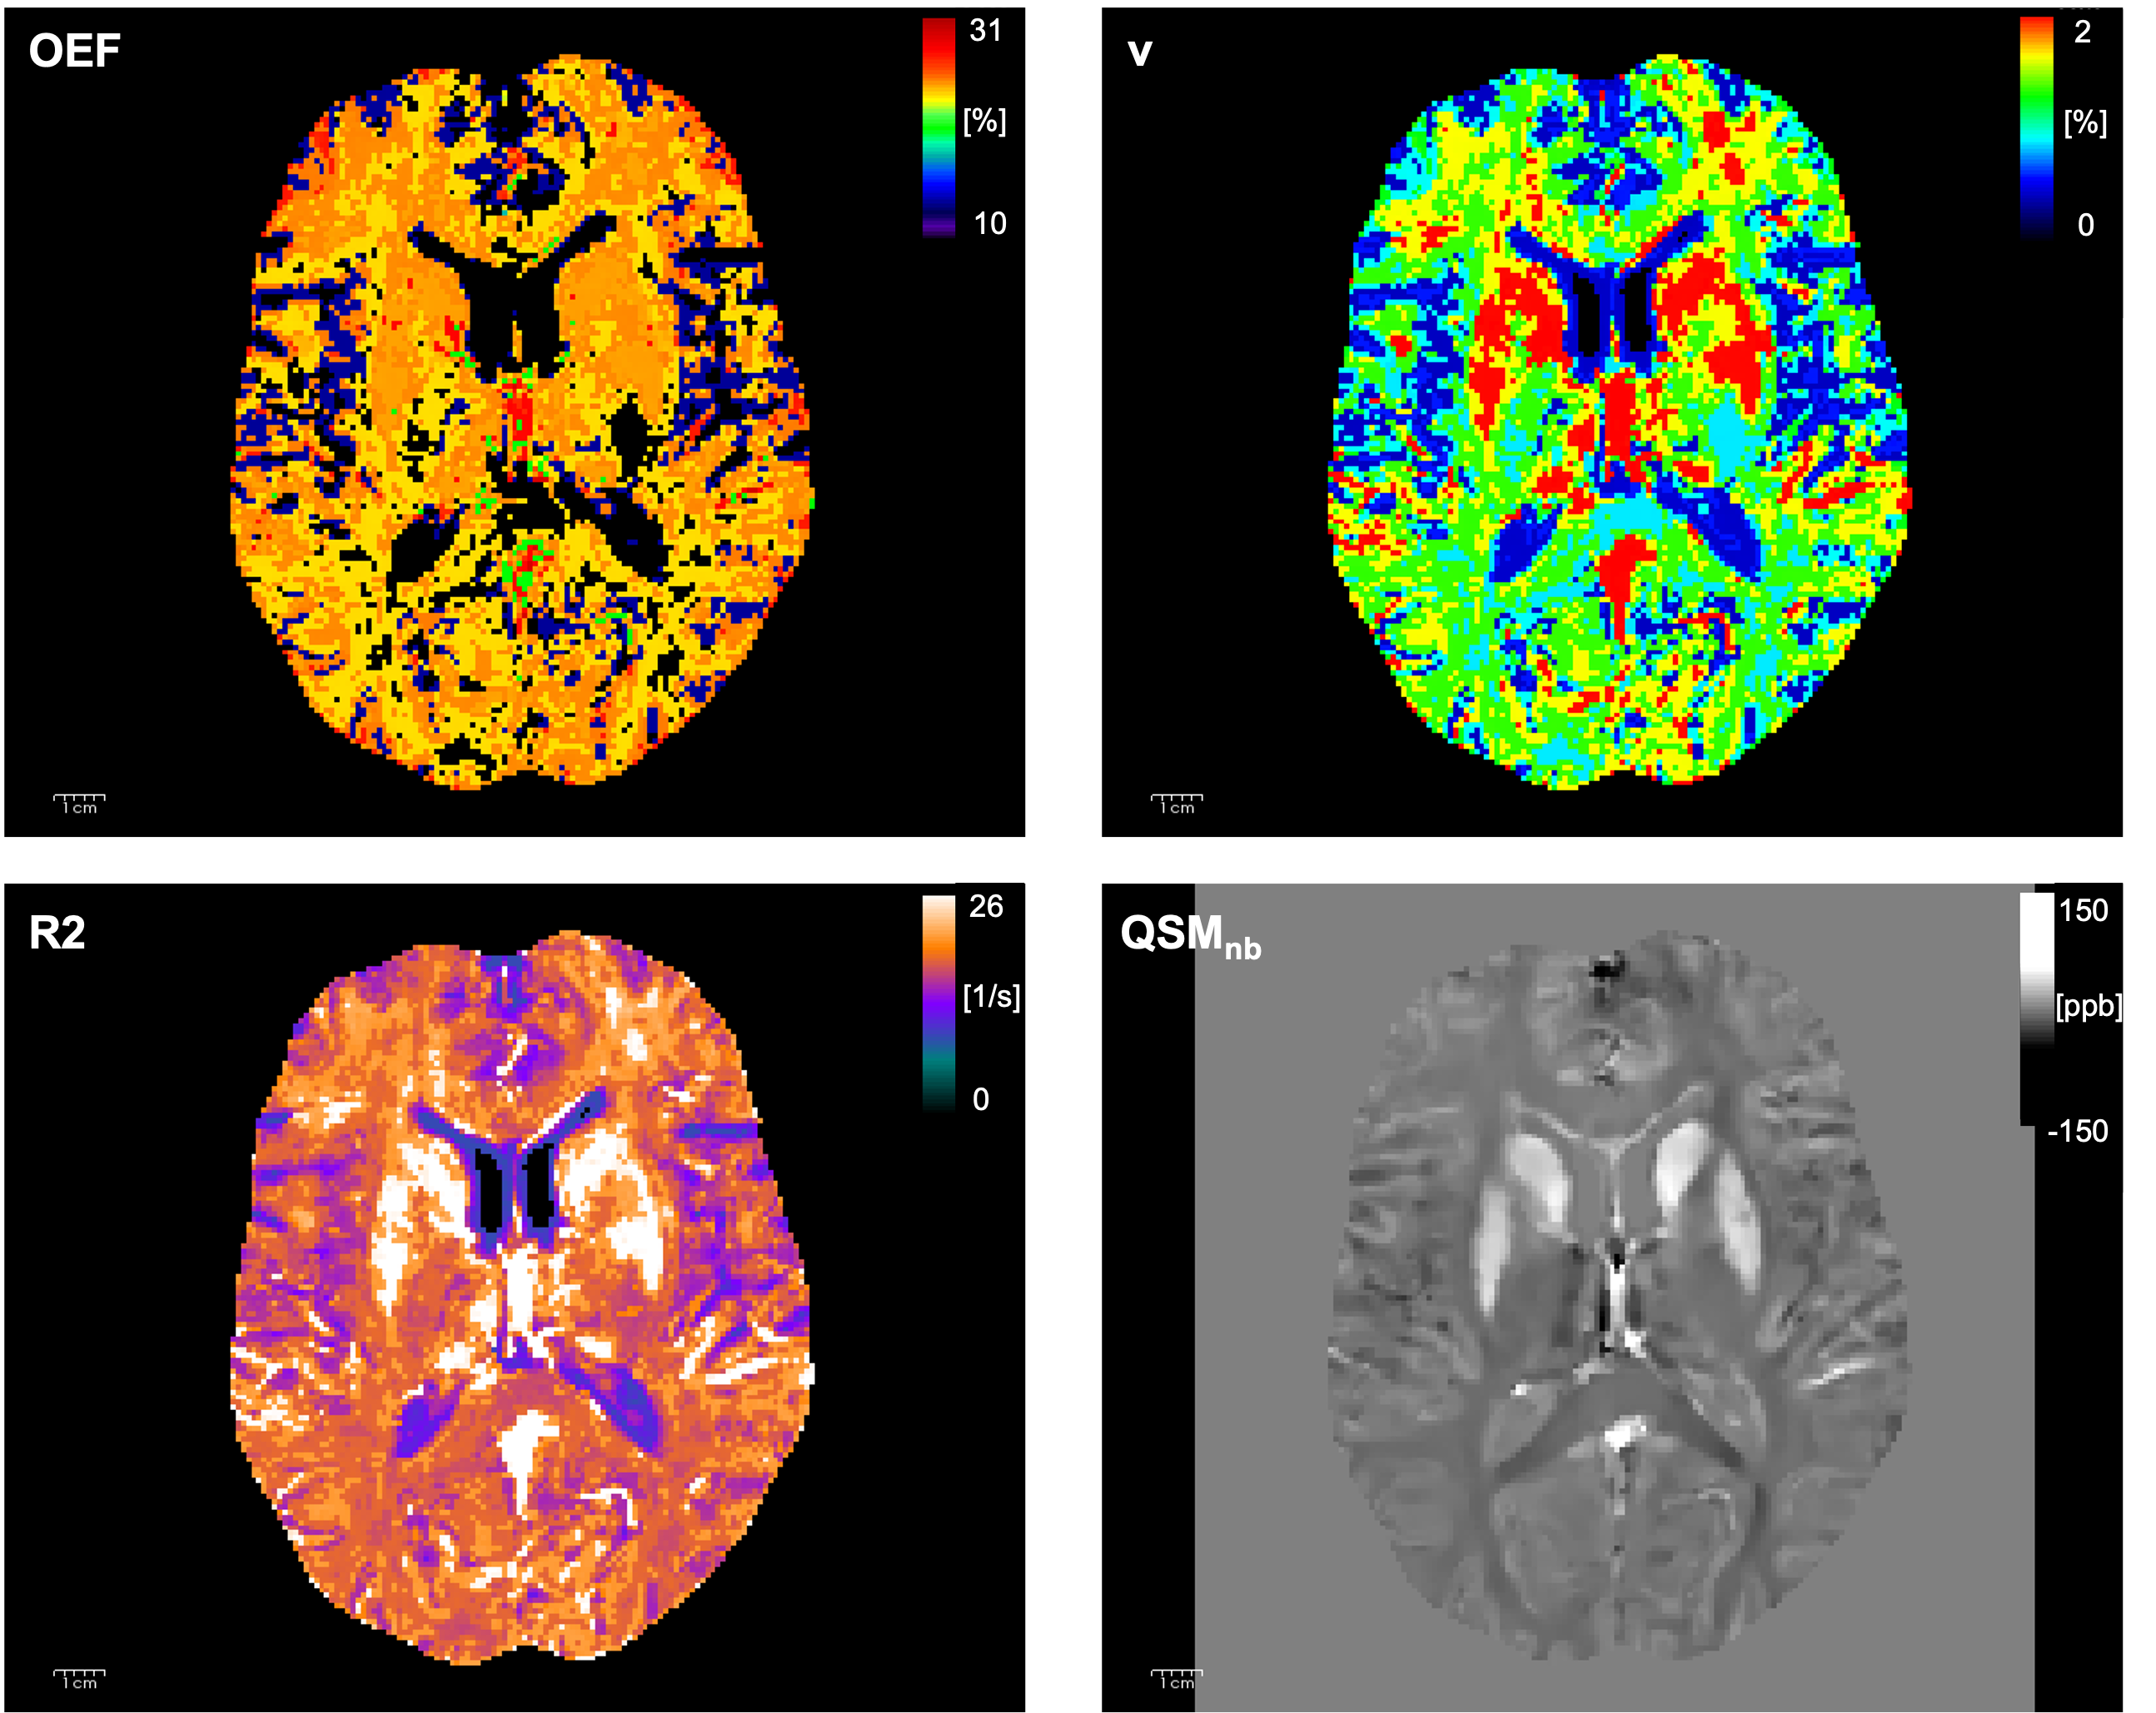
Representative maps of the parameters extracted from a single mGRE scan11 are shown in Fig.2. Despite the fact that OEF varies little in individual brains, the average cortical and subcortical OEF shows distinct regional distribution (Fig.3a), with a mean around 25. This is lower than reported before9-12 perhaps reflecting lacking flow compensation in the mGRE acquisition. The mean values show pronounced variability (Fig. 3b), illustrating sensitivity to the physiological variation within the cohort. As a trend, OEF increased with age in the vast majority of ROIs, but only reached significance in two (gyrus rectus, lingual gyrus). Tissue QSM showed age dependence in the basal ganglia and a few cortical regions (auditory region, olfactory sulcus), consistent with previous results15. Venous blood volume fraction and R2 increased significantly with age in ~10 ROIs each.In contrast to limited age dependence, OEF showed pronounced correlation with the lifestyle index in 33 cortical regions (Fig. 4); similar numbers were found for R2-lifestyle correlation. No significant correlation with lifestyle index was found for QSM and QSMnb and few for v. The most consistent effect, however, was provided by gender differences in OEF (Fig. 5) – significant in most ROIs before, and 100 ROIs after multiple comparison correction, using lifestyle as a covariate. Further documented in Fig.5, OEF was reduced in the female population, compared to the male one, in all significant ROIs and also at whole-brain level – the latter reported before6. Since all women included in our cohort were older than the average menopausal age (51 y), the effect might be attributed to a decline after menopause in cellular machinery responsible for oxidative metabolism (e.g. mitochondria), such that the cells cannot enhance their oxygen metabolic rate even though blood oxygen is available6.
Conclusions
We find pronounced influence on the metabolic parameter OEF of gender and a lifestyle index previously found to correlate with structural and functional changes in the elderly8, but hardly an influence of age, supporting increasing evidence that the metabolic age of the brain is defined by more than the number of life years.Acknowledgements
No acknowledgement found.References
[1] J, . Cerebral oxygen extraction fraction MRI: Techniques and applications. Magn Reson Med. 2022; 88: 575- 600. doi:10.1002/mrm.29272
[2] Jiang D, Lin Z, Liu P, et al. Brain oxygen extraction is differentially altered by Alzheimer’s and vascular diseases. J Magn Reson Imaging. 2020;52:1829-183.
[3] Stadlbauer A, Zimmermann M, Kitzwogerer M, et al. MR imaging-derived oxygen metabolism and neovascularization characterization for grading and IDH gene mutation detection of gliomas.Radiology. 2017;283:799-809.
[4] Fan AP, Khalil AA, Fiebach JB, et al. Elevated brain oxygenextraction fraction measured by MRI susceptibility relates toperfusion status in acute ischemic stroke.J Cereb Blood FlowMetab. 2020;40:539-551.
[5] Cho J, Nguyen TD, Huang W, et al. Brain oxygen extraction fraction mapping in patients with multiple sclerosis. J Cereb Blood Flow Metab. 2022 Feb;42(2):338-348. doi: 10.1177/0271678X211048031.
[6] Peng SL, Dumas JA, Park DC, Liu P, Filbey FM, McAdams CJ, Pinkham AE, Adinoff B, Zhang R, Lu H. Age-related increase of resting metabolic rate in the human brain. Neuroimage. 2014 Sep;98:176-83. doi: 10.1016/j.neuroimage.2014.04.078.
[7] Caspers, S. et al. Studying variability in human brain aging in a population-based German cohort-rationale and design of 1000BRAINS. Front. Aging Neurosci. 6, 149 (2014).
[8] Bittner, N., Jockwitz, C., Mühleisen, T.W. et al. Combining lifestyle risks to disentangle brain structure and functional connectivity differences in older adults. Nat Commun 10, 621 (2019). https://doi.org/10.1038/s41467-019-08500-x
[9] Cho J, Kee Y, Spincemaille P, et al. Cerebral metabolic rate of oxygen (CMRO2) mapping by combining quantitative susceptibility mapping (QSM) and quantitative blood oxygenation level-dependent imaging (qBOLD). Magn Reson Med.2018;80:1595-1604
[10] Cho J, Zhang S, Kee Y, et al. Cluster analysis of time evolution (CAT) for quantitative susceptibility mapping (QSM)and quantitative blood oxygen level-dependent magnitude (qBOLD)-based oxygen extraction fraction (OEF) and cerebral metabolic rate of oxygen (CMRO2) mapping.Magn Reson Med.2020;83:844-857.196.
[11] Cho J, Spincemaille P, Nguyen TD, Gupta A,Wang Y. Temporal clustering, tissue composition, and total variation for mapping oxygen extraction fraction using QSM and quantitative BOLD. Magn Reson Med. 2021;86:2635-2646. doi:10.1002/mrm.28875
[12] Cho J, Lee J, An H, et al. Cerebral oxygen extraction fraction (OEF): comparison of challenge-free gradient echo QSM+qBOLD (QQ) with 15O PET in healthy adults. J Cereb Blood Flow Metab 2021; 41: 1658–1668.
[13] A.M. Oros-Peusquens, J. Kielmann, N.J. Shah. The ageing quantitative brain: a multiparametric qMRI study. Proc.Intl.Soc.Magn.Reson.Med. 2021, abstract nr. 262
[14] J.Kielmann, A.M. Oros-Peusquens, N. Bittner, S. Caspers, N.J. Shah. Asymmetries in the distribution of quantitative MRI parameters in the brain. Proc.Intl.Soc.Magn.Reson.Med. 2021, abstract nr. 3067
[15] A.M. Oros-Peusquens, L. Hau, N.J. Shah. Iron, myelin and cortical brain ageing: investigating correlations between QSM, R2, R2* and R2'. Proc.Intl.Soc.Magn.Reson.Med. 2022, abstract nr. 1526
[16] Yablonskiy DA, Sukstanskii AL, Luo J, Wang X. Voxel spread function method for correction of magnetic field inhomogeneity effects in quantitative gradient-echo-based MRI. Magn Reson Med. 2013 Nov;70(5):1283-92. doi: 10.1002/mrm.24585.Figures
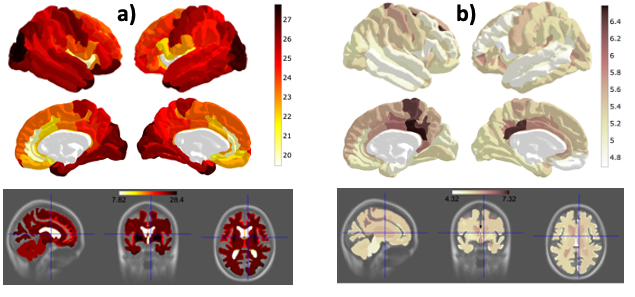
Mean value (a) and standard deviation (b) of OEF for each ROI of the Destrieux atlas. The ROIs were identified by Freesurfer segmentation of each individual brain anatomical scan. The values are obtained from 139 elderly volunteers (age distribution shown in blue in Fig. 1). The lowest tissue values are seen in the insular cortex(~19), highest in pallidum and putamen(~29). A clear pattern emerges, of higher OEF in primary areas, lower OEF in higher cognitive areas.
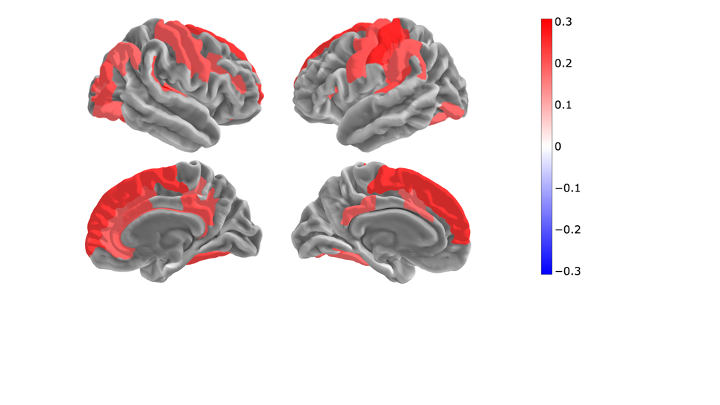
OEF showed significant correlation with the lifestyle index in 52 cortical regions. Gender was used as covariate. The highest correlation is found in the primary areas: auditory cortex, primary somatosensory cortex, superior frontal gyrus and corpus callosum (anterior midbody).
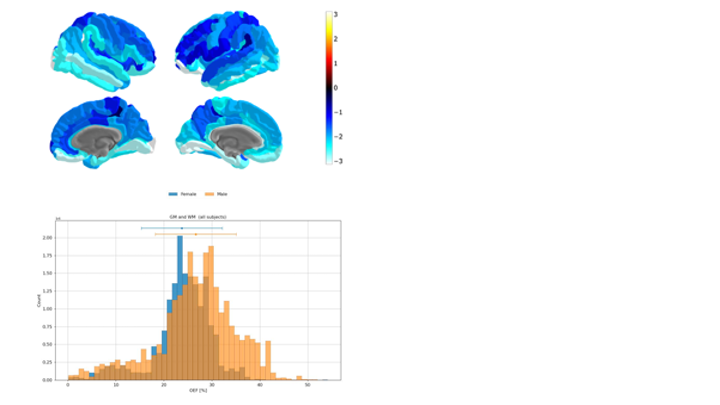
Top: Gender effect in region-specific OEF using lifestyle as a covariate. All ROIs have significant (p<0.05) before multiple comparison correction (100 retain significance after multiple comparison correction). Corpus callosum, pallidum, caudate, thalamus and nucleus accumbens showed the largest gender-related differences. Negative correlation shows male>female. Bottom: Histograms of whole-brain, whole-cohort OEF distribution, illustrating gender differences in the mean values (26.64 +- 8.4 % males, 23.72 +- 6.6 % females) as well as histogram shape.