1302
Epigenetic age acceleration predicts subject-specific white matter degeneration in the human brain.1Radiology and Medical Imaging, University of Virginia, Charlottesville, VA, United States, 2Department of Psychology, University of Virginia, Charlottesville, VA, United States, 3Department of Psychology, Univeristy of Southern California, Los Angeles, CA, United States, 4Duke Molecular Physiology Institute, Duke University, Durham, NC, United States, 5Department of Neurology, Duke University, Durham, NC, United States
Synopsis
Keywords: Neurodegeneration, Neurodegeneration
Epigenetic clocks provide powerful tools for estimating health and lifespan but their ability to predict brain degeneration and neuronal damage during the aging process is unknown. This study uses the epigenetic clock GrimAge to longitudinally investigate brain cellular microstructure in axonal white matter from a healthy aging cohort. We reconstructed subject-specific axonal networks damaged by white matter hyperintensities, a visible neurological manifestation of small vessel disease. A chronological age-adjusted version of GrimAge was significantly correlated with longitudinal markers of neuronal decline. This study is the first to establish a relationship between accelerated epigenetic GrimAge and brain cellular microstructure in humans.Introduction
GrimAge is an epigenetic clock that calculates expected time-to-death due to all-cause mortality based on a number of surrogate DNA methylation based biomarkers of stress and physiological risk1. AgeAccelGrim is an age-adjusted version of GrimAge shown to be highly predictive of time-to-coronary heart disease, congestive heart failure, hypertension, type 2 diabetes, and physical functioning1. It is well established that cardiovascular health affects brain integrity and cognitive functioning2–4 and has been implicated in the formation of white matter hyperintensities (WMH). WHM are thought to be the consequence of small vessel disease (SVD) which can cause microinfarcts, edema, and cortical thinning5–7. In this study, we pair AgeAccelGrim with an advanced diffusion microstructure analysis technique, 3-Tissue Constrained Spherical Deconvolution (3T-CSD), in a subject-specific manner to test associations between AgeAccelGrim and brain cellular microstructure. Analyses were focused on WMH due to their connection to SVD, as well as on the ability of AgeAccelGrim to predict future neuronal decline in an aging cohort.Methods
98 subjects were recruited for baseline neuroimaging with an age range between 58-81 (mean = 68 ± 5.67 SD, 68 female) years old. 41 subjects were successfully recruited for follow-up scans 2 years later with an age range of 61-81 (mean = 69 ± 5.00 SD, 25 female) years old.All subjects were scanned at the University of Virginia using a Siemens Prisma 3T MRI. T1-weighted images were acquired using the ADNI3 designed MPRAGE sequence8 with an isotropic voxel size 1.0×1.0×1.0mm3, TE=2980ms and TR=2300ms. Diffusion-weighted images were acquired with an isotropic voxel size of 1.7×1.7×1.7mm3, TE=70ms and TR=2900ms; using a multi-shell protocol, 10 b=0 images and 64 gradient directions were collected at both b=1500s/mm2 and b=3000s/mm2. An identical imaging protocol was used at both baseline and follow-up.
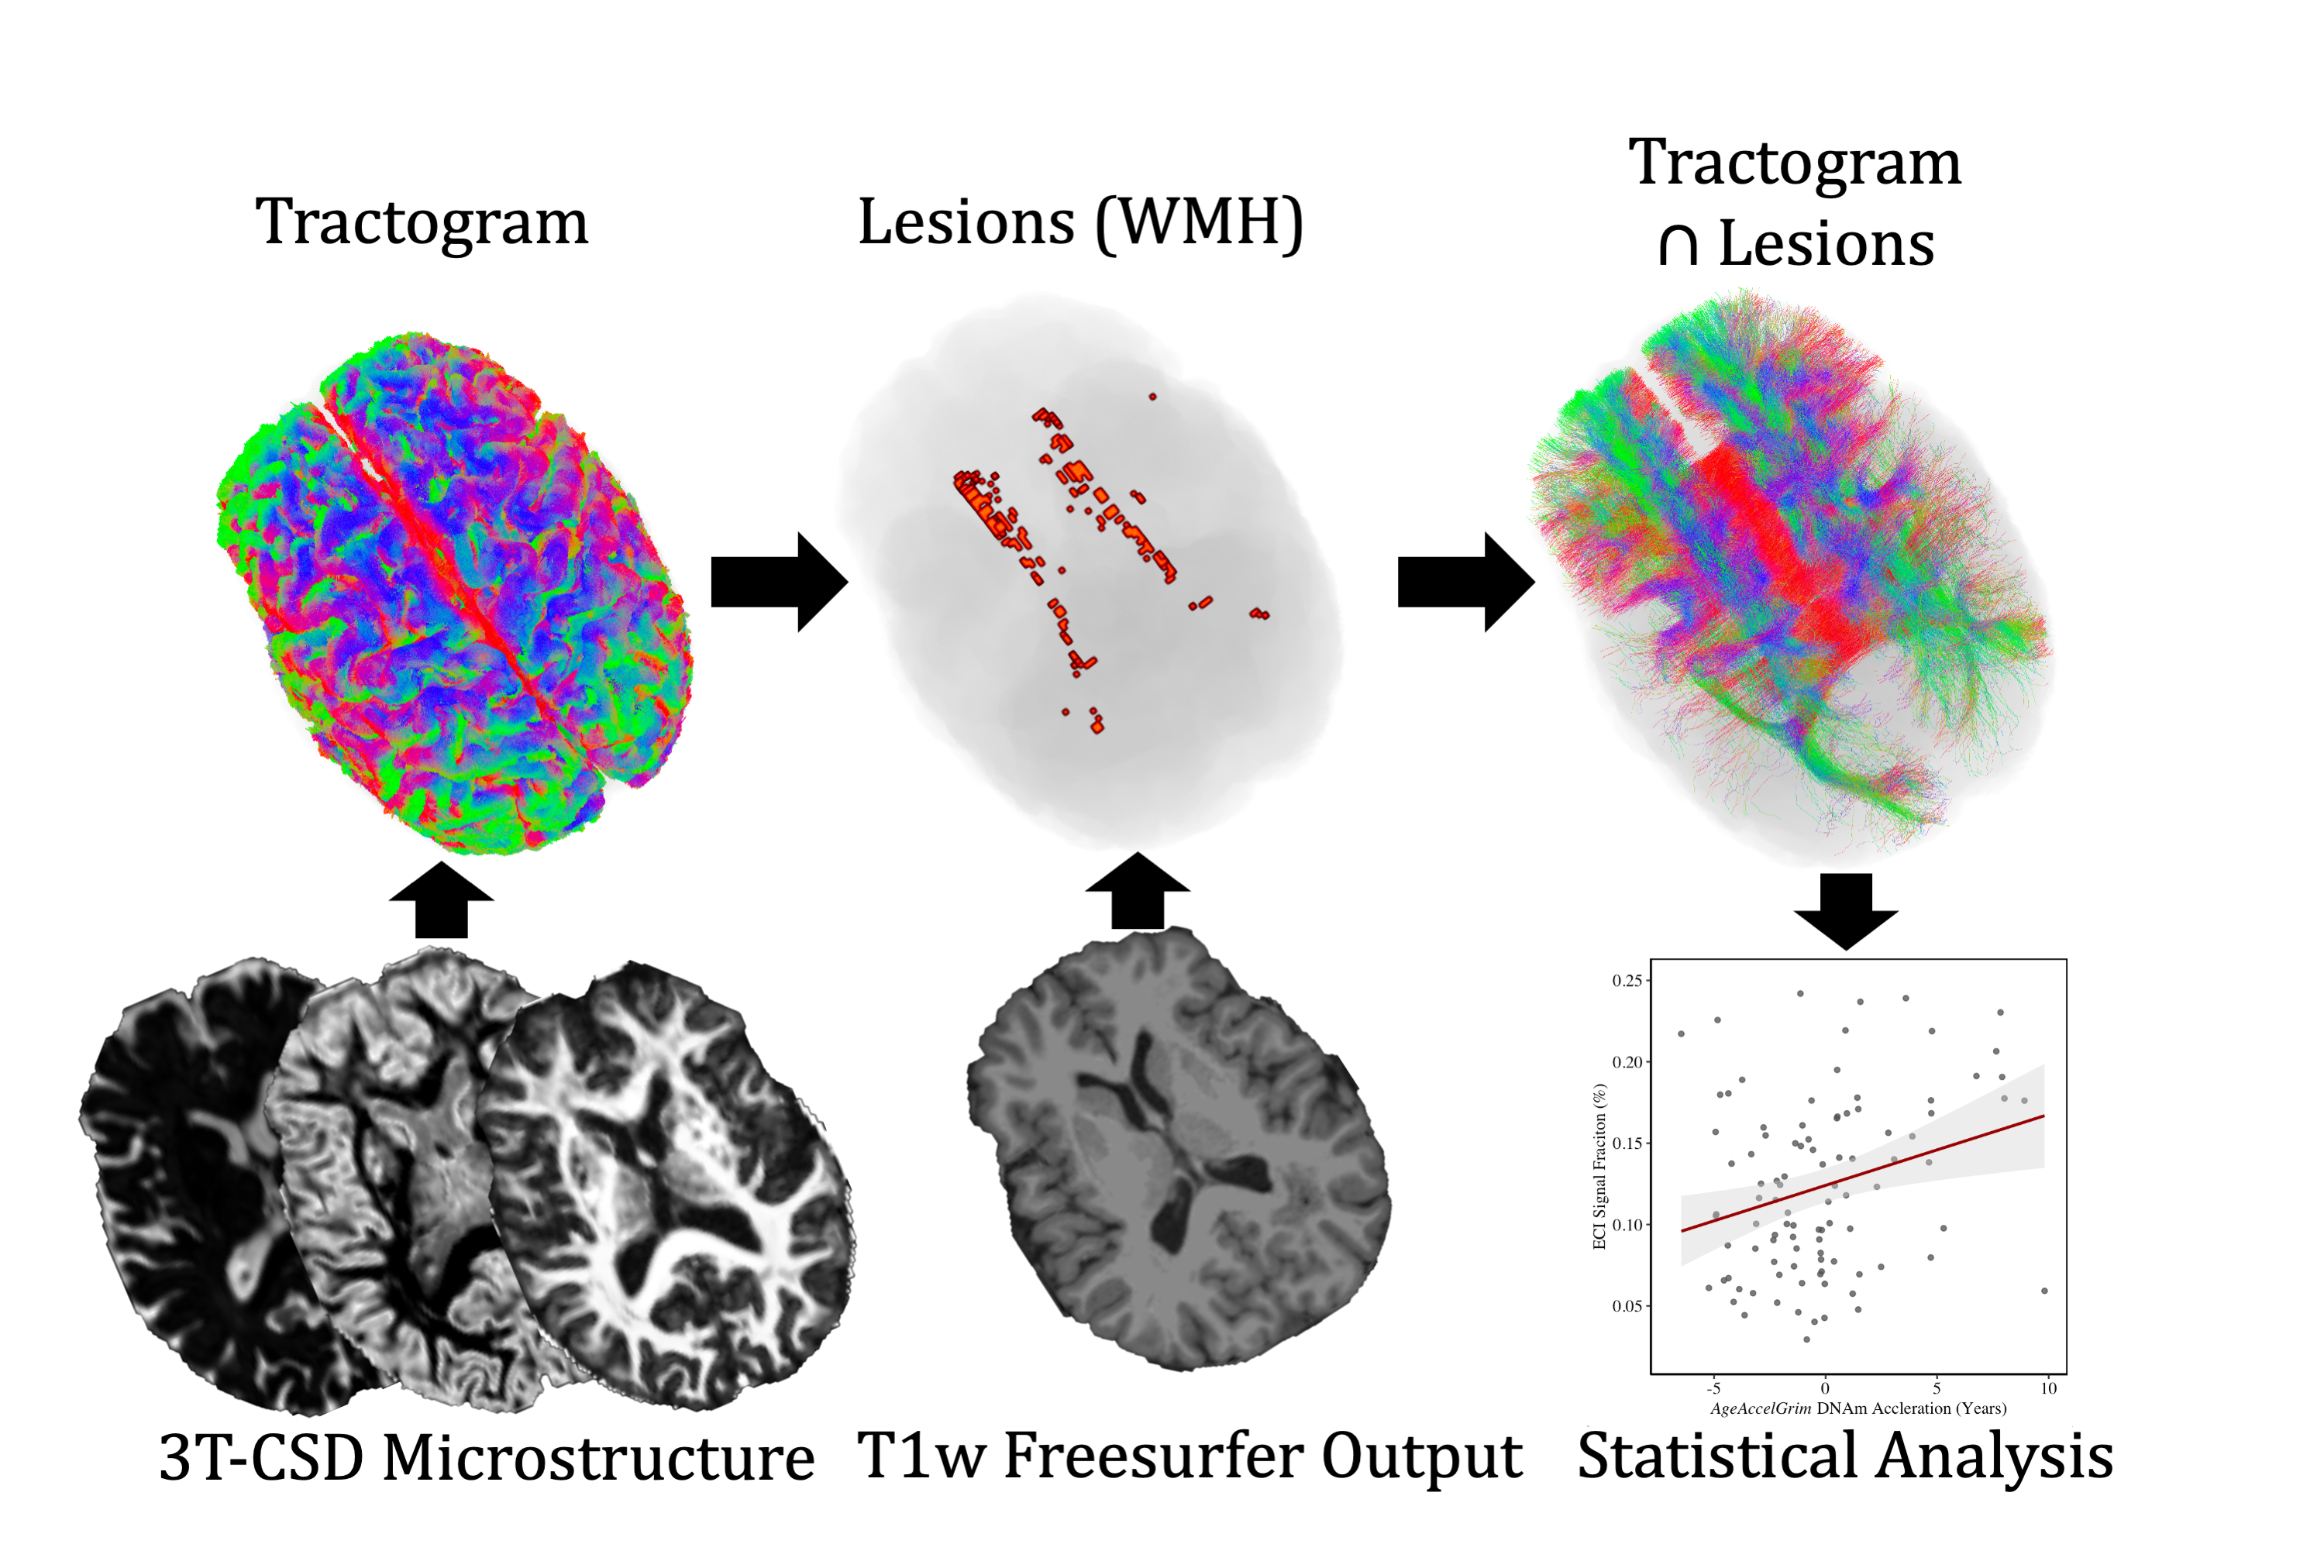
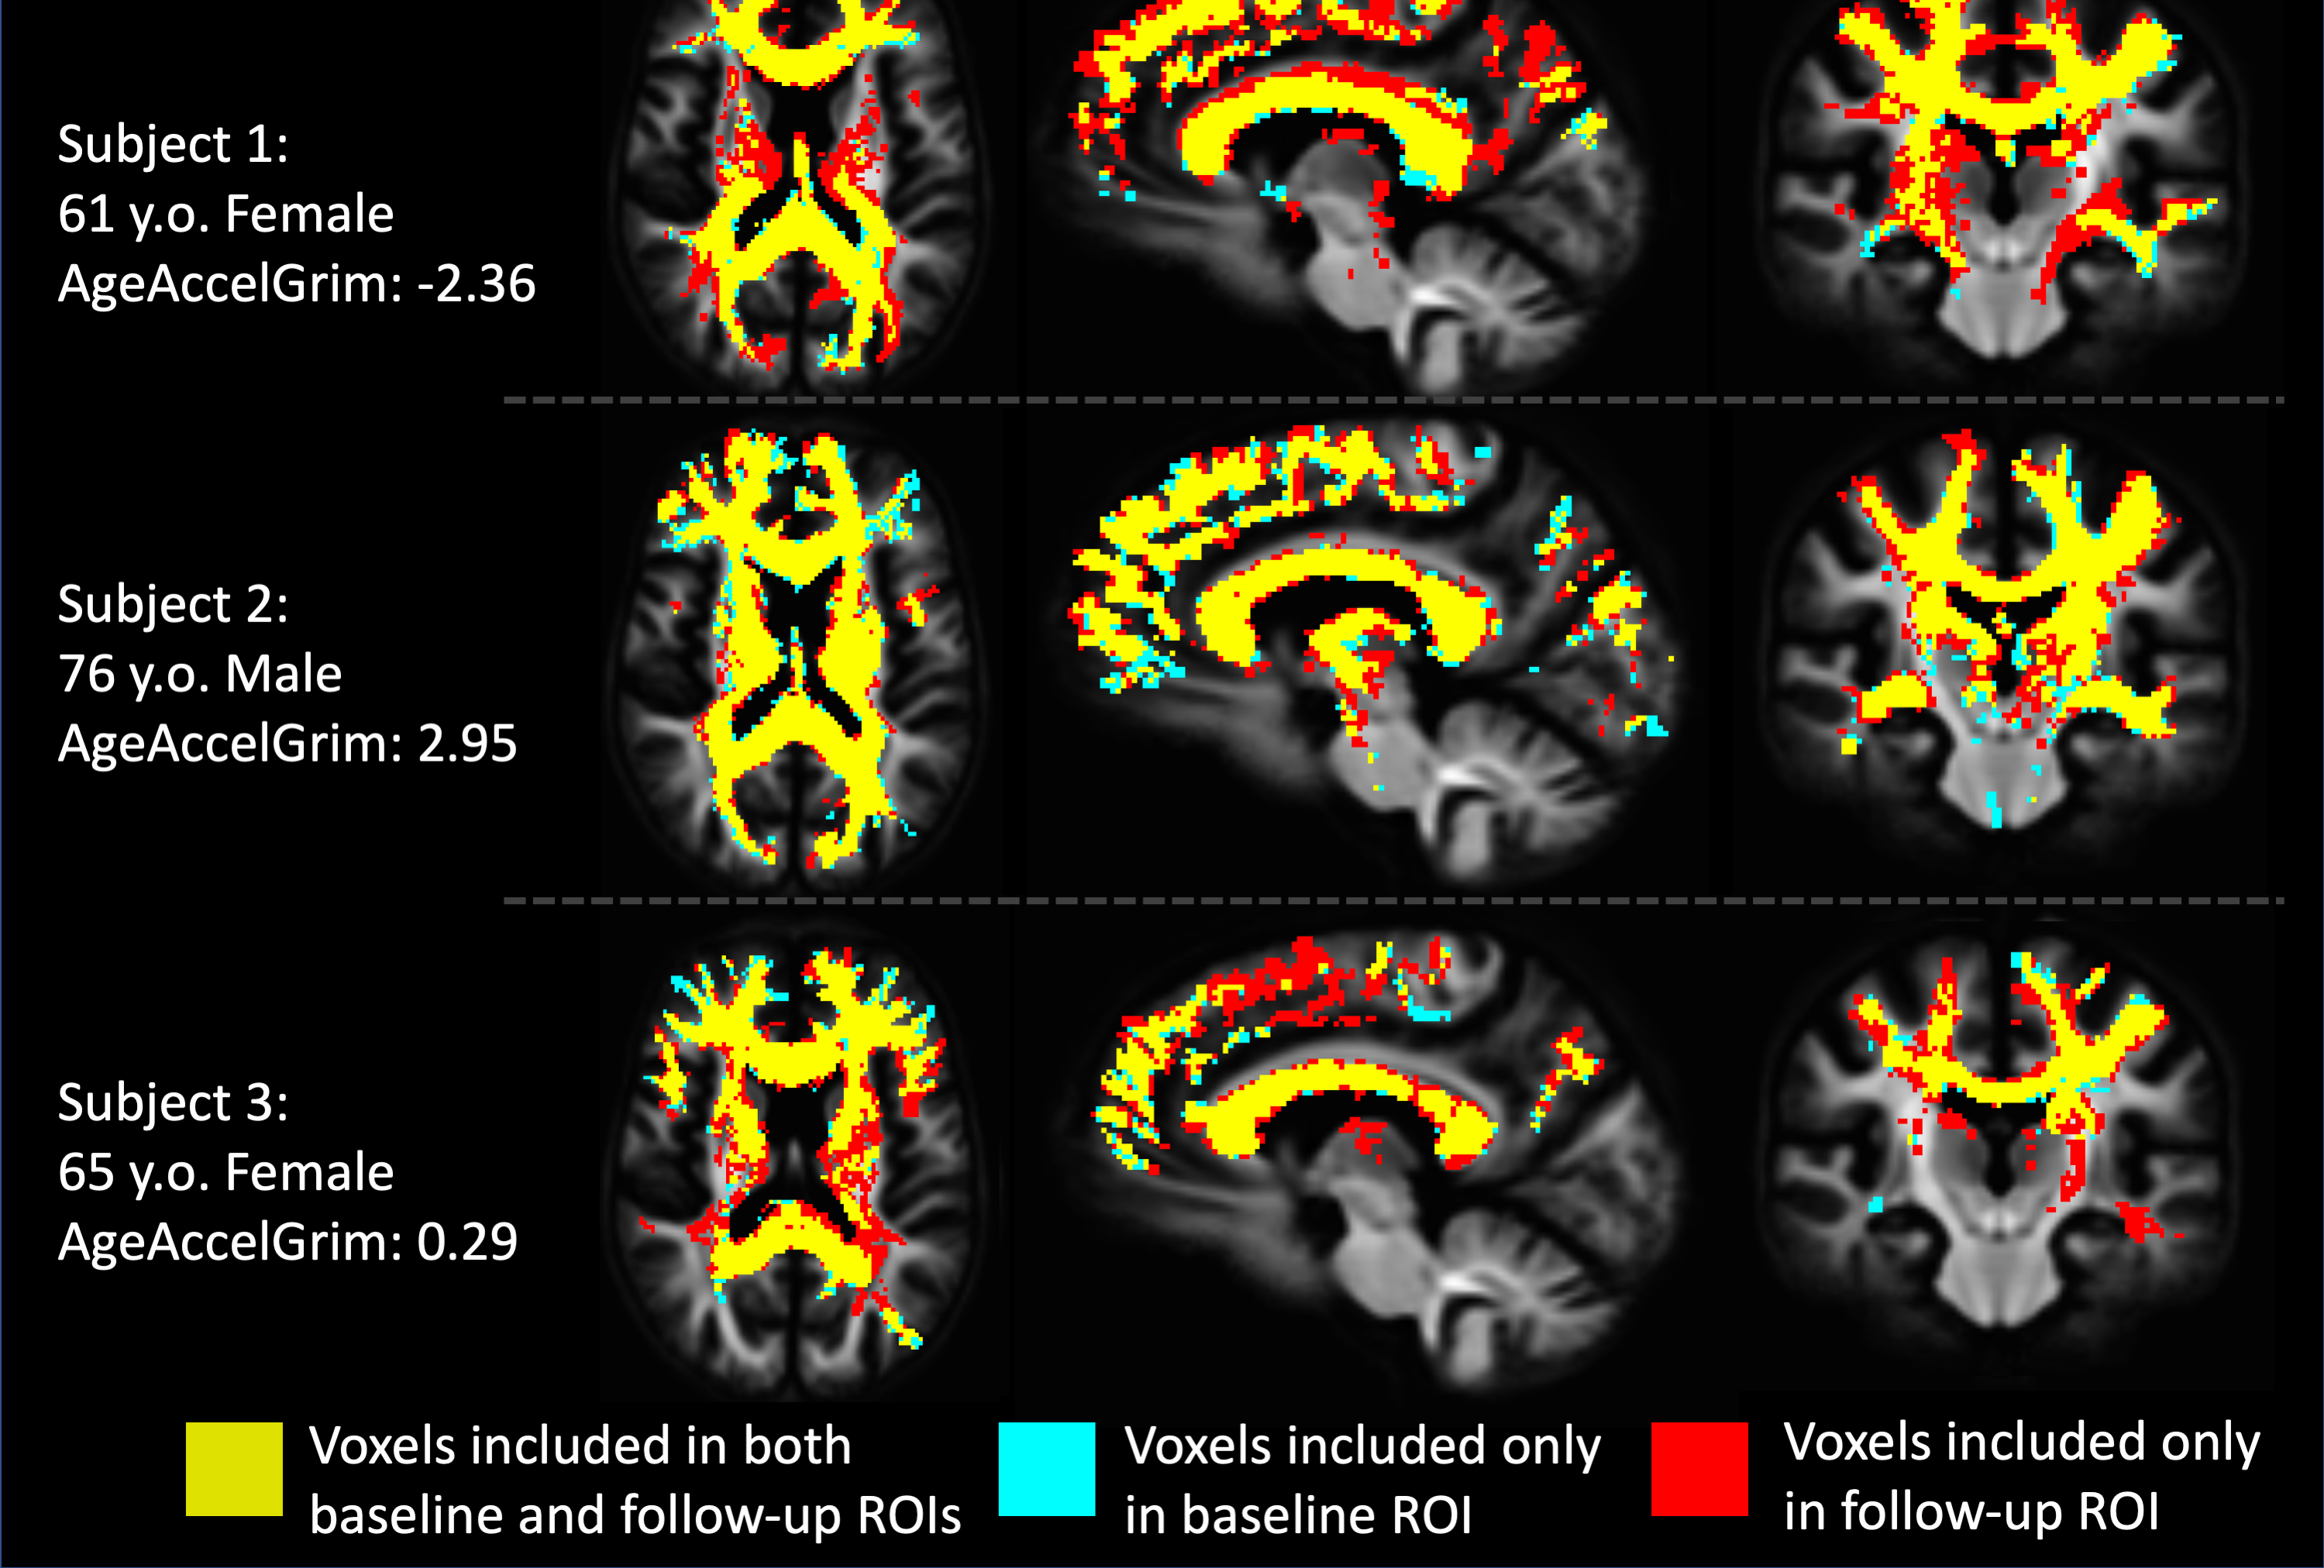
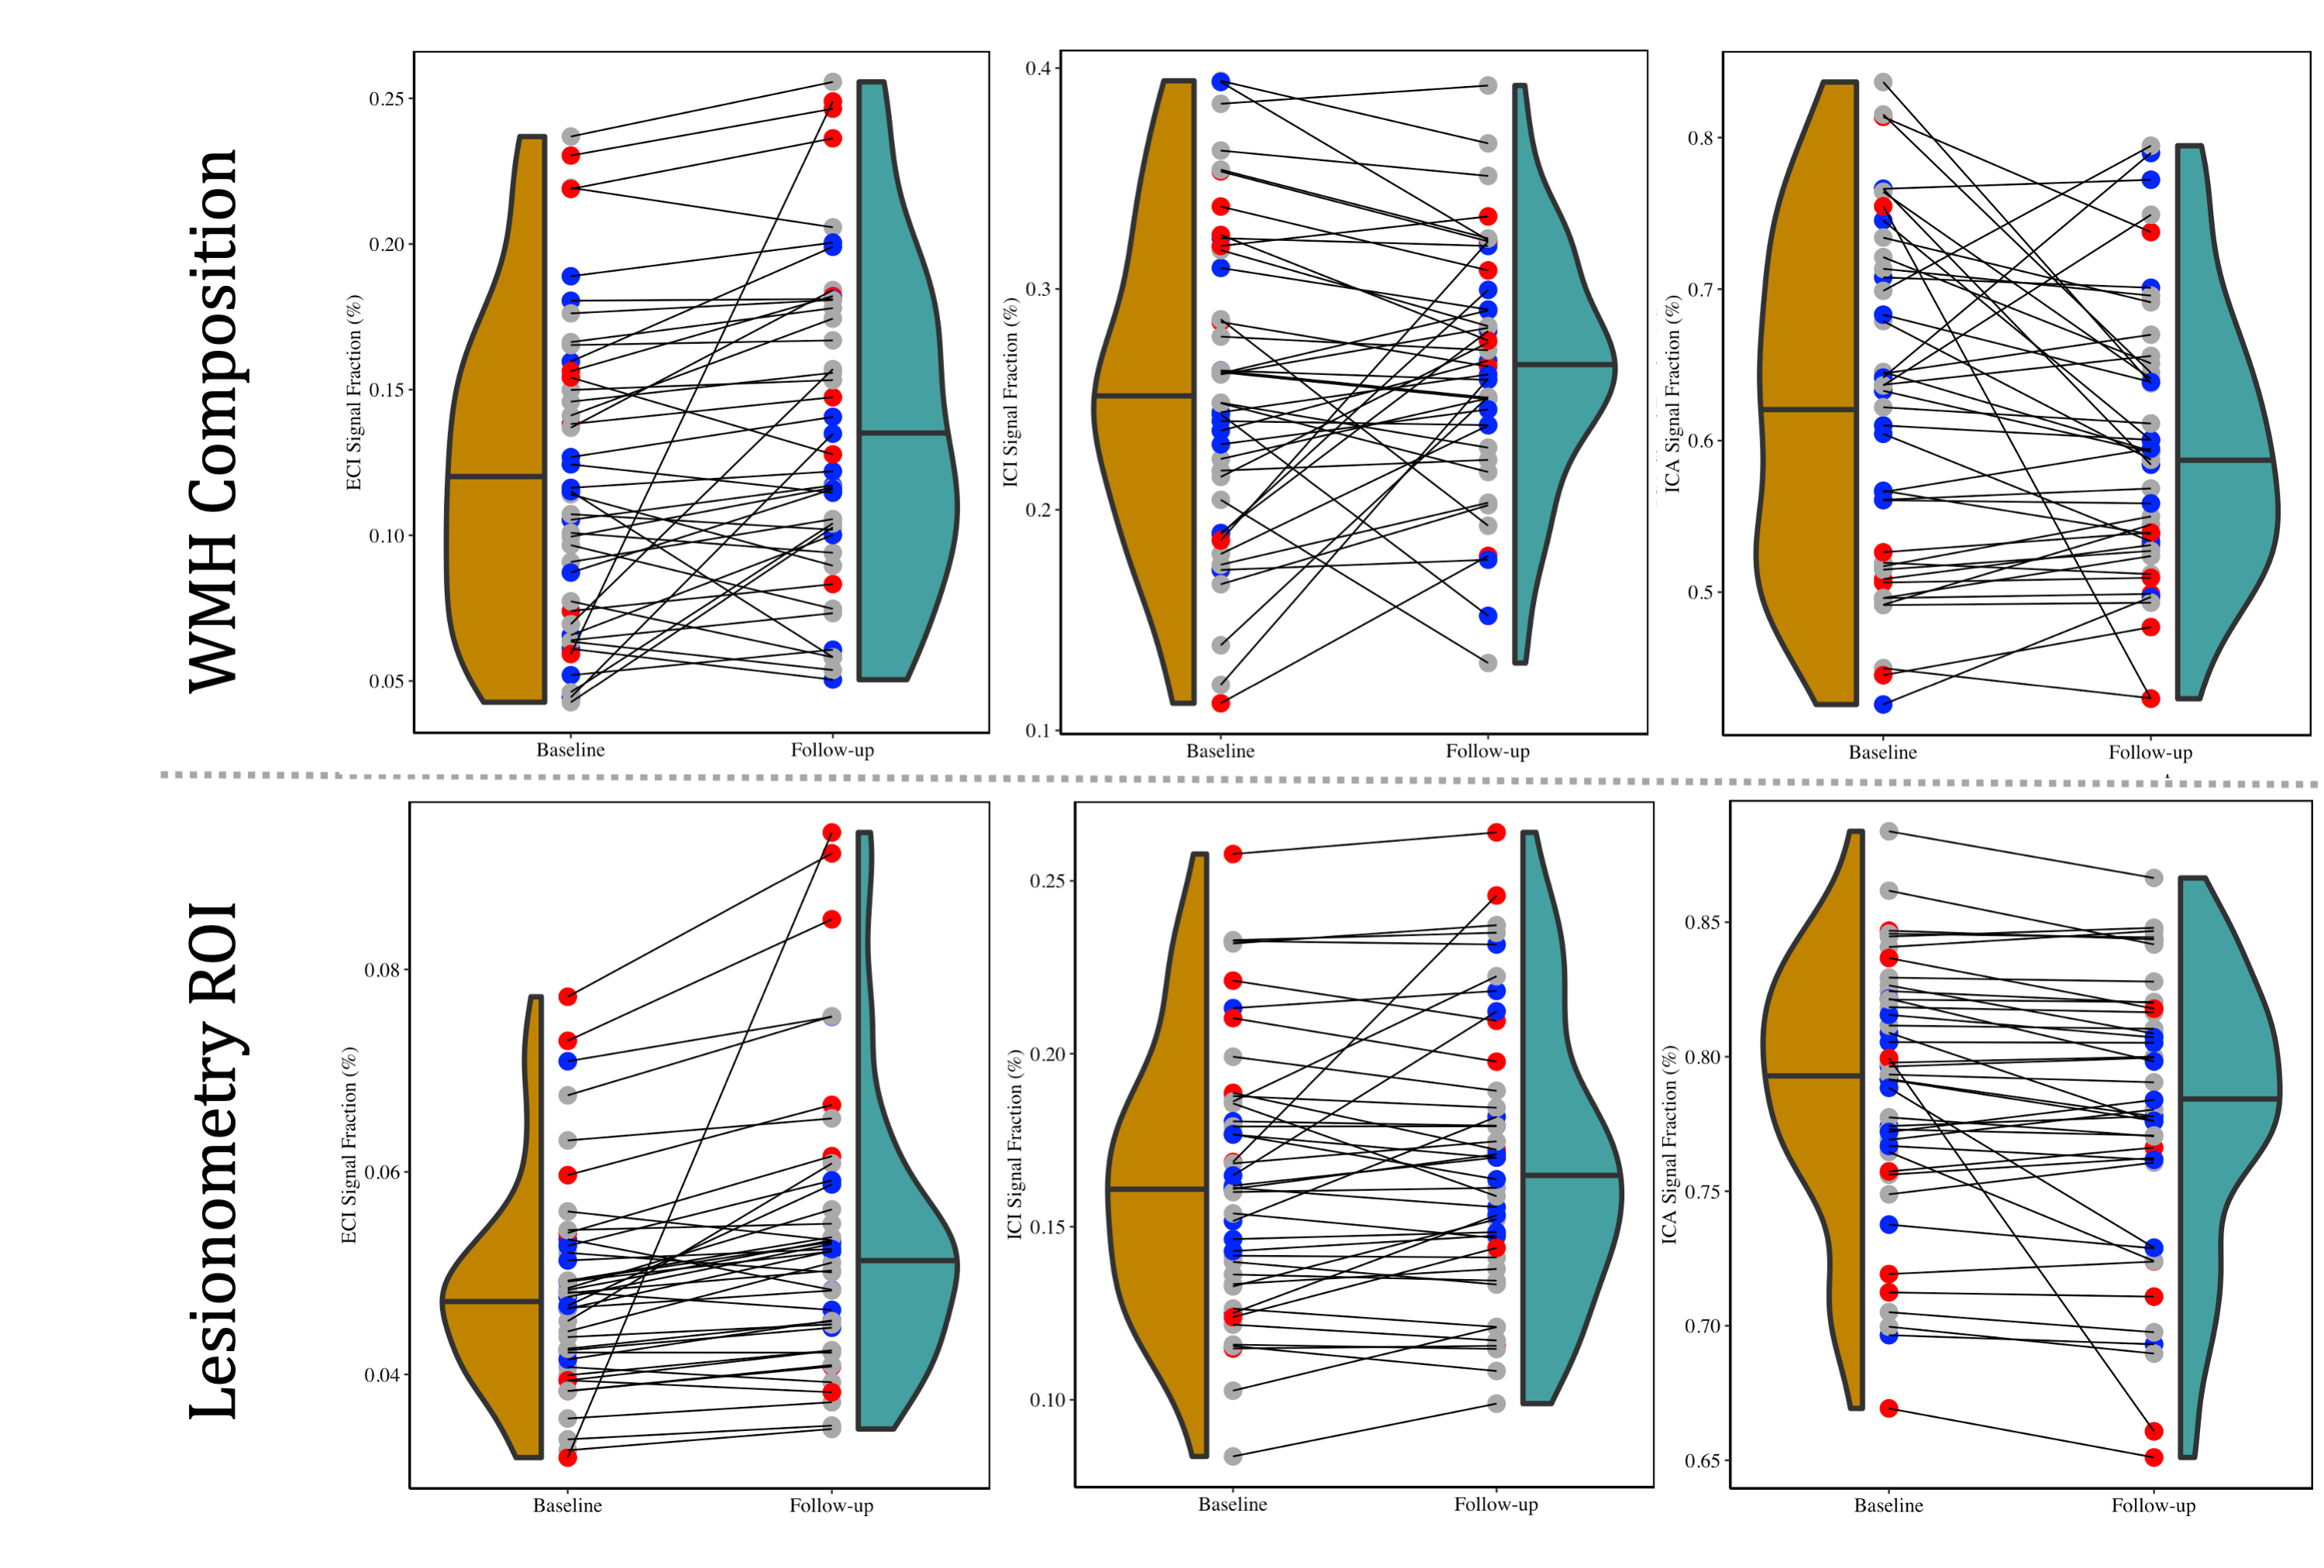
Each diffusion image was analyzed using SS3T-CSD9,10 implemented in the open source software MRtrix and MRtrix3Tissue9,11. Several preprocessing steps utilized FSL12,13. Diffusion images were denoised14, corrected for Gibbs ringing15, susceptibility distortions13, subject motion16, and eddy currents17. WMH identification and skull-stripping was performed and volumetric data gathered using Freesurfer18. All images were upsampled to 1.3⨉1.3⨉1.3mm. 3T-CSD is a voxel-wise quantitative method that measures cellular microstructure within each voxel fitting into intracellular anisotropic (ICA, WM-like), intracellular isotropic (ICI, GM-like), and extracellular isotropic (ECI, CSF-like/Free Water) compartments19. Probabilistic tractography with iFOD220 was then filtered using SIFT to an identical number of total tracts per subject21. Lesionometry was used to examine the relationship between WMH volume, cellular microstructure composition, and spatial positioning to whole brain structure22,23 (Fig. 1). This method examines microstructural metrics within voxels traversed by WM fiber bundles, and theoretically the axons they model, that also traverse WMH (for individual examples see Fig. 2). These formed subject-specific regions of interest
For epigenetic analysis blood was drawn at the baseline visit and DNA was assayed using the Illumina Infinium MethylationEPIC BeadChip. The R packages minfi and shinyMethyl were used for background subtraction, dye-bias normalization, removal of missing values, quality control, and to check for batch effects24–28. All samples passed Illumina quality controls29. Unnormalized betas were filtered and uploaded to Horvath’s online DNA methylation age calculator (htpps://dnamage.genetics.ucla.edu), which provides measures of DNA methylation GrimAge1. AgeAccelGrim was calculated by regression of GrimAge onto subject age.
For all imaging results unless otherwise noted, chronological age at scan acquisition, sex, and a volumetric component of either the whole brain or the subject- and scan-specific ROI/WMH were used as covariates in general linear models.
Results
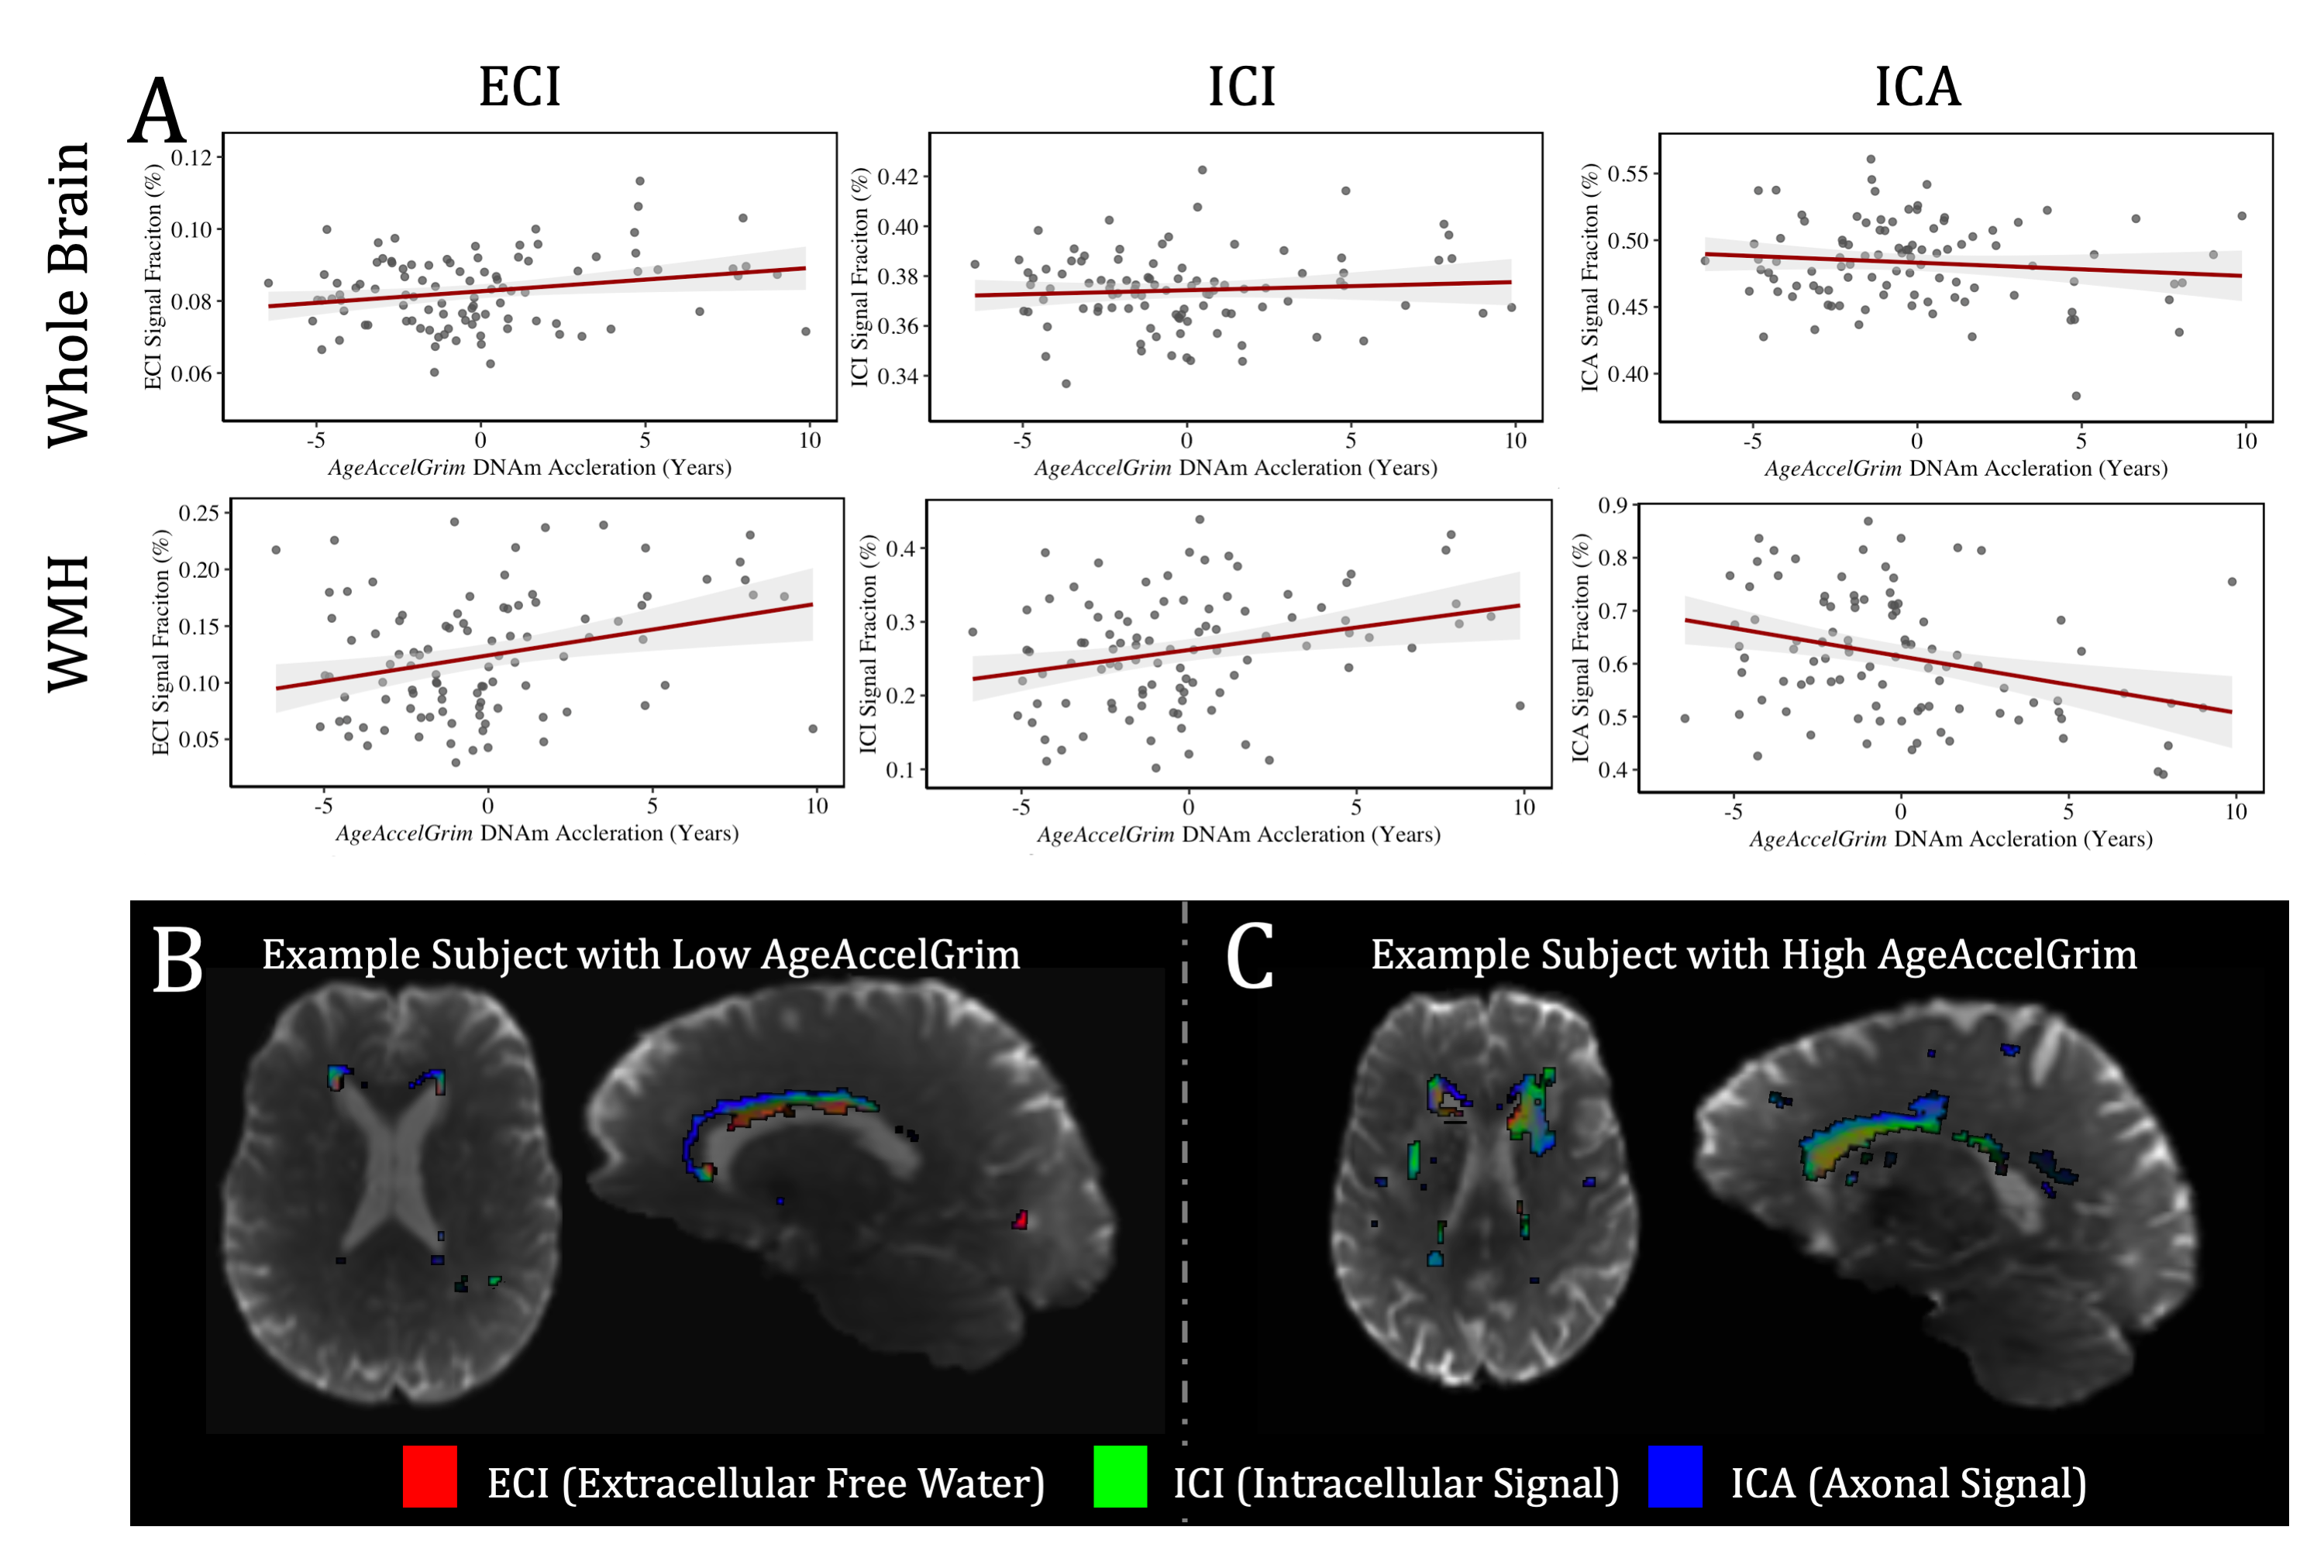
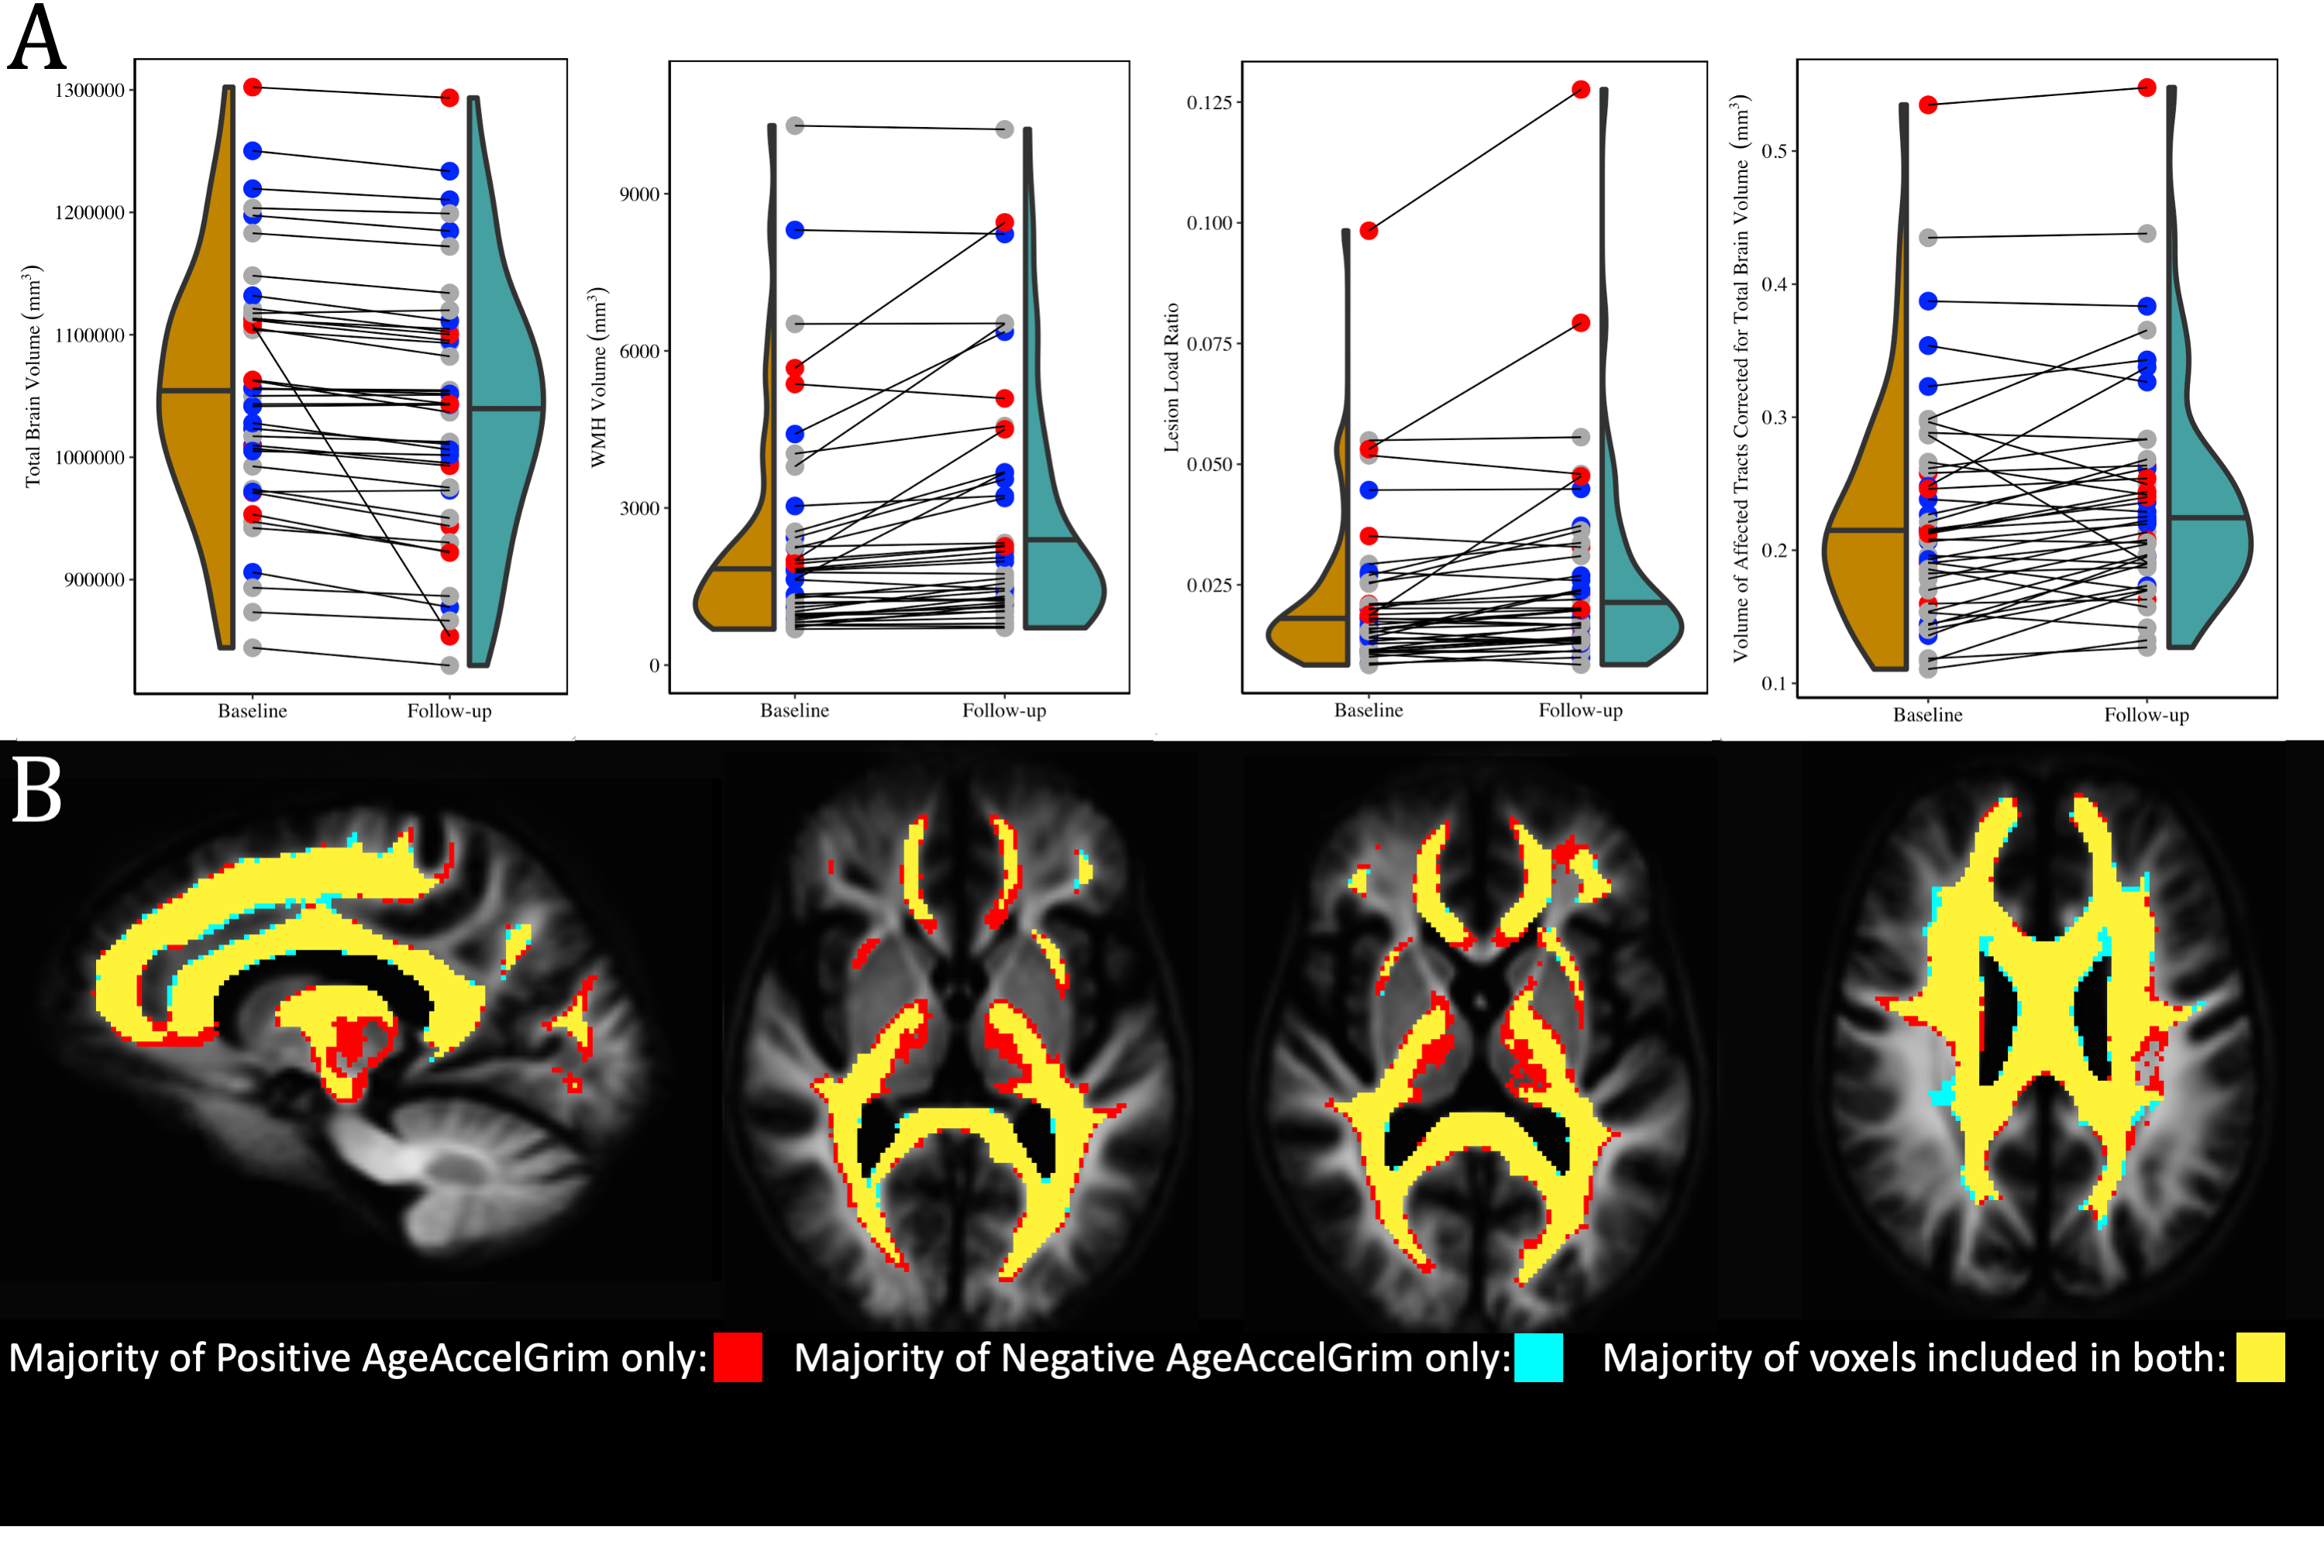
At baseline AgeAccelGrim was not significantly correlated with microstructural measurements across the whole brain, but was significantly positively related to WMH volume (T5,93=2.931, p<0.01), and WMH composition ((ECI: T6,92=2.844, p<0.01; ICI: T6,92=2.741, p<0.01; ICA: T6,92=-3.140, p<0.01) (Fig. 3). Longitudinally however AgeAccelGrim was not significantly predictive of changes in any whole brain or WMH volume (Fig. 4a) or microstructural measurements (Fig. 5a).The microstructure measurements taken from the lesionometry ROIs however, were able to be predicted by AgeAccelGrim both cross-sectionally at baseline and longitudinally. At baseline AgeAccelGrim was significantly correlated to microstructure in the lesionometric ROI (ECI: T5,93=2.586, p<0.05; ICI: T5,93=2.073, p<0.05; ICA: T5,93=-2.299, p<0.05; Fig. 5b). Longitudinally AgeAccelGrim was able to significantly predict the change in microstructural measurements in the lesionometry ROI (ECI: F1,36=11.11, p<0.01; ICI: F1,36=4.352, p<0.05; ICA: F1,36=6.243, p<0.05; Fig. 5b). Finally, AgeAccelGrim had a positive relationship with lesion load, a ratio between the volume of each subject’s WMH and the volume of the lesionometry ROI (which does not include the WMH) at baseline (T5,93=4.245, p<0.001) and longitudinally (F1,36=5.397, p<0.05) (Fig. 4).
Discussion
By examining markers of SVD using advanced measures of diffusion microstructure in a subject-specific lesionometry approach, this study has established a connection between a blood-based measure of mortality risk and neuronal damage. Specifically, AgeAccelGrim was associated with higher WMH ECI or extracellular free water signal fraction, higher ICI signal fraction, and lower ICA or axonal signal fraction. This study has provided evidence that a blood-based epigenetic marker of age acceleration can predict the degenerative effects of SVD in the brain. AgeAccelGrim was able to predict the volume and composition of WMH as well as widespread diffusion microstructure signatures of neuronal decline in a subject-specific manner.Acknowledgements
No acknowledgement found.References
1. Lu AT, Quach A, Wilson JG, et al. DNA methylation GrimAge strongly predicts lifespan and healthspan. Aging (Albany NY). 2019;11(2):303.
2. Felder RB, Francis J, Zhang ZH, Wei SG, Weiss RM, Johnson AK. Heart failure and the brain: new perspectives. American Journal of Physiology-Regulatory, Integrative and Comparative Physiology. 2003;284(2):R259-R276.
3. Hillman CH, Erickson KI, Kramer AF. Be smart, exercise your heart: exercise effects on brain and cognition. Nature reviews neuroscience. 2008;9(1):58-65.
4. Jefferson AL, Himali JJ, Beiser AS, et al. Cardiac index is associated with brain aging: the Framingham Heart Study. Circulation. 2010;122(7):690-697.
5. Finsterwalder S, Vlegels N, Gesierich B, et al. Small vessel disease more than Alzheimer’s disease determines diffusion MRI alterations in memory clinic patients. Alzheimer’s & Dementia. 2020;16(11):1504-1514.
6. Tuladhar AM, van Norden AG, de Laat KF, et al. White matter integrity in small vessel disease is related to cognition. NeuroImage: Clinical. 2015;7:518-524.
7. Wardlaw JM, Smith C, Dichgans M. Small vessel disease: mechanisms and clinical implications. The Lancet Neurology. 2019;18(7):684-696.
8. Gunter J, Thostenson K, Borowski B, et al. ADNI-3 MRI Protocol. Alzheimer’s Dementia. 2017;13(7):P104-P105.
9. Dhollander T, Connelly A. A novel iterative approach to reap the benefits of multi-tissue CSD from just single-shell (+ b= 0) diffusion MRI data. In: Proc ISMRM. Vol 24. ; 2016:3010.
10. Jeurissen B, Tournier JD, Dhollander T, Connelly A, Sijbers J. Multi-tissue constrained spherical deconvolution for improved analysis of multi-shell diffusion MRI data. NeuroImage. 2014;103:411-426. doi:10.1016/j.neuroimage.2014.07.061
11. Tournier JD, Smith R, Raffelt D, et al. MRtrix3: A fast, flexible and open software framework for medical image processing and visualisation. NeuroImage. 2019;202:116137.
12. Jenkinson M, Beckmann CF, Behrens TE, Woolrich MW, Smith SM. Fsl. Neuroimage. 2012;62(2):782-790.
13. Smith SM, Jenkinson M, Woolrich MW, et al. Advances in functional and structural MR image analysis and implementation as FSL. Neuroimage. 2004;23:S208-S219.
14. Veraart J, Fieremans E, Novikov DS. Diffusion MRI noise mapping using random matrix theory. Magnetic resonance in medicine. 2016;76(5):1582-1593.
15. Kellner E, Dhital B, Kiselev VG, Reisert M. Gibbs‐ringing artifact removal based on local subvoxel‐shifts. Magnetic resonance in medicine. 2016;76(5):1574-1581.
16. Andersson JL, Graham MS, Zsoldos E, Sotiropoulos SN. Incorporating outlier detection and replacement into a non-parametric framework for movement and distortion correction of diffusion MR images. Neuroimage. 2016;141:556-572.
17. Andersson JL, Sotiropoulos SN. An integrated approach to correction for off-resonance effects and subject movement in diffusion MR imaging. Neuroimage. 2016;125:1063-1078.
18. Fischl B. FreeSurfer. Neuroimage. 2012;62(2):774-781.
19. Newman BT, Dhollander T, Reynier KA, Panzer MB, Druzgal TJ. Test–retest reliability and long‐term stability of three‐tissue constrained spherical deconvolution methods for analyzing diffusion MRI data. Magn Reson Med. 2020;84(4):2161-2173. doi:10.1002/mrm.28242
20. Tournier JD, Calamante F, Connelly A. Improved probabilistic streamlines tractography by 2nd order integration over fibre orientation distributions. In: Proceedings of the International Society for Magnetic Resonance in Medicine. Vol 1670. John Wiley & Sons, Inc. New Jersey, USA; 2010.
21. Smith RE, Tournier JD, Calamante F, Connelly A. SIFT: Spherical-deconvolution informed filtering of tractograms. Neuroimage. 2013;67:298-312.
22. Chamberland M, Winter M, Brice TA, Jones DK, Tallantyre EC. Beyond lesion-load: tractometry-based metrics for characterizing white matter lesions within fibre pathways. Published online 2020.
23. Winter M, Tallantyre EC, Brice TA, Robertson NP, Jones DK, Chamberland M. Tract-specific MRI measures explain learning and recall differences in multiple sclerosis. Brain Communications. 2021;3(2):fcab065.
24. Aryee MJ, Jaffe AE, Corrada-Bravo H, et al. Minfi: a flexible and comprehensive Bioconductor package for the analysis of Infinium DNA methylation microarrays. Bioinformatics. 2014;30(10):1363-1369.
25. Fortin JP, Fertig E, Hansen K. shinyMethyl: interactive quality control of Illumina 450k DNA methylation arrays in R. F1000Research. 2014;3.
26. Fortin JP, Triche Jr TJ, Hansen KD. Preprocessing, normalization and integration of the Illumina HumanMethylationEPIC array with minfi. Bioinformatics. 2017;33(4):558-560.
27. Houseman EA, Accomando WP, Koestler DC, et al. DNA methylation arrays as surrogate measures of cell mixture distribution. BMC bioinformatics. 2012;13(1):1-16.
28. Jaffe AE, Irizarry RA. Accounting for cellular heterogeneity is critical in epigenome-wide association studies. Genome biology. 2014;15(2):1-9.
29. Heiss JA, Just AC. Identifying mislabeled and contaminated DNA methylation microarray data: an extended quality control toolset with examples from GEO. Clinical epigenetics. 2018;10(1):1-9.
Figures