1301
Brain Age Prediction Based on Quantitative Susceptibility Mapping1School of Biomedical Engineering, Shanghai Jiao Tong University, Shanghai, China, 2School of Information and Science and Technology, ShanghaiTech University, Shanghai, China
Synopsis
Keywords: Neurodegeneration, Quantitative Susceptibility mapping
The aging process of the human brain is known to be complex, resulting in considerable structural and functional changes in the brain. In this study, a brain age prediction method based on QSM was proposed and then applied to predict the brain age of PD patients. The model achieved a high prediction accuracy with the MAE of 4.40 years and the R2 of 0.91 in healthy subjects. The PADs of the PD patients were significantly higher than HC subjects. The results show that brain age prediction based on QSM can provide a new biomarker to explore iron-related brain age changes.
Introduction
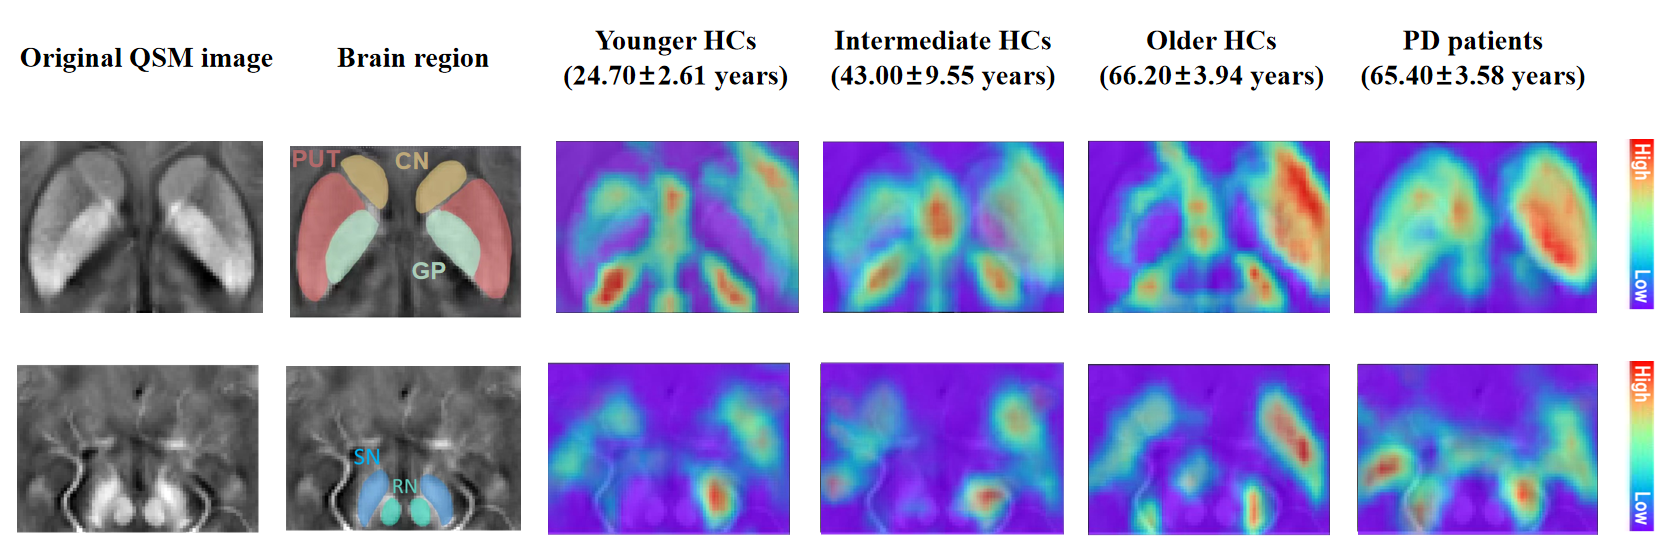
It is well known that the aging process of the human brain is biologically complex, with neurological and physiological changes in brain structure and function. These age-related changes are associated with the increased risk of experiencing advanced brain aging and neurodegenerative disease, e.g., Parkinson’s disease and Alzheimer’s disease. The aging effects on the brain can be measured via brain age prediction, which builds on the relationship between age and neuroanatomy across ages. One promising approach in brain age prediction is the application of machine learning methods to neuroimaging data 1,2,3. The current field of deep learning-based brain age prediction mostly utilizes magnetic resonance structural images (e.g., T1-weighted images, T1WIs) as input, making the network extract relatively limited features. Quantitative susceptibility mapping (QSM) is an emerging MRI technique that quantifies the distribution of tissue magnetic susceptibility in the brain. QSM is sensitive to changes in the content of magnetically sensitive substances such as iron, calcium, and myelin. Previous studies have demonstrated that QSM can provide a quantitative characterization of the evolution of iron deposition during brain development and aging 4,5. Thus, QSM is a favorable tool for brain age prediction, providing more insight into the potential abnormalities of magnetic susceptibility that arise from various neurological diseases related to aging.Methods
In this study, we proposed a regression deep learning framework based on the ResNet framework 6, which added Squeeze and Extraction (SE) modules 7 and residual attention modules 8. We tested the hypothesis that both tissue magnetic susceptibility-related and structural features help accurate age prediction. First, the models were trained and tested using QSM data and T1WIs of 714 healthy subjects, respectively. Second, the QSM-based model was applied to 58 Parkinson's disease (PD) data to assess the difference between the predicted age and the chronological age, termed predicted age difference (PAD). Finally, in order to investigate the potential applications of PAD, we used the support vector machine (SVM) with the PAD as the input for distinguishing the pathological group from the healthy control (HC) group.Results
The results demonstrate that the method based on QSM has achieved a high accuracy with the mean absolute error (MAE) of 4.40 years and the coefficient of determination (R2) of 0.91. It is also shown that QSM has a smaller PAD prediction than T1WI. The MAE and R2 are 6.77 years and 0.58 for PD patients, while 4.19 years and 0.51 for HC subjects. Compared with the HC group, the PD subjects show significantly higher PADs (p<0.01). The classification area under curve (AUC), accuracy (ACC), sensitivity (SEN) and specificity (SPE) in PD/HC are 0.89, 0.83, 0.90 and 0.77.Discussion
Compared with conventional structural MR images, QSM is a novel tool to quantify the iron content in the human brain. Based on QSM, PAD could be used as a biomarker to measure brain health and the degree of pathology, which may be helpful for the clinical diagnosis of diseases and postoperative evaluation. Furthermore, the effect of combining QSM with T1w features as input for brain age prediction is superior to that of only QSM as input. The PAD has the potential to identify differences in patients relative to healthy controls. A higher PAD indicates accelerated brain degeneration and a higher risk of associated brain diseases.Conclusion
Brain age prediction based on QSM has the potential to serve as a biomarker to explore the brain aging process. PAD based on magnetic susceptibility alterations can be used to capture iron-related brain aging and disease deviation and is thought to serve as an important biomarker reflecting pathological processes in the brain.Acknowledgements
This study is supported by the National Natural Science Foundation of China (61901256, 91949120, 62071299).References
1. Cole J H, Leech R, Sharp D J, et al. Prediction of brain age suggests accelerated atrophy after traumatic brain injury. Annals of neurology. 2015; 77(4): 571-581.
2. Cole J H, Poudel R P K, Tsagkrasoulis D, et al. Predicting brain age with deep learning from raw imaging data results in a reliable and heritable biomarker. NeuroImage. 2017; 163: 115-124.
3. Dosenbach N U F, Nardos B, Cohen A L, et al. Prediction of individual brain maturity using fMRI. Science. 2010; 329(5997): 1358-1361.
4. Acosta-Cabronero J, Williams G B, Cardenas-Blanco A, et al. In vivo quantitative susceptibility mapping (QSM) in Alzheimer's disease. PloS one. 2013; 8(11): e81093.
5. Sun H, Klahr A C, Kate M, et al. Quantitative susceptibility mapping for following intracranial hemorrhage. Radiology. 2018; 288(3): 830-839.
6. He K, Zhang X, Ren S, et al. Deep residual learning for image recognition//Proceedings of the IEEE conference on computer vision and pattern recognition. 2016; 770-778.
7. Hu J, Shen L, Sun G. Squeeze-and-excitation networks//Proceedings of the IEEE conference on computer vision and pattern recognition. 2018; 7132-7141.
8. Wang F, Jiang M, Qian C, et al. Residual attention network for image classification//Proceedings of the IEEE conference on computer vision and pattern recognition. 2017; 3156-3164.
Figures
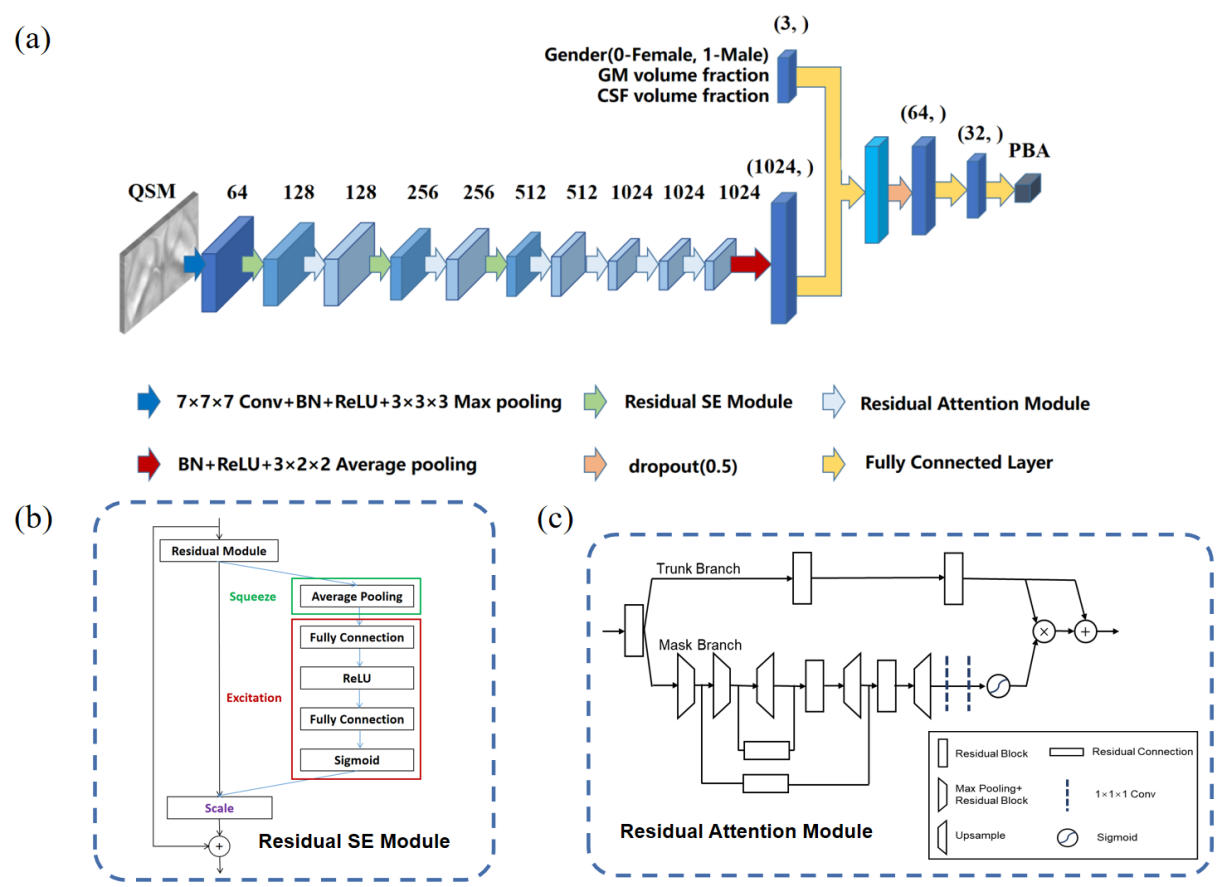
Figure 1 An overview of the network architecture and the detailed illustration of residual modules. (a) The input of the network is the cropped registered QSM image and the output is the predicted brain age. The number over the 3D boxes indicates the number of channels. (b) The detailed illustration of the residual SE module, including squeeze, excitation and scale. (c) The detailed illustration of the residual attention module composed of the trunk branch and the mask branch.
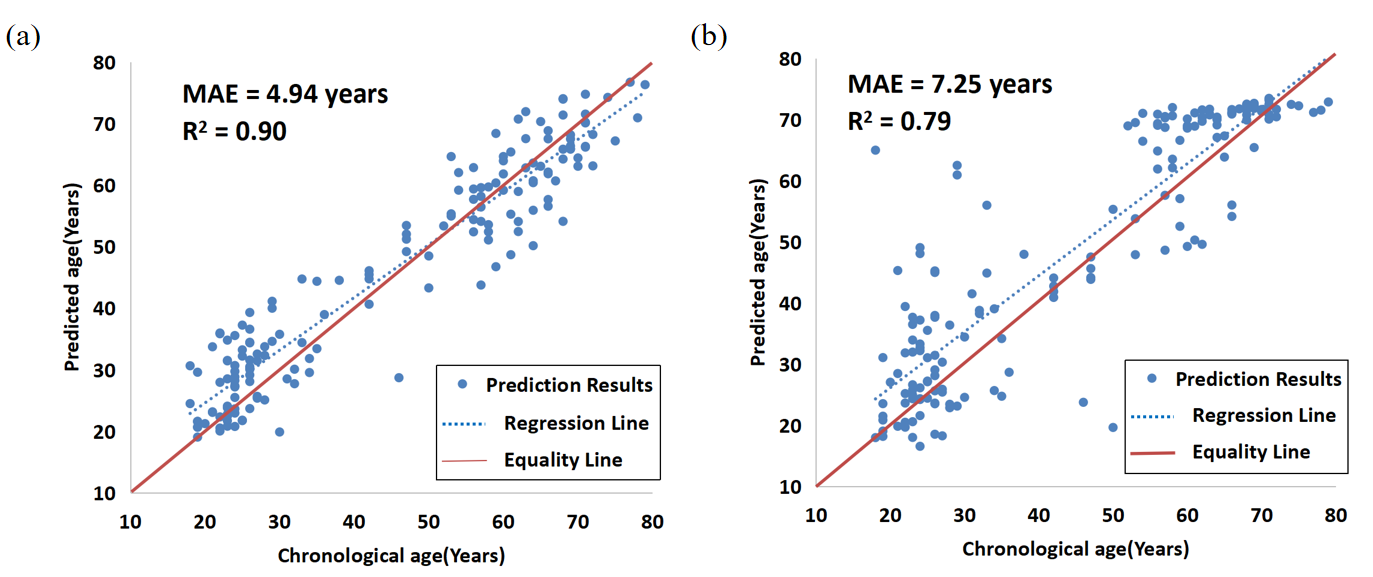
Figure 2 The performance of the proposed network. (a) Correlation between the predicted age and the chronological age on test set (N = 166, male/ female = 80/ 86, age range 18-80 years) with QSM image as input and gender as a covariate. (b) Correlation between the predicted age and the chronological age on the test set (N = 166, male/ female = 80/ 86, age range 18-80 years) with T1WI as input and gender as a covariate.
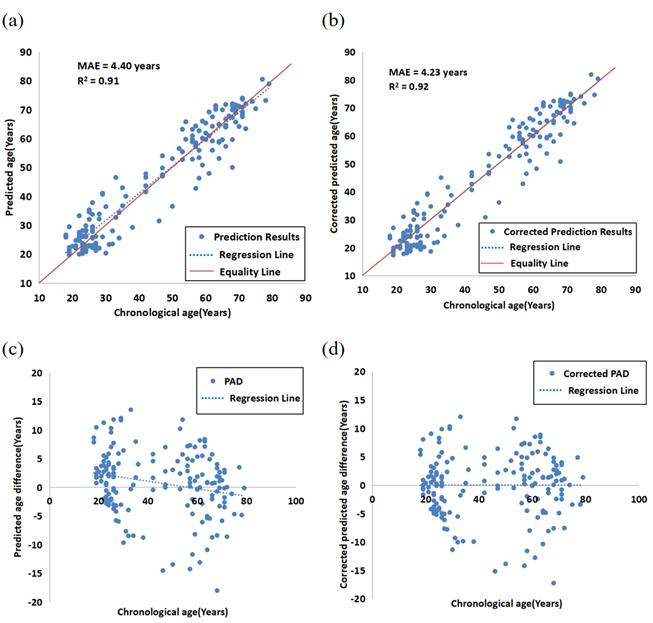
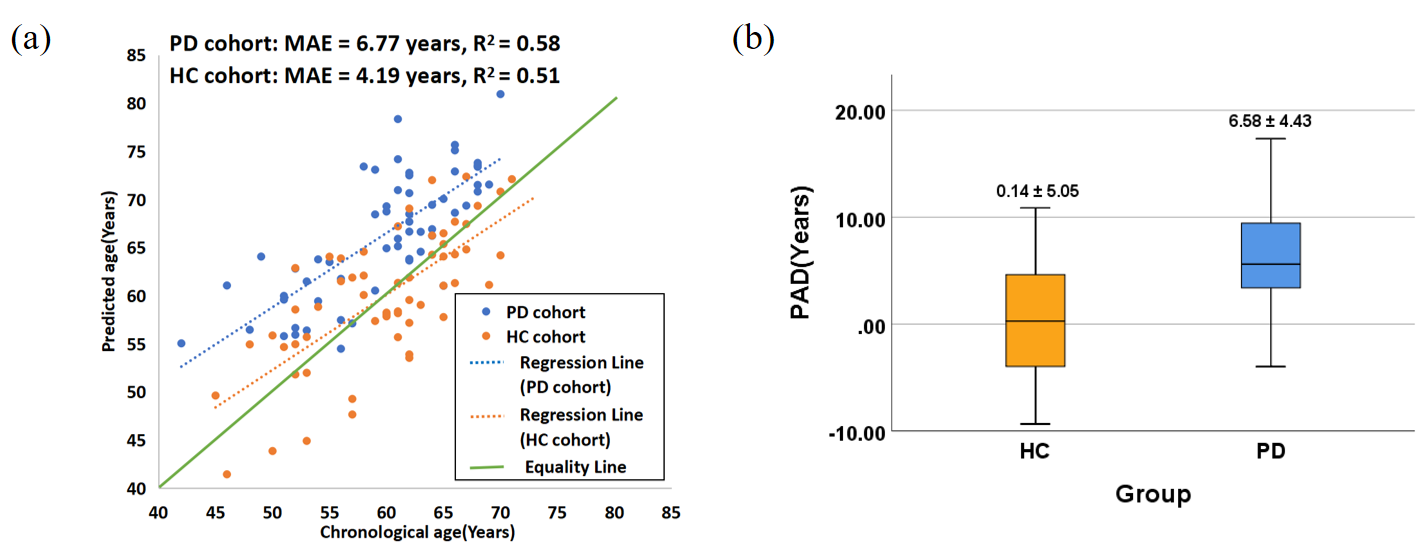
Figure 4 The prediction result of HC group and PD group. (a) The correlation between the predicted age and chronological age of HC subjects and PD patients. The blue dots and dotted line are the prediction results and the regression line of PD patients. The yellow dots and dotted line are the prediction results and the regression line of HC subjects. The green line is the equal line. (b) The comparison of PAD values between HC subjects (yellow box) and PD patients (blue box). The mean PAD value for each group is illustrated with a solid black line in the middle of the box.