1300
Structural network integrity in limbic-predominant age-related TDP-43 encephalopathy neuropathological change (LATE-NC)1Department of Biomedical Engineering, Illinois Institute of Technology, Chicago, IL, United States, 2Rush Alzheimer’s Disease Center, Rush University Medical Center, Chicago, IL, United States
Synopsis
Keywords: Neurodegeneration, White Matter, LATE-NC, TDP-43, neuropathology, aging
Limbic-predominant age-related TDP-43 encephalopathy neuropathological change (LATE-NC) is a common pathological finding in the brain of older adults, but its impact on structural network integrity remains unknown. In this work, we studied structural connectivity network abnormalities associated with LATE-NC using graph theory. Our results demonstrated that severity of LATE-NC was independently associated with weaker network integration and segregation, and increased vulnerability in a network of brain regions typically affected by LATE-NC.
Introduction
Limbic-predominant age-related transactive response DNA binding protein 43 (TDP-43) encephalopathy neuropathological change (LATE-NC) is a common neurodegenerative pathology in the brain of older adults and is associated with cognitive impairment and amnestic dementia similar to Alzheimer’s disease1. The anatomical distribution of TDP-43 pathology in a brain with LATE-NC typically involves the amygdala, hippocampus, and other subcortical, temporal and frontal lobe regions1,2. The impact of LATE-NC on the structural integrity of this network of regions remains unknown. Graph theory provides a framework to represent the brain as a complex network of nodes and edges, and can offer insights into the structural integrity of networked brain systems in health and disease3. In this study, we tested the hypothesis that LATE-NC is associated with abnormalities in graph theory metrics of structural connectivity in the network of regions known to be involved in LATE-NC1,2,4,5.Methods
Participants, MRI, neuropathologyCerebral hemispheres were obtained from 148 deceased older adults participating in two longitudinal clinical-pathologic cohort studies of aging6, the Rush Memory and Aging Project and the Religious Orders Study (Fig.1A). Diffusion-weighted MRI data were acquired ex-vivo on 3T clinical MRI scanners within the first 24 hours after death: TE=105ms, TR=12.5s, voxel size=2×2×2mm3, b=3,000s/mm2 for 200 diffusion gradient directions uniformly distributed in 3D space, and 72 b=1,800s/mm2 volumes. TORTOISE was used to correct eddy current distortions, calculate diffusion tensors, and generate fractional anisotropy (FA) maps7. The resulting FA maps were aligned to an ex-vivo FA template using ANTs registration8. The effects of scanner, postmortem interval to fixation and to imaging were regressed out of each participant’s FA map. Following ex-vivo MRI, hemispheres underwent detailed neuropathologic examination by a board-certified neuropathologist (Fig.1B).
Network construction
Nineteen brain regions that have previously been reported to contain TDP-43 pathology in LATE-NC were considered as nodes of the network that was investigated in this work1,2,4,5. These 19 regions were identified on the IIT Human Brain Atlas v.5.09, and maps of the structural connections between pairs of regions were provided by the corresponding track density images (TDIs) of the atlas (Fig.2). A minimum threshold of 5% of the maximum number of streamlines was applied to each TDI separately. Maps of the thresholded TDIs of the IIT atlas were then transformed to the space of the ex-vivo FA template (Fig.2). Next, the average FA was calculated for each connection, resulting in a 19x19 undirected structural connectivity integrity matrix for each participant, weighted by the number of streamlines (Fig.2).
Statistical analyses
Graph theory metrics were calculated from the connectivity matrix of each participant using the brain connectivity toolbox10. Global measures included global efficiency, average local efficiency, characteristic path length, transitivity, and assortativity coefficient. Local measures included nodal strength, clustering coefficient, shortest path length, local efficiency, betweenness centrality, and eigenvector centrality. General linear models (GLMs) were used to investigate the association of global and local graph measures with LATE-NC stages, controlling for demographics (age at death, sex, education), total white matter hyperintensity volume, and other neuropathologies (Alzheimer’s pathology, Lewy bodies, arteriolosclerosis, atherosclerosis, cerebral amyloid angiopathy, gross and microscopic infarcts). Statistical tests were performed with 10,000 permutations using FSL’s PALM tool11. Statistical significance was set at p<0.05 after family-wise error rate (FWER) adjustment to correct for multiple comparisons.
Results
Linear regression revealed that greater LATE-NC stage was associated with lower values in global network measures (p<0.05) (Fig.3). LATE-NC was also associated with lower local efficiency, lower clustering coefficient, lower nodal strength, and lower shortest path length in 84%, 63%, 58%, and 53% of the nodes, respectively (p<0.05) (Fig.4). Finally, LATE-NC was associated with both greater (in 26% of nodes) and lower (in 16% of nodes) eigenvector centrality, and with both greater (in medial orbitofrontal cortex) and lower (in caudal middle frontal cortex) betweenness centrality (p<0.05) (Fig.4).Discusssion
The present study combined ex-vivo MRI and detailed neuropathologic examination in community-based older adults to investigate for the first time LATE-NC-related abnormalities in the network of brain regions involved in LATE-NC. Our results revealed independent associations of LATE-NC with both global and regional network measures, controlling for other neuropathologies and demographics. LATE-NC was independently associated with weaker network integration (reflected by decreased path length, global efficiency) and segregation (decreased clustering coefficient, transitivity, local efficiency) indicating that in participants with LATE-NC the network becomes more random from a small-world topology10. The network abnormalities observed in this work may be reflective of LATE-NC mediated white matter degeneration.Conclusion
Using graph theory and a hypothesis-driven approach, we found significant degradation of structural integrity in white matter of the network of regions affected by LATE-NC. These findings may shed light on the effects of LATE-NC on brain connectivity, and in combination with other imaging and clinical information, may aid towards the development of tools for in-vivo detection of this devastating neuropathology.Acknowledgements
This study was supported by the following grants:
National Institute on Aging (NIA): R01AG064233, R01AG067482, R01AG017917, R01AG015819, RF1AG022018, R01AG056405, R01AG052200, P30AG010161, P30AG072975
National Institute of Neurological Disorders and Stroke (NINDS): UH2-UH3NS100599, UF1NS100599, R21NS076827
References
1. Nelson PT, Dickson DW, Trojanowski JQ, et al. Limbic-predominant age-related TDP-43 encephalopathy (LATE): Consensus working group report. Brain. 2019;142(6):1503-1527.
2. Josephs KA, Murray ME, Whitwell JL, et al. Updated TDP-43 in Alzheimer’s disease staging scheme. Acta Neuropathol. 2016;131(4):571-585.
3. Sporns O. Graph theory methods: Applications in brain networks. Dialogues Clin Neurosci. 2018;20(2):111-120.
4. Bejanin A, Murray ME, Martin P, et al. Antemortem volume loss mirrors TDP-43 staging in older adults with non-frontotemporal lobar degeneration. Brain. 2019;142(11):3621-3635.
5. Nag S, Yu L, Boyle PA, Leurgans SE, et al. TDP-43 pathology in anterior temporal pole cortex in aging and Alzheimer’s disease. Acta Neuropathol Commun. 2018;6(1):33.
6. Bennett DA, Buchman AS, Boyle PA, et al. Religious Orders Study and Rush Memory and Aging Project. J Alzheimer’s Dis. 2018;64(s1):S161-S189.
7. C. Pierpaoli, L. Walker, M. O. Irfanoglu, et al. TORTOISE: an integrated software package for processing of diffusion MRI data, ISMRM 18th annual meeting, Stockholm, Sweden, 2010, abstract #1597.
8. Avants BB, Tustison NJ, Song G, et al. A reproducible evaluation of ANTs similarity metric performance in brain image registration. Neuroimage. 2011;54(3):2033-2044.
9. Qi X, Arfanakis K. Regionconnect: Rapidly extracting standardized brain connectivity information in voxel-wise neuroimaging studies. Neuroimage. 2021;225:117462.
10. Rubinov M, Sporns O. Complex network measures of brain connectivity: Uses and interpretations. Neuroimage. 2010;52(3):1059-1069.
11. Winkler AM, Ridgway GR, Webster MA, et al. Permutation inference for the general linear model. Neuroimage. 2014;92:381-397.
Figures
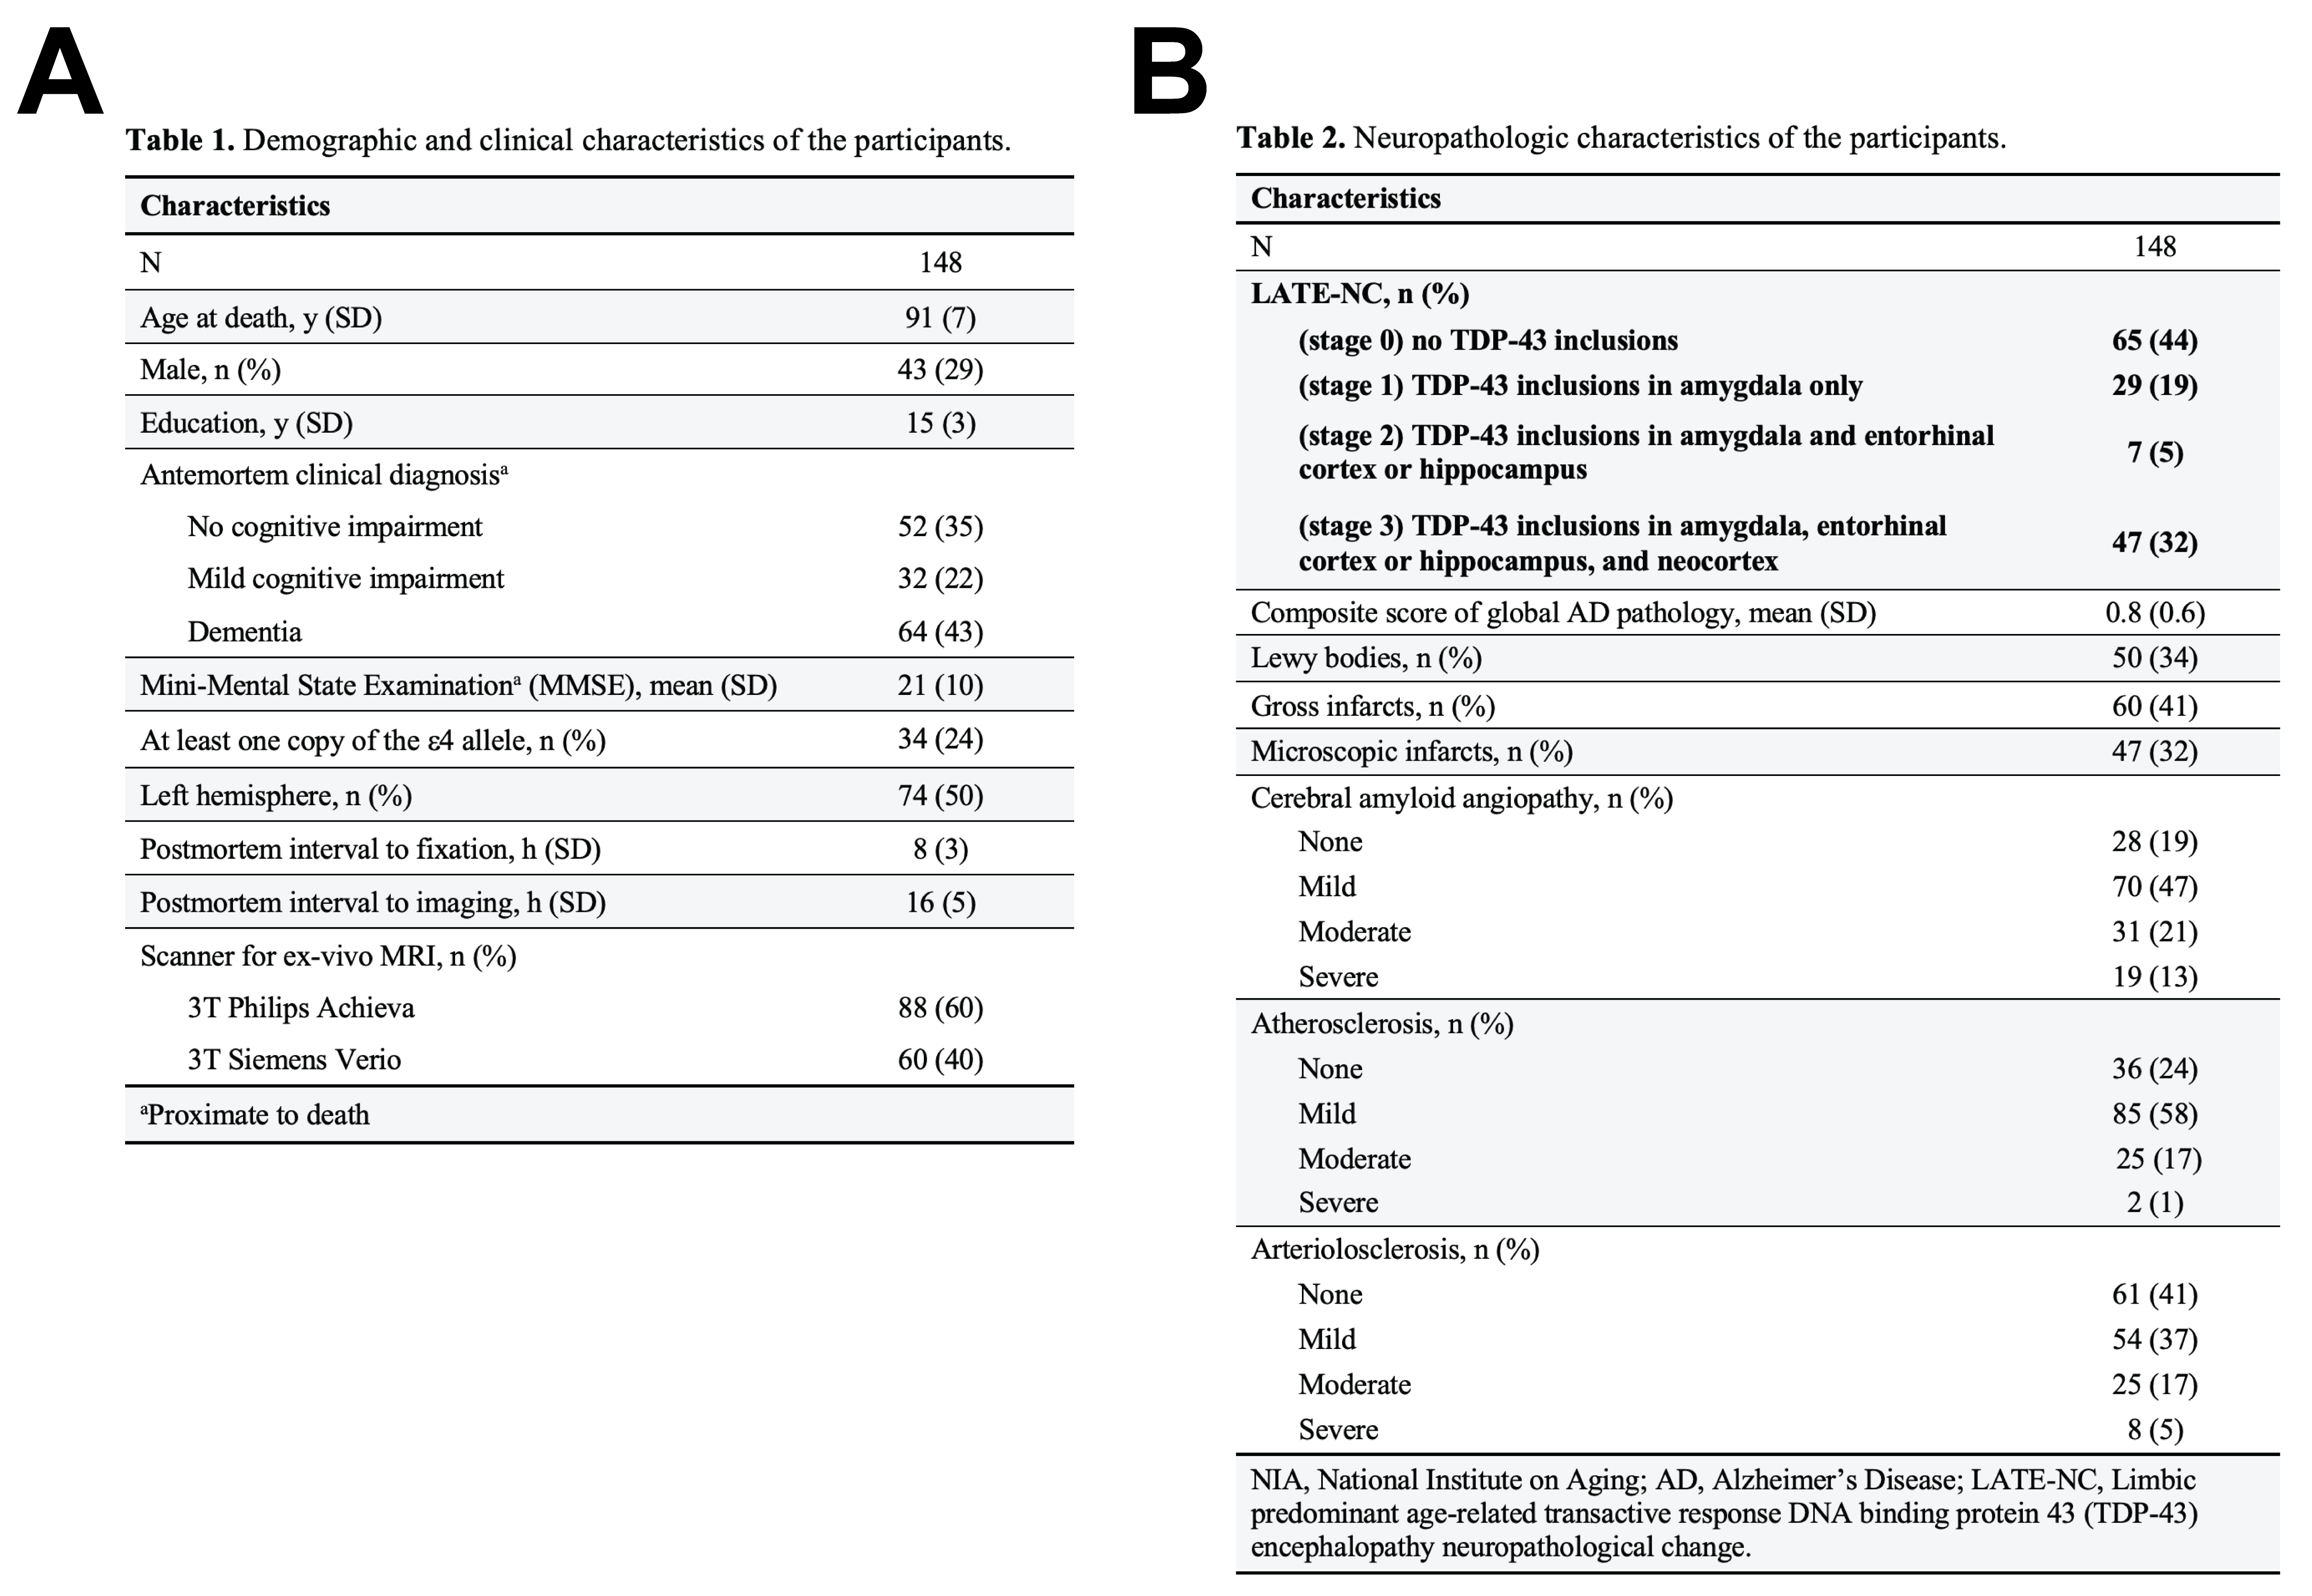
Figure 1: Demographic, clinical and neuropathologic characteristics of the participants.
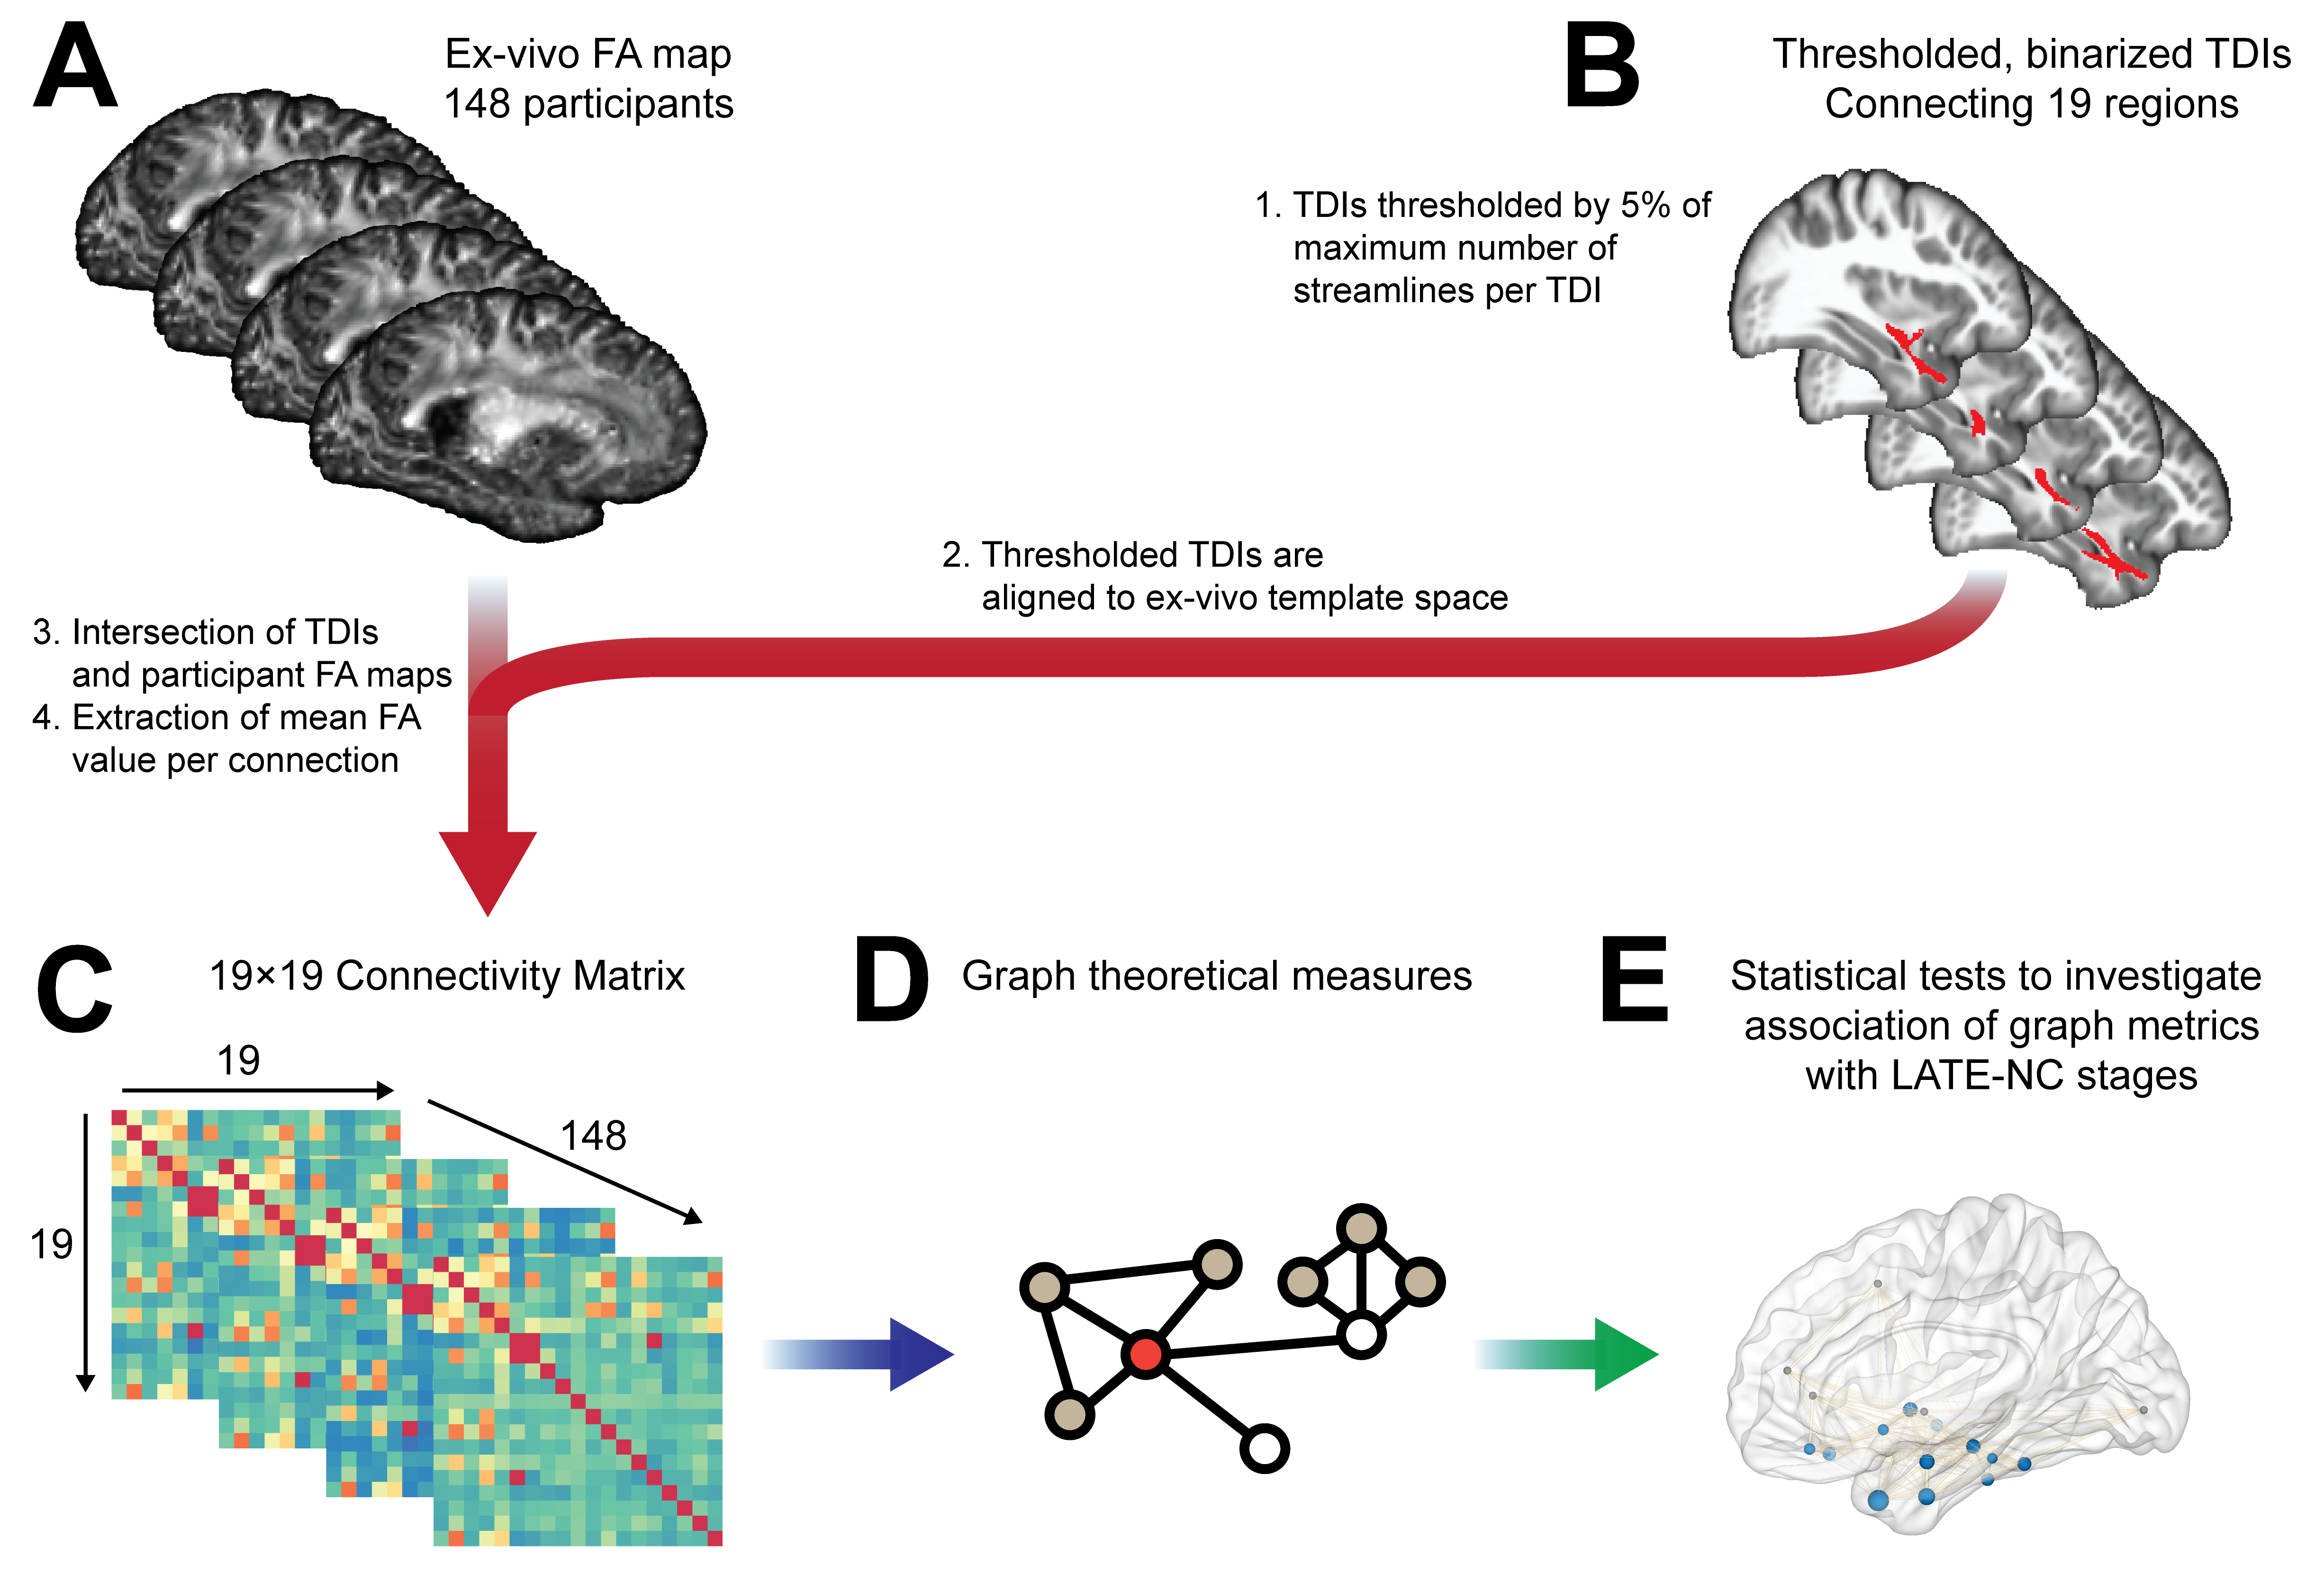
Figure 2: Methods overview. (A) Participant FA maps and (B) thresholded TDI maps from the IIT atlas (v.5.0) were brought to the same space and mean FA values were extracted per connection, resulting in a (C) 19×19 undirected connectivity matrix for each participant, weighted by the number of streamlines. (D) Graph properties were extracted from the connectivity matrix, and (E) their association with LATE-NC stages was evaluated.
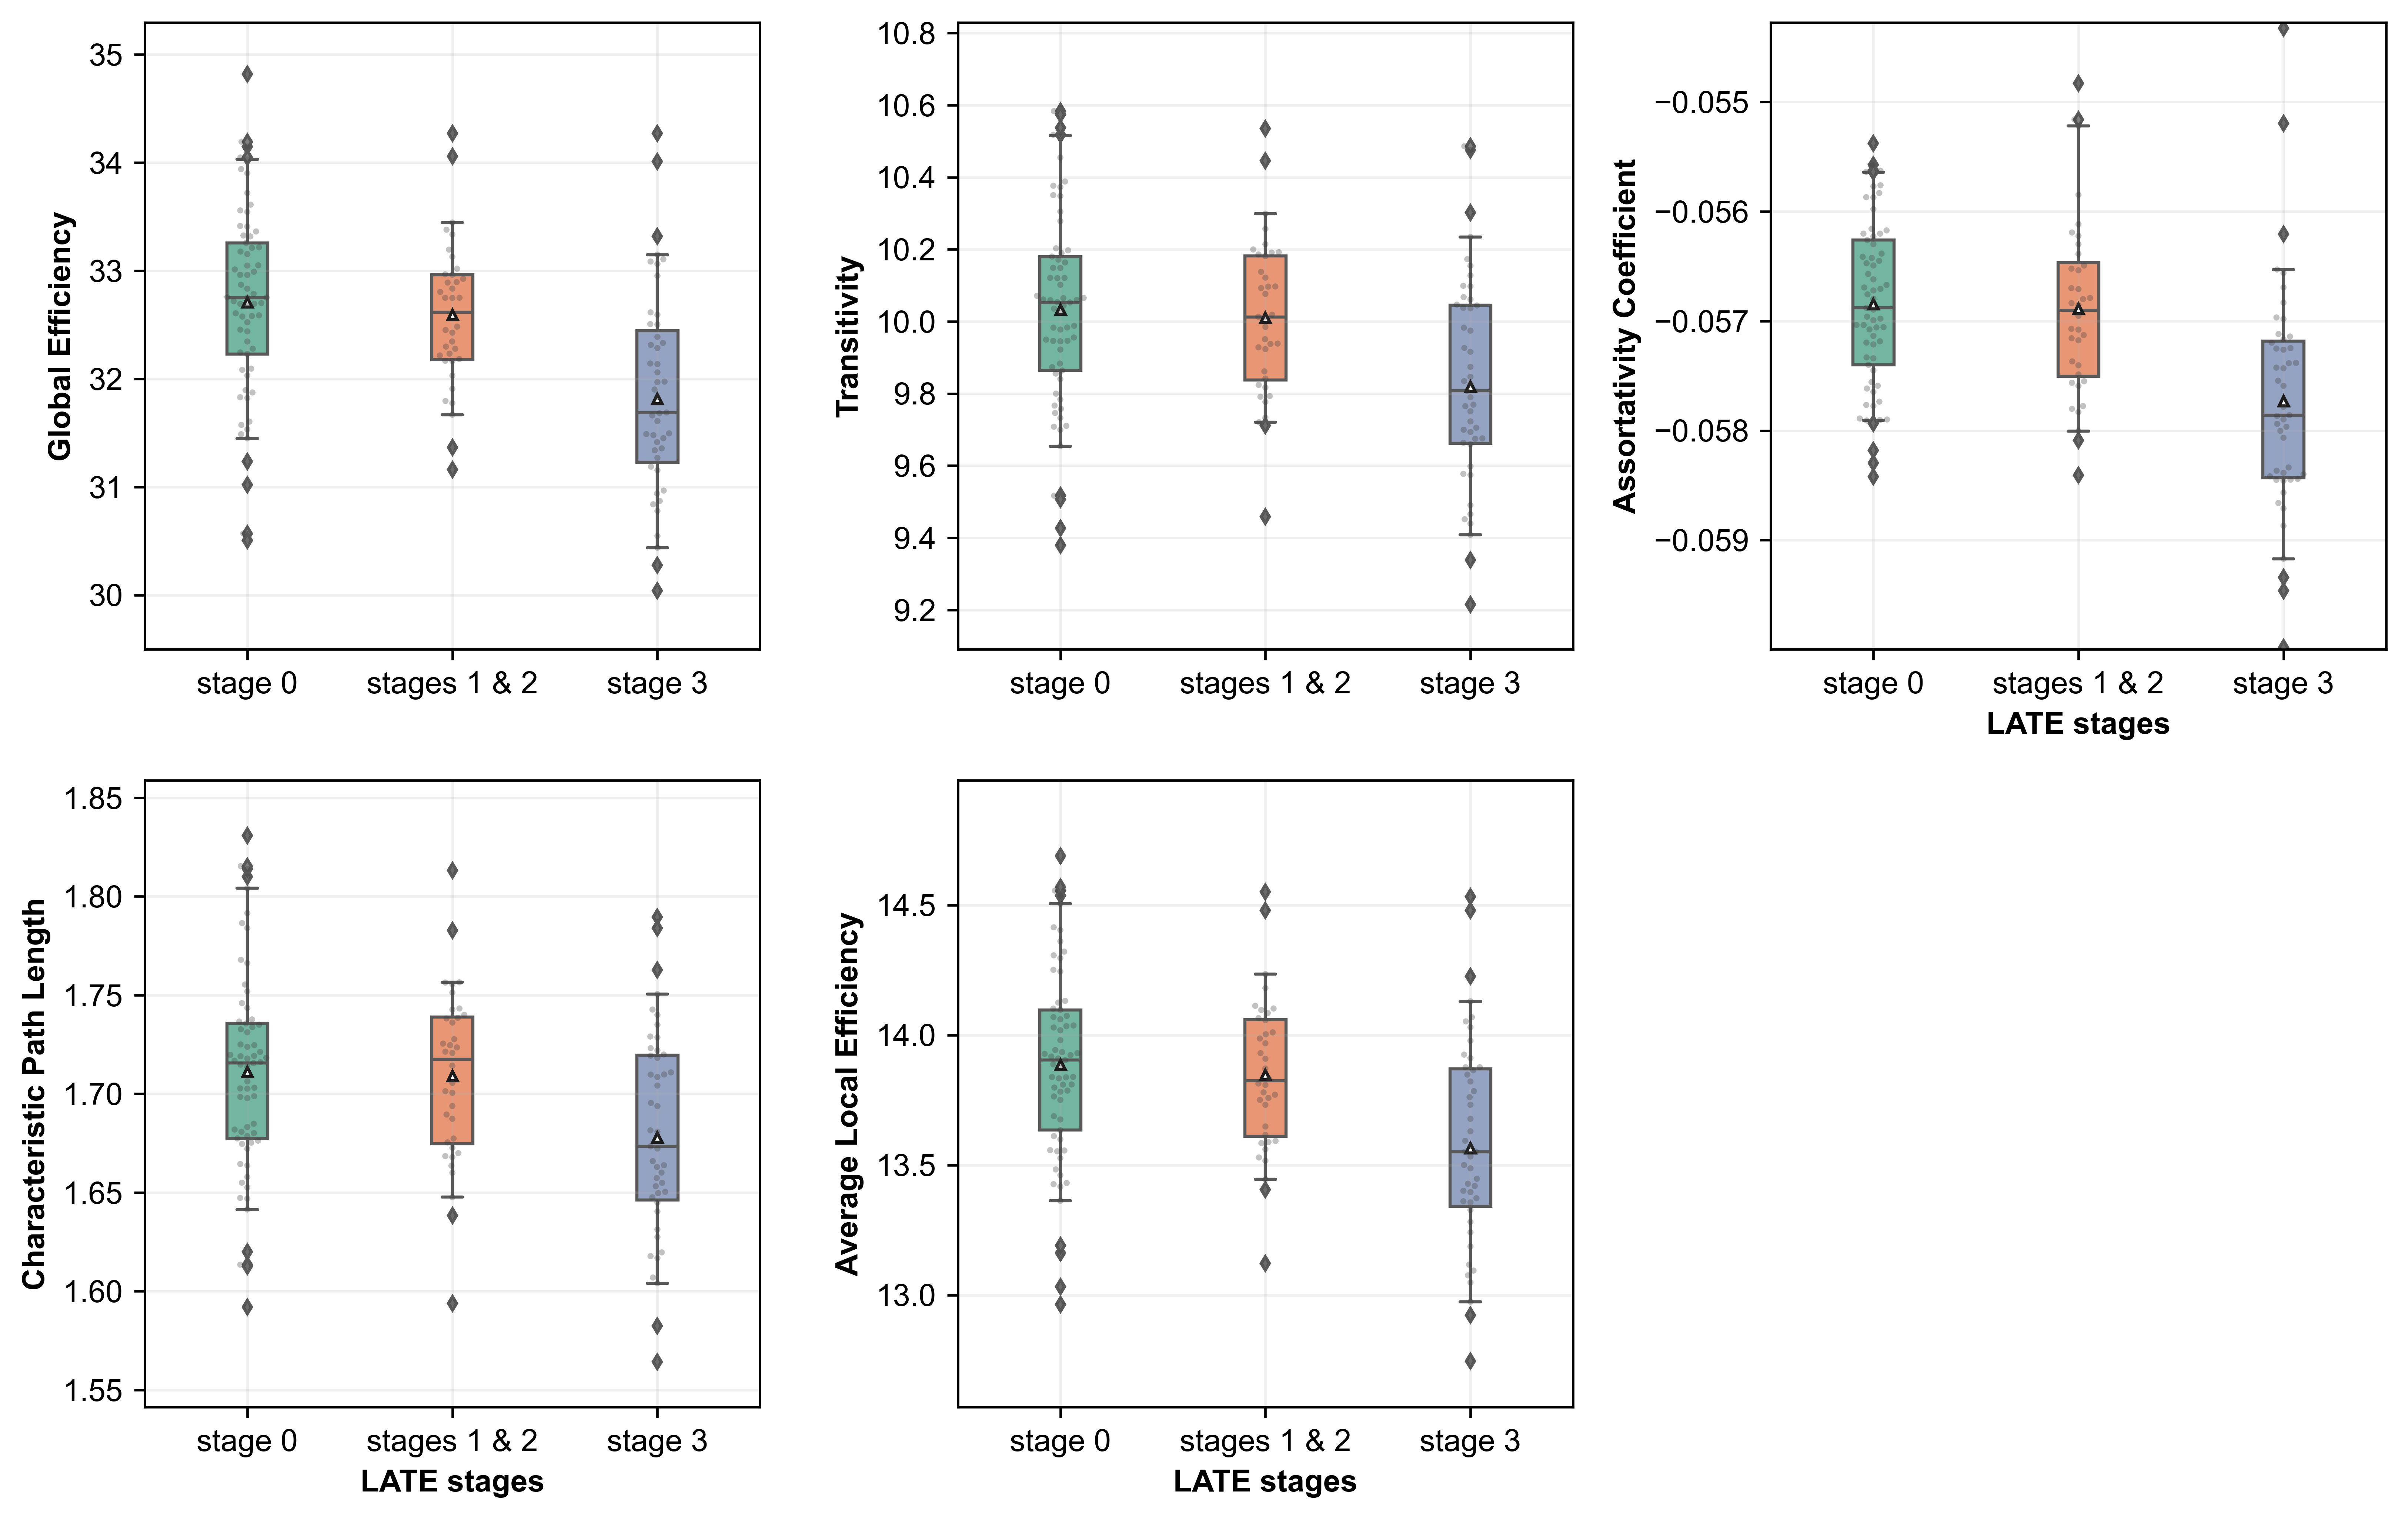
Figure 3: Global graph theory measures for different LATE-NC stages. Stages 1 and 2 were combined since stage 2 had the fewest participants. Whiskers represent 5-95% of the values, diamond-shaped points indicate outliers, and the white triangle inside each box indicates the mean value.
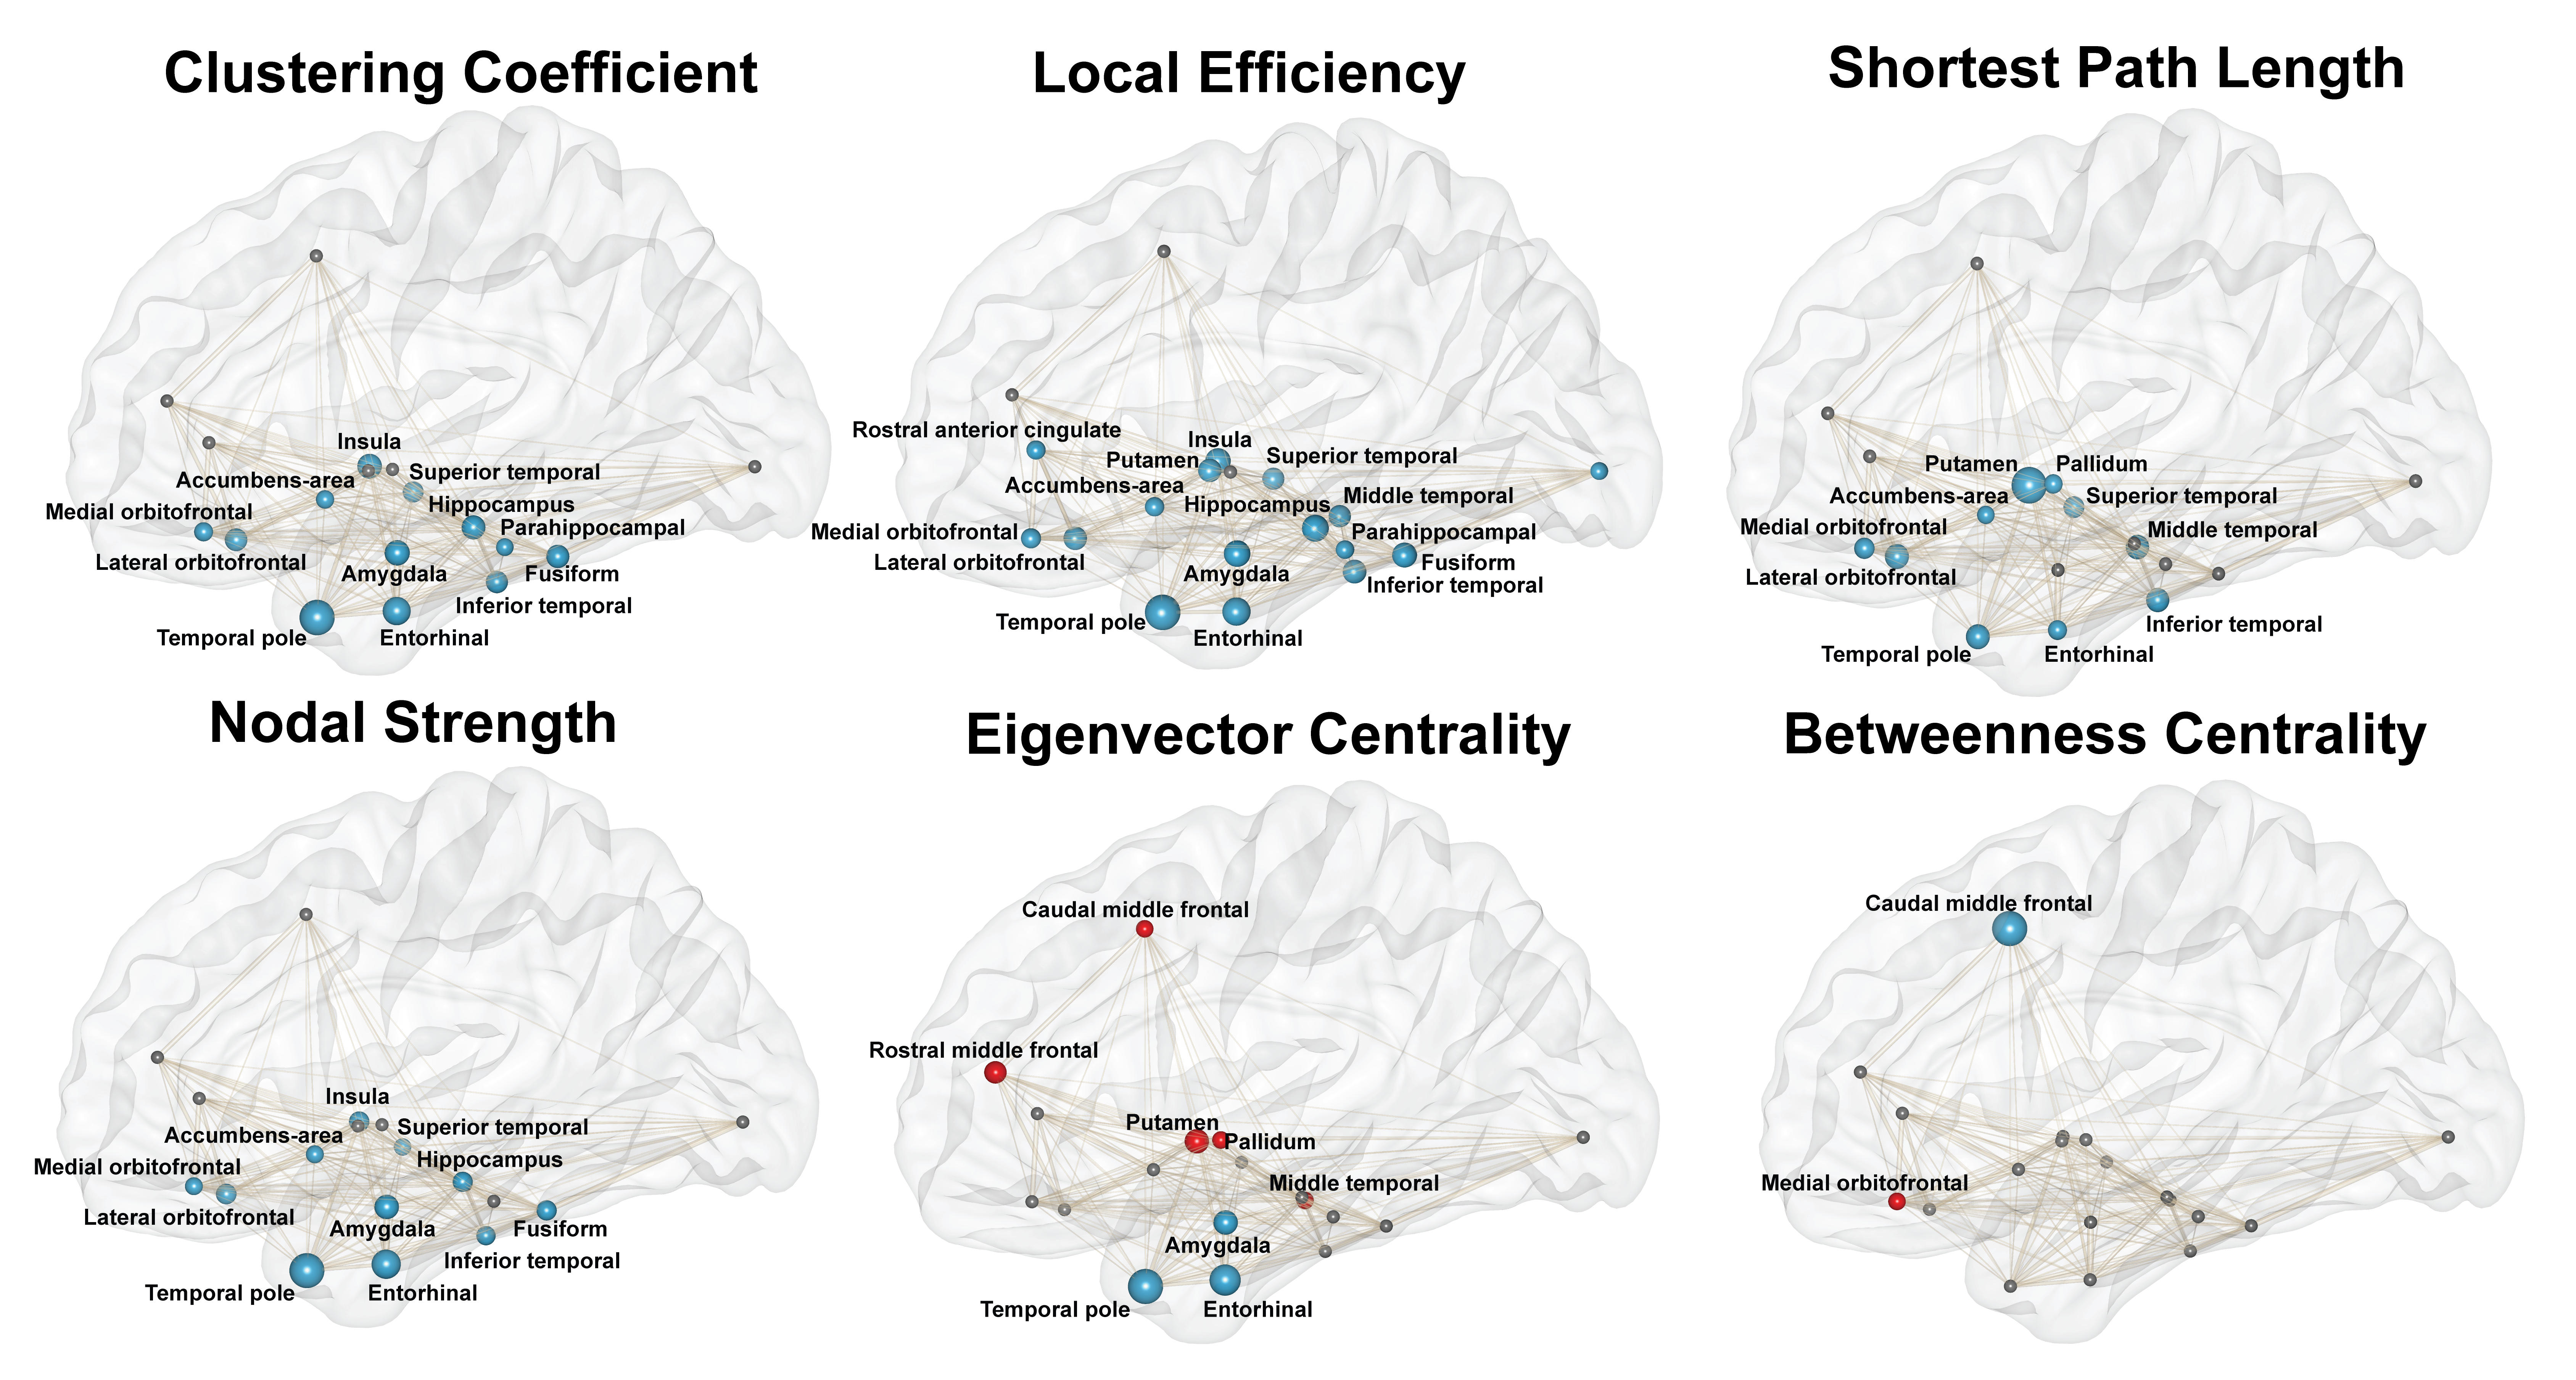
Figure 4: Associations of local network measures with LATE-NC. Node size represents relative regression coefficient. Blue nodes represent significant negative association (FWER-corrected p<0.05), red nodes represent significant positive association (FWER-corrected p<0.05), and small dark nodes indicate no significance. Edge thickness represents the weight of a connection (fractional anisotropy and number of streamlines).