1297
Diagnostic Value of Clear Cell Likelihood Score v1.0 and v2.0 for Clear Cell Renal Cell Carcinoma: A Comparative Study1Department of Radiology, the first Medical Centre of Chinese PLA General Hospital, Beijing, China
Synopsis
Keywords: Kidney, Tumor, Small renal masses; Clear cell likelihood score; Clear cell renal cell carcinoma
ccLS provides a new tool for the diagnosis and differential diagnosis of solid renal tumors and can be used to assist radiologists in their daily diagnosis. In this study, Six radiologists were trained in the ccLS algorithm and scored independently using ccLS v1.0 and ccLS v2.0, respectively. The results show that although the interobserver agreement between ccLS v1.0 and ccLS v2.0 is comparable, the diagnostic performance of ccLS v2.0 in ccRCC is better than that of ccLS v1.0 and ccLS v2.0 reduces the percentage of ccRCC in 1-3 scores. This finding is helpful to improve the clinical universality of ccLS.Abstract
Introduction Small renal masses (SRMs) refer to lesions with a diameter of less than 4cm after contrast enhancement.1,2 Clear cell renal cell carcinoma (ccRCC) is the most common malignant subtype in solid SRMs (>25% approximate volume enhancement), with strong invasiveness, high metastasis risk, and poor prognosis,3-5 active intervention measures are necessary, so it is imperative to identify renal tumor pathological subtypes before operations.6-8 Clear Cell Likelihood Score (ccLS) is a 5-point scoring system based on multi-parameter magnetic resonance imaging (mp-MRI), which is extremely useful in the diagnosis and prognosis of ccRCC.9-13 In February 2022, Ivan Pedrosa et al updated Clear Cell Likelihood Score Version 2.0 (ccLS v2.0) to improve its diagnostic performance and clinical universality.14-18 The performance of ccLS v1.0 and ccLS v2.0 for the same batch of SRM patients has not been compared to date. Our study aims to compare the diagnostic performance and interobserver agreement of ccLS v1.0 and ccLS v2.0 for diagnosing ccRCC in solid SRMs.Methods In this study, clinical data and MR images of patients with pathologically confirmed solid SRMs were collected retrospectively from three academic medical centers from January 1, 2018 to December 31, 2021. Six abdominal radiologists were trained in the ccLS algorithm and scored independently using ccLS v1.0 and ccLS v2.0, respectively. Random-effects logistic regression modeling was used to generate plot receiver operating characteristic curves (ROC) to evaluate the diagnostic performance of ccLS v1.0 and ccLS v2.0, and the area under the curve (AUC) of the two scoring systems were compared using DeLong’s test. Cohen Kappa test was used to evaluate the interobserver agreement of the ccLS score, and the difference in the Cohen's Kappa was compared using the Gwet consistency coefficient.
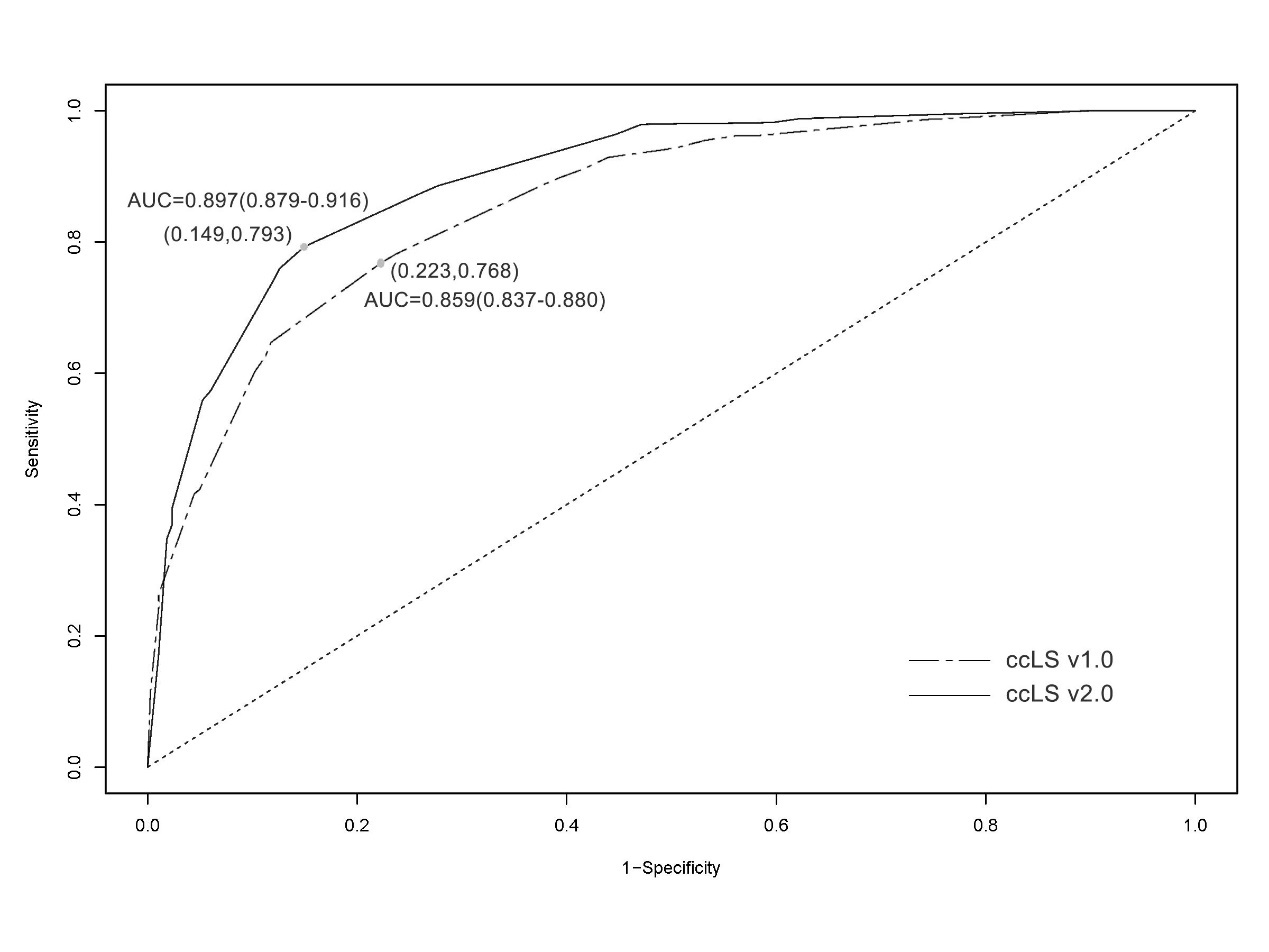
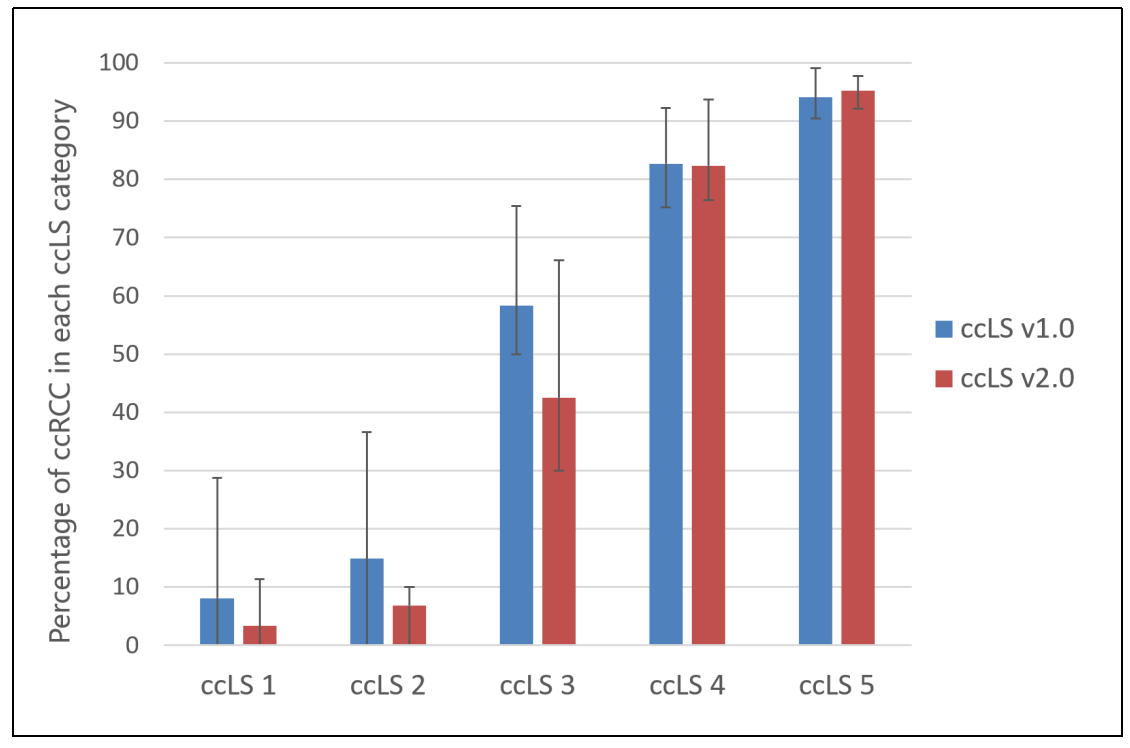
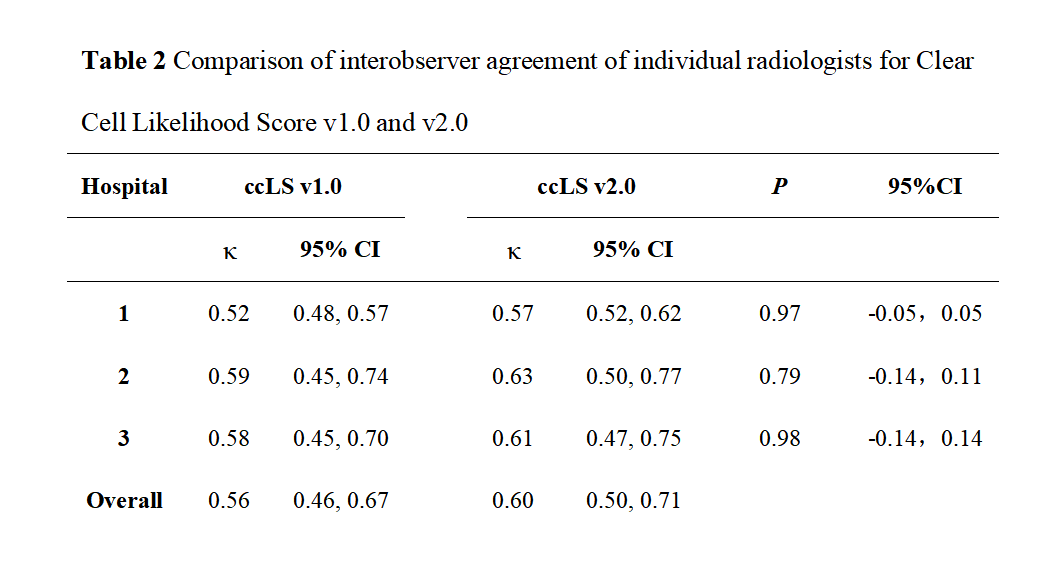
Results In total, 691 patients (491 males, 200 females; mean age, 54±12 years) with 700 renal masses were identified. The results of the ccLS v1.0 and v2.0 suggested that the pooled accuracy, sensitivity, specificity, positive predictive value (PPV) and negative predictive value (NPV) were 77.1%, 76.8%, 77.7%, 90.2%, 55.7% and 80.9%, 79.3%, 85.1%, 93.4%, 60.6%. AUC of ccLS v2.0 was superior to those of ccLS v1.0 for the diagnosis of ccRCC [0.897 (95%CI:0.223,0.768) vs 0.859 (95%CI:0.149, 0.793)], with significant differences (P<0.01). Comparing ccLS v2.0 with ccLS v1.0, the percentage of ccRCC by the score of 1-3 has decreased from 27.1% to 17.6%, with significant differences (P<0.001). In addition, the interobserver agreement of ccLS v1.0 and ccLS v2.0 were 0.56 and 0.60, and the differences were not statistically significant (P>0.05).
Discussion In this study, six radiologists scored 700 SRMs independently using ccLS v1.0 and ccLS v2.0. The results showed that the diagnostic performance of ccLS v2.0 was better than that of ccLS v1.0 in the diagnosis of ccRCC. The main reasons are as follows: firstly, ccLS v2.0 redefines renal tumor enhancement degree,14 as opposed to ccLS v1.0. Intense enhancement is a tumor enhancement greater than or equal to 100% renal cortex. More than 75% is considered an intense enhancement, which increases the percentage of renal tumors with intense enhancement and the score of the ccLS. Secondly, ccLS v2.0 redistributes the diagnostic weight of some parameters, highlighting the weight of microscopic fat. Some studies have shown that about 60% of ccRCC contain microscopic fat,19,20 which helps to increase the ccLS scores of SRM with microscopic fat and reduce the percentage of ccRCC in 1-3 scores (27.1% vs 17.6%, P <0.001). Finally, ccLS v2.0 weakens the segmental enhancement inversion (SEI) weight. At present, the practicability of SEI is still controversial.11,21,22 Kay et al.11 have shown that the existence of SEI on mpMRI is an independent predictor for the diagnosis of oncocytoma (OR: 16.21; 95%CI: 1.0-275.4), but the confidence interval is large (≈1), and the interobserver agreement among radiologists is moderate (κ = 0.49). In addition, SEI is present in 15% of ccRCC, so weakening the SEI imaging sign can further reduce the misdiagnosis rate and improve the diagnostic performance of ccLS in the diagnosis of ccRCC. And the diagnostic procedures of ccLS v1.0 and ccLS v2.0 are basically the same, as are the MRI sequences required for diagnosis and the imaging signs observed by radiologists, thus resulting in similar levels of interobserver agreement among radiologists.
Conclusion ccLS v2.0 provided better diagnostic performance than ccLS v1.0. ccLS v2.0 can reduce misdiagnosis and unnecessary puncture biopsies, and may be considered to support the daily diagnostic work of radiologists.
Acknowledgements
NoneReferences
[1] Sebastià C, Corominas D, Musquera M, et al. Active surveillance of small renal masses[J]. Insights into imaging, 2020, 11(1):63.
[2] Finelli A, Ismaila N, Bro B, et al. Management of Small Renal Masses: American Society of Clinical Oncology Clinical Practice Guideline[J]. Journal of clinical oncology : official journal of the American Society of Clinical Oncology, 2017, 35(6):668–680.
[3] Bhindi B, Thompson R H, Lohse C M, et al. The Probability of Aggressive Versus Indolent Histology Based on Renal Tumor Size: Implications for Surveillance and Treatment[J]. European urology, 2018, 74(4):489–497.
[4] Moch H, Cubilla A L, Humphrey P A, et al. The 2016 WHO Classification of Tumours of the Urinary System and Male Genital Organs-Part A: Renal, Penile, and Testicular Tumours[J]. European urology, 2016, 70(1):93–105.
[5] Finelli A, Cheung D C, Al-Matar A, et al. Small Renal Mass Surveillance: Histology-specific Growth Rates in a Biopsy-characterized Cohort[J]. European urology, 2020, 78(3):460–467.
[6] Campbell S C. Commentary RE: Increased Incidence of Serendipitously Discovered Renal Cell Carcinoma[J]. Urology, 2020 Nov, 145:333.
[7] Znaor A, Lortet-Tieulent J, Laversanne M, et al. International variations and trends in renal cell carcinoma incidence and mortality[J]. European urology, 2015, 67(3):519–530.
[8] Campbell S C, Uzzo R G, Karam J A, et al. Renal Mass and Localized Renal Cancer: Evaluation, Management, and Follow-up: AUA Guideline: Part II[J]. The Journal of urology, 2021, 206(2):209–21.
[9] Kay FU, Pedrosa I. Imaging of Solid Renal Masses. Radiol Clin North Am. 2017 Mar;55(2):243-258. [10] Canvasser N E, Kay F U, Xi Y, et al. Diagnostic Accuracy of Multiparametric Magnetic Resonance Imaging to Identify Clear Cell Renal Cell Carcinoma in cT1a Renal Masses[J]. The Journal of urology, 2017, 198(4):780–786.
[11] Kay F U, Canvasser N E, Xi Y, et al. Diagnostic Performance and Interreader Agreement of a Standardized MR Imaging Approach in the Prediction of Small Renal Mass Histology[J]. Radiology, 2018, 287(2):543–553.
[12] Johnson B A, Kim S, Steinberg R L, et al. Diagnostic performance of prospectively assigned clear cell Likelihood scores (ccLS) in small renal masses at multiparametric magnetic resonance imaging[J]. Urologic oncology, 2019, 37(12):941–946.
[13] Steinberg R L, Rasmussen R G, Johnson B A, et al. Prospective performance of clear cell likelihood scores (ccLS) in renal masses evaluated with multiparametric magnetic resonance imaging[J]. European radiology, 2021, 31(1):314–324.
[14] Pedrosa I, Cadeddu J A. How We Do It: Managing the Indeterminate Renal Mass with the MRI Clear Cell Likelihood Score[J]. Radiology, 2022, 302(2):256–269.
[15] Dunn M, Linehan V, Clarke S E, et al. Diagnostic Performance and Interreader Agreement of the MRI Clear Cell Likelihood Score for Characterization of cT1a and cT1b Solid Renal Masses: An External Validation Study[J]. AJR. American journal of roentgenology, 2022 Aug(17):1–11.
[16] Rasmussen R G, Xi Y, Sibley R C, et al. Association of Clear Cell Likelihood Score on MRI and Growth Kinetics of Small Solid Renal Masses on Active Surveillance[J]. AJR. American journal of roentgenology, 2022, 218(1):101–110.
[17] Schieda N, Davenport M S, Silverman S G, et al. Multicenter Evaluation of Multiparametric MRI Clear Cell Likelihood Scores in Solid Indeterminate Small Renal Masses[J]. Radiology, 2022, 303(3):590–599. [18] Al Nasibi K, Pickovsky J S, Eldehimi F, et al. Development of a Multiparametric Renal CT Algorithm for Diagnosis of Clear Cell Renal Cell Carcinoma Among Small (≤ 4 cm) Solid Renal Masses[J]. AJR. American journal of roentgenology, 2022 Aug 31:1–10.
[19] Lopes Vendrami C, Parada Villavicencio C, DeJulio T J, et al. Differentiation of Solid Renal Tumors with Multiparametric MR Imaging[J]. Radiographics: a review publication of the Radiological Society of North America, Inc, 2017, 37(7):2026–2042.
[20] Jhaveri K S, Elmi A, Hosseini-Nik H, et al. Predictive Value of Chemical-Shift MRI in Distinguishing Clear Cell Renal Cell Carcinoma From Non-Clear Cell Renal Cell Carcinoma and Minimal-Fat Angiomyolipoma[J]. AJR. American journal of roentgenology, 2015, 205(1):W79-86.
[21] Woo S, Cho J Y, Kim S H, et al. Segmental enhancement inversion of small renal oncocytoma: differences in prevalence according to tumor size[J]. AJR. American journal of roentgenology, 2013, 200(5):1054–1059.
[22] Schieda N, Al-Subhi M, Flood T A, et al. Diagnostic accuracy of segmental enhancement inversion for the diagnosis of renal oncocytoma using biphasic computed tomography (CT) and multiphase contrast-enhanced magnetic resonance imaging (MRI)[J]. European radiology, 2014, 24(11):2787–2794.
Figures
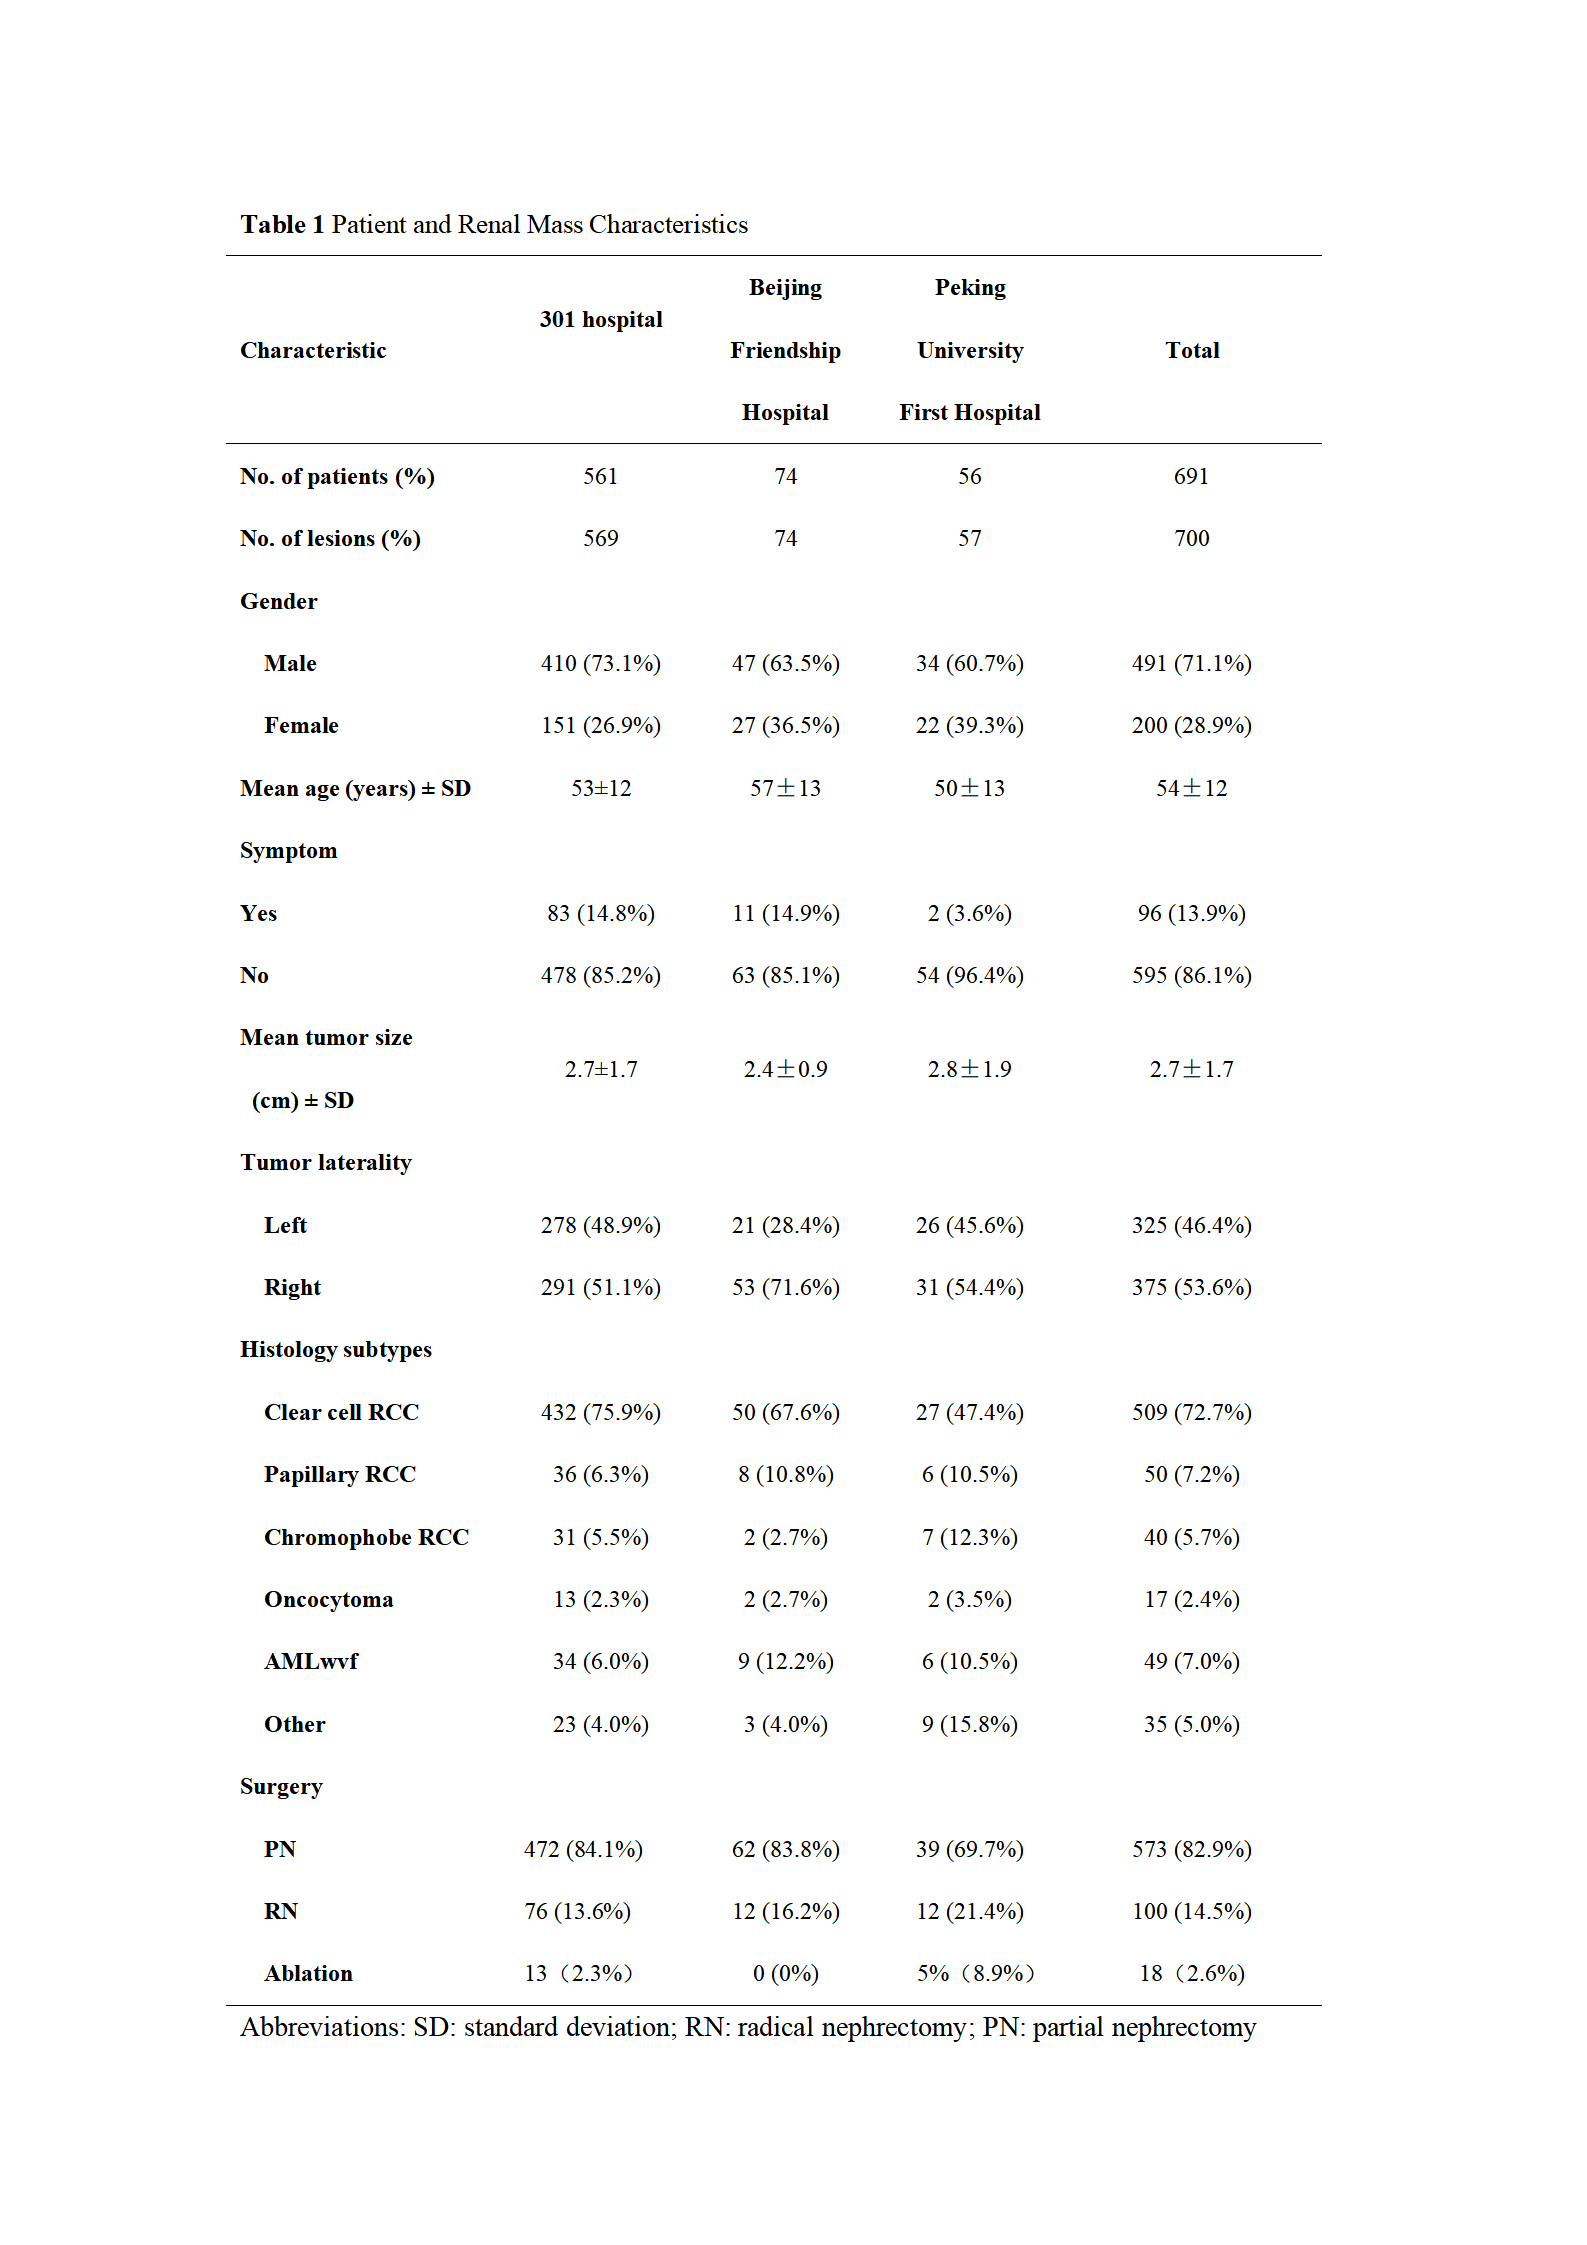
Table 1 Patient and Renal Mass Characteristics