1296
Improving tractography using high angular resolution diffusion imaging in rodent kidney1Department of Radiology and Imaging Sciences, Indiana University School of Medicine, Indianapolis, IN, United States, 2Division of Nephrology, Department of Medicine, Indiana University School of Medicine, Indianapolis, IN, United States, 3Stark Neurosciences Research Institute, Indianapolis, IN, United States
Synopsis
Keywords: Kidney, Diffusion Tensor Imaging, Tractography
Diffusion tensor imaging (DTI) has been widely used to study renal microstructure. However, DTI-based tractography failed to track tubules throughout the kidney. Here, we aim to determine whether high angular resolution diffusion imaging (HARDI) could improve the tractography in the complicated tubular architectures of rodent kidney.INTRODUCTION
Diffusion tensor imaging (DTI) is a powerful technique for the non-invasive assessment of renal microstructure in both human and animal models 1,2. However, DTI measurement has been found to be sensitive to acquisition parameters 3,4. The number of diffusion-weighted images (DWI), also known as an angular resolution is one such parameter and its effect on DTI studies of kidneys is still lacking 5,6. In this study, we aim to investigate the influence of angular resolution on DTI metrics and tractography in rodent kidneys. The tubular structures were further compared using generalized q-sampling imaging (GQI) and validated using conventional histology.METHODS
Specimen5 wild-type adult C57BL/6 mice (Jackson Laboratory, Bar Harbor, ME), one normal rat, and one Cy/+IU (Chronic Kidney Disease, CKD) were chosen for MR imaging.
High-resolution MRI Experiment
The mouse kidneys were scanned at a 9.4 T Oxford 8.9 cm vertical bore magnet (Agilent VnmrJ 4.0 imaging console) using a modified 3D Stejskal-Tanner under-sampled diffusion-weighted spin-echo sequence using b values 1500 s/mm2 with the 46 diffusion gradient encoding directions and 5 non-diffusion-weighted (b0) measurements. The rat kidneys were scanned at a 9.4 T 30 cm bore magnet (Bruker BioSpec 94/30, Billerica, MA) using a multi-shot 3D diffusion-weighted EPI pulse sequence at b values of 1500 s/mm2 with the 24 diffusion gradient encoding directions and 6 non-diffusion-weighted (b0) measurements.
Data Analysis
The scalar indices including FA, MD, axial diffusivity (AD), and radial diffusivity (RD) were calculated. To assess the effect of angular resolution for DTI metrics, the diffusion datasets with 46 DWIs (the ground truth) were subsampled to 6, 12, 20, 24, 30, 36, and 40 DWIs. The kidney was divided into the inner medulla (IM), outer medulla (OM), and cortex (CO) by manually drawing the ROIs using ITK-SNAP software. The GQI method was used to quantify the diffusing water at different orientations with the capability to resolve the crossing fibers. Deterministic fiber tracking of the kidney was performed using the DSI studio toolbox 7. Track density imaging (TDI) at 10 µm was also used to facilitate visualization of the fine tubule architecture in the mouse kidney 8.
Statistical Analysis
The FA and MD maps from diffusion MRI scans with 46 DWIs served as the ground truth. The DTI metrics at different DWIs (6 to 40) were compared with the ground truth. One-way analysis of variance was performed using Matlab (MathWorks, Natick, MA). A p-value < 0.05 was considered statistically significant.
Histology Validation
After Microscopic MRI scanning, specimens were embedded in paraffin and sectioned at 5-µm thickness. Sections were stained with hematoxylin and eosin and Masson’s trichrome. These slides were scanned using bright field contrast on an Axioskop 2 FS microscope (Carl Zeiss Microscopy, LCC, Thornwood, NY). Images were acquired with a 10x objective.
RESULTS
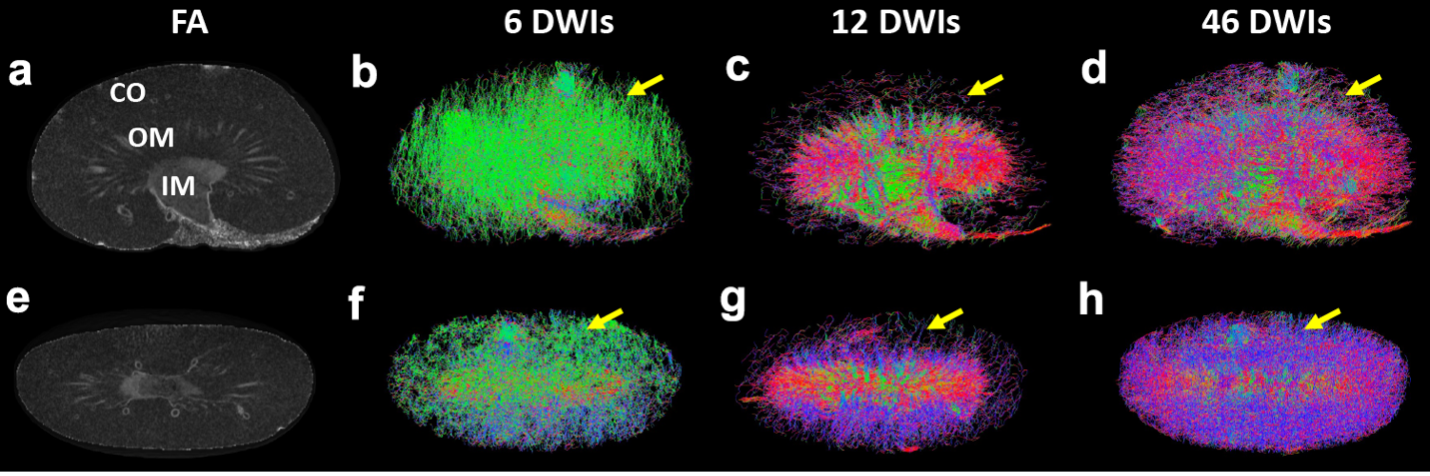
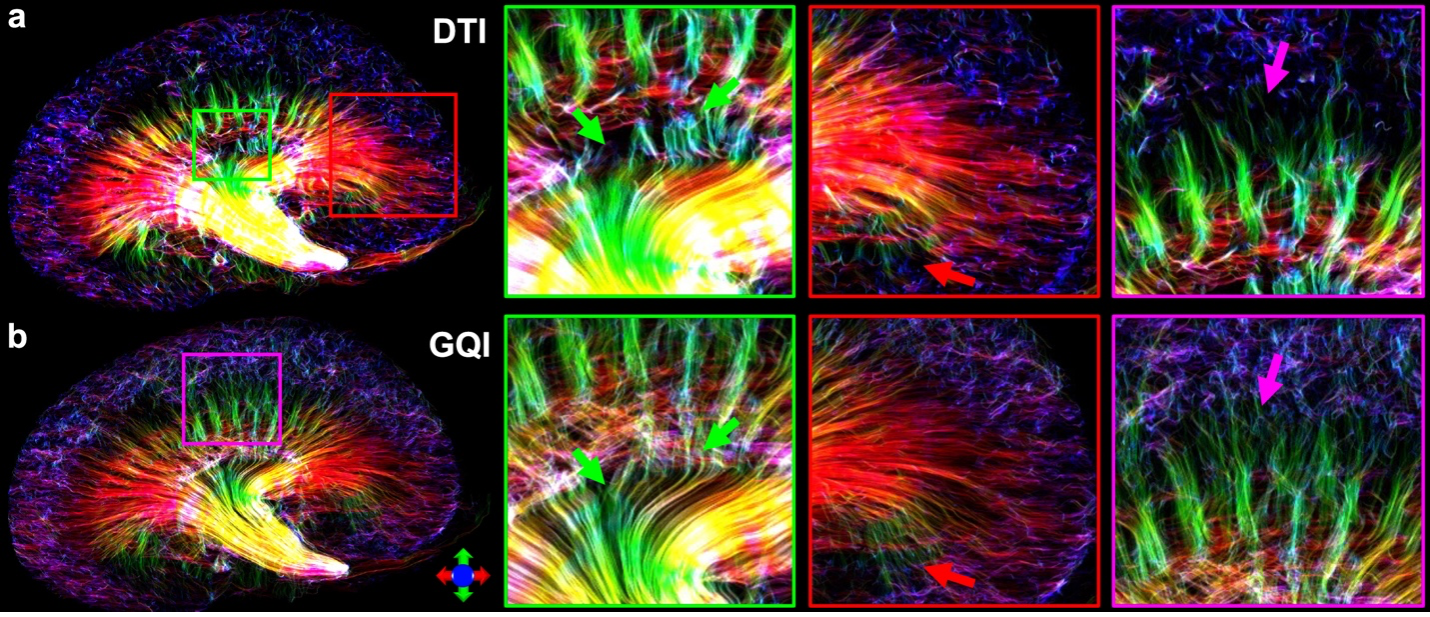
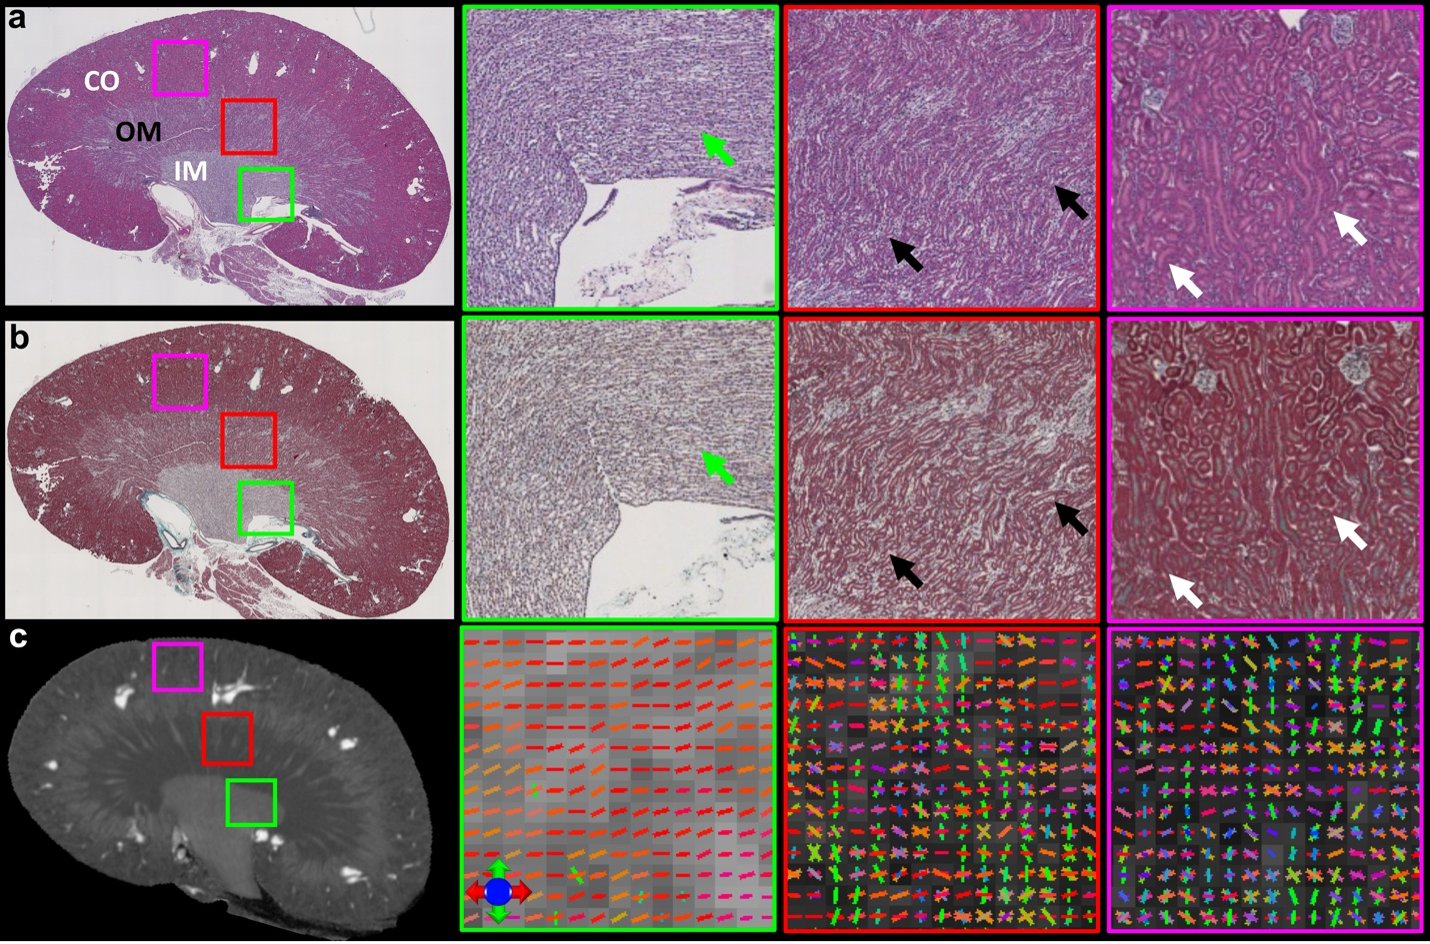
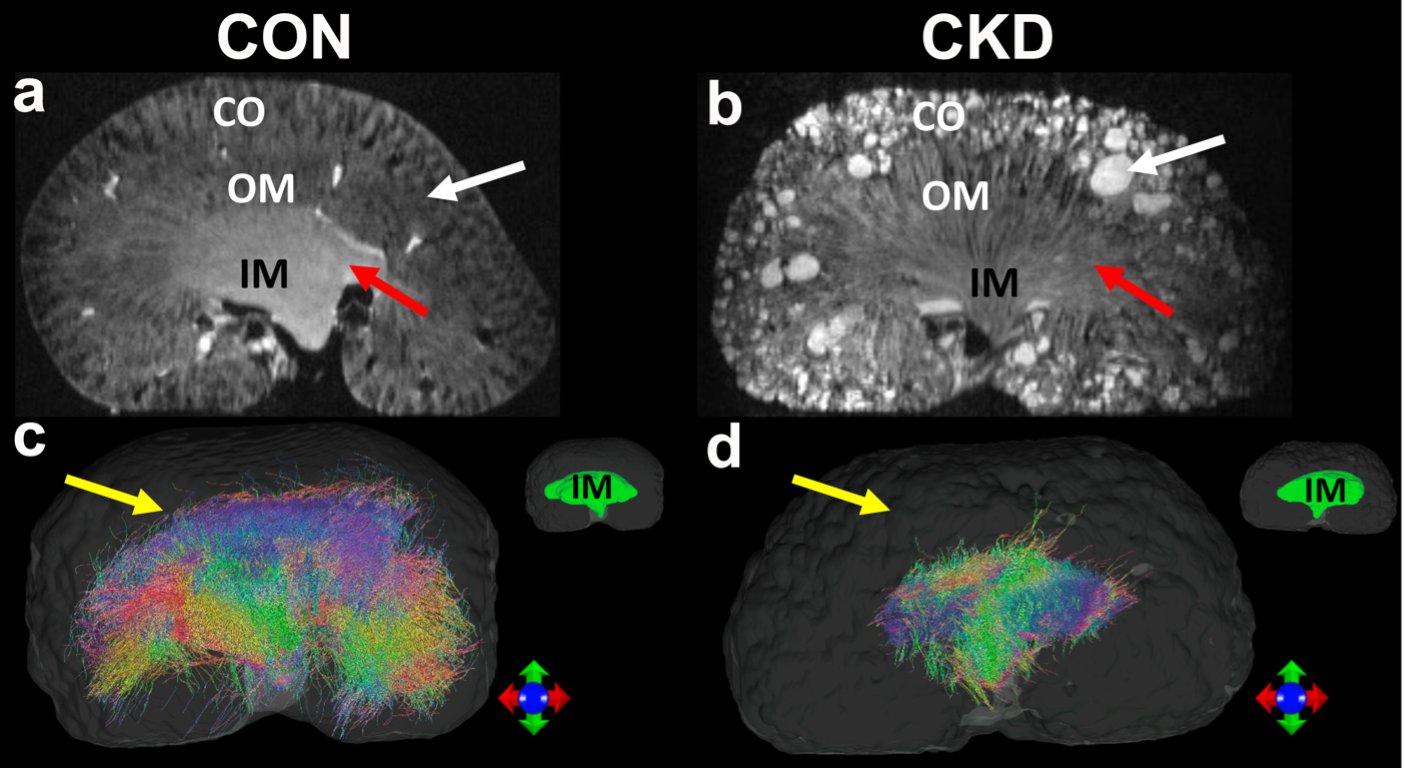
Figure 1 showed the effect of angular resolution on FA and MD maps at different diffusion gradient directions. The FA was largely overestimated with 6 DWIs (minimum requirement of DTI model) for all 3 parts of the kidney (red arrows for IM). The FA maps showed visually less variation with more than 24 DWIs. In contrast, the MD maps at different DWIs were comparable. In Figure 2, the tractography failed with 6 DWIs due to incorrect tubular orientations. The tractography in IM and OM was significantly improved with 12 DWIs. Tractography with 46 DWIs showed more intact and organized tubular tracts in IM, OM, and CO regions. In Figure 3, the tracts became more intact with the GQI model compared to DTI. Figure 4 demonstrated histology staining to validate with DTI and GQI. Both H&E and Masson’s trichrome staining showed more complicated tubular microstructures in OM and CO regions. Figure 5 showed renal tubule changes in CKD rats. The renal structure (5a and 5b, b0 images) was dramatically changed in CO, OM, and IM (white and red arrows) in the CKD rat. The tractography (c and d) with IM as the seeding area also showed apparent differences. Compared to the control rat, the 3D tubule architecture of the kidney has been largely disrupted in the CKD rat (yellow arrows).DISCUSSION
We found that FA and MD are strongly dependent on the number of DWIs. The FA value in CO could be overestimated with 6 DWIs (minimal directions for basic tensor model), additional gradient directions can significantly improve the robustness of the FA measurements. FA could only obtain consistent results with 24 or more DWIs in OM and CO, which suggested the importance of the high angular resolution to quantify the tubular anisotropy and alignment in different parts of the kidney. Compared to FA, MD showed consistent results with more than 6 DWIs in IM, OM, and CO. This less sensitivity to the angular resolution suggested that MD could be a promising and reliable imaging biomarker for renal DTI studies. IM possessed one tubular direction which suggested a more uniform direction. The lower FA values in OM and CO might be due to the complicated tubule distributions.CONCLUSION
Higher angular resolution can significantly reduce the variations of DTI metrics. The tractography results could be further improved using GQI, which can resolve the complex tubule structures throughout the kidney.Acknowledgements
This research work was supported by NIH R01NS125020, Indiana Center for Diabetes and Metabolic Diseases Pilot and Feasibility Grant, and Strategic Research Initiative (SRI) IUH and Indiana University School of Medicine.References
1. Hueper K, Hartung D, Gutberlet M, Gueler F, Sann H, Husen B, et al. Magnetic resonance diffusion tensor imaging for evaluation of histopathological changes in a rat model of diabetic nephropathy. Invest Radiol. 2012 Jul;47(7):430–7.
2. Notohamiprodjo M, Glaser C, Herrmann KA, Dietrich O, Attenberger UI, Reiser MF, et al. Diffusion tensor imaging of the kidney with parallel imaging: initial clinical experience. Invest Radiol. 2008 Oct;43(10):677–85.
3. DeLano MC, Cooper TG, Siebert JE, Potchen MJ, Kuppusamy K. High-b-value Diffusion-weighted MR Imaging of Adult Brain: Image Contrast and Apparent Diffusion Coefficient Map Features. AJNR Am J Neuroradiol. 2000;21(10):1830.
4. le Bihan D, Poupon C, Amadon A, Lethimonnier F. Artifacts and pitfalls in diffusion MRI. Journal of Magnetic Resonance Imaging. 2006 Sep;24(3):478–88.
5. Caruyer E, Lenglet C, Sapiro G, Deriche R. Design of Multishell Sampling Schemes with Uniform Coverage in Diffusion MRI. Magn Reson Med. 2013;69(6):1534.
6. Tournier JD, Calamante F, Connelly A. Determination of the appropriate b value and number of gradient directions for high-angular-resolution diffusion-weighted imaging. NMR Biomed. 2013 Dec;26(12):1775–86.
7. Yeh FC, Wedeen VJ, Tseng WYI. Generalized q-sampling imaging. IEEE Trans Med Imaging. 2010 Sep;29(9):1626–35.
8. Calamante F, Tournier JD, Jackson GD, Connelly A. Track-density imaging (TDI): Super-resolution white matter imaging using whole-brain track-density mapping. Neuroimage. 2010 Dec;53(4):1233–43.
Figures
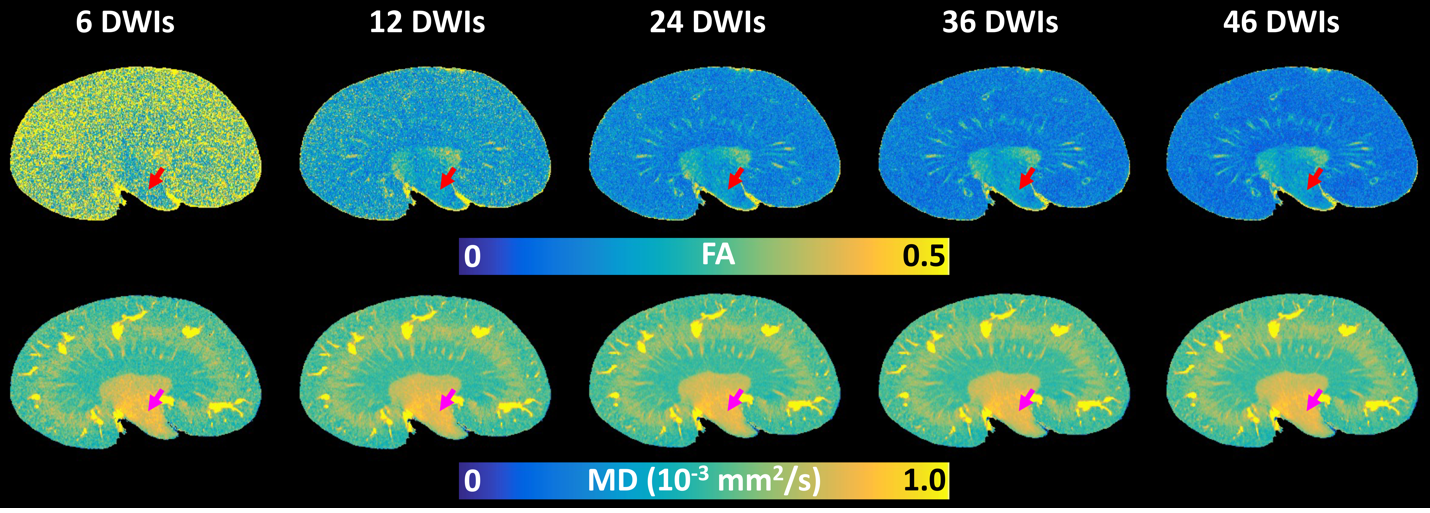
Figure 1. The FA and MD maps of the kidney with different DWIs. The FA values were higher with 6 DWIs (red arrows in IM). 6 DWI is the minimum requirement for a DTI model. In contrast, the MD maps (purple arrows in IM) showed less variation. FA maps showed less variability with more than 24 DWIs. FA and MD maps with 46 DWIs served as the ground truth. (IM: internal medullar; DWI: diffusion-weighted image; FA: fractional anisotropy; MD: mean diffusivity).