1295
Functional MRI to monitor disease progression in patients with rare kidney disease1Bioengineering Department, Istituto di Ricerche Farmacologiche Mario Negri IRCCS, Ranica (BG), Italy, 2Department of rare diseases, Istituto di Ricerche Farmacologiche Mario Negri IRCCS, Ranica (BG), Italy, 3Unit of Radiology, ASST Papa Giovanni XXIII, Bergamo, Italy, 4Unit of Nephrology and Dialysis, ASST Papa Giovanni XXIII, Bergamo, Italy, 5Department of Molecular Medicine, Istituto di Ricerche Farmacologiche Mario Negri IRCCS, Bergamo, Italy, 6Istituto di Ricerche Farmacologiche Mario Negri IRCCS, Bergamo, Italy, 7University of Bergamo, Bergamo, Italy
Synopsis
Keywords: Kidney, Quantitative Imaging
This study investigates the correlation between MRI and histologic and clinical findings in 7 patients with C3 glomerulopathy and immune complex–associated membranoproliferative glomerulonephritis, rare diseases denoted by poor prognosis and no specific therapies. Patients underwent repeated kidney MRI, biopsy, and laboratory testing. Kidney diffusivity and perfusion were assessed by diffusion-weighted and phase-contrast MRI. Laboratory and MRI parameters changed very differently from case to case over 1 year. Perfusion biomarkers significantly correlated with histological and clinical findings. Both perfusion and diffusion biomarkers correlated with the clinical evolution of the disease. Current findings highlight MRI potential to monitor kidney disease progression.Introduction
C3 glomerulopathy (C3G) and immune complex–associated membranoproliferative glomerulonephritis (IC-MPGN) are rare diseases with poor prognosis and no specific therapies1-3. Several drugs are currently under investigation for C3G and IC-MPGN, however, clinical trials are challenging and heavily influenced by the heterogeneity of these diseases. Repeated kidney biopsies would be needed to accurately monitor disease progression and response to treatment over time, but they are limited by the risk of complications, hard acceptance by patients, and sampling bias. Recent advances in functional renal MRI techniques have allowed to generate quantitative imaging biomarkers potentially improving the management of kidney diseases4. Diffusion weighted MRI (DWI) has been increasingly used to assess renal microstructural damage even before renal function loss, to predict renal function decline, and to follow microstructure changes occurring in response to treatment in chronic kidney disease (CKD)5. In addition, phase-contrast MRI (PC-MRI) allows to assess renal perfusion, providing complementary information6. This study investigates the correlation between MRI parameters and histologic and clinical markers of disease course in patients with C3G or IC-MPGN, providing evidence of MRI clinical validity in monitoring these rare kidney diseases.Methods
Seven patients (18[17-21] years, 43% females) with C3G or IC-MPGN who underwent repeated non-contrast enhanced kidney MRI in addition to biopsy and clinical and laboratory evaluation, before and after 1 year of treatment with danicopan, in the context of a clinical trial (clinicaltrials.gov ID NCT03723512) were included. DWI and PC-MRI were used to investigate kidney diffusivity and perfusion. DWI signal was interpreted by a segmented fitted biexponential approach allowing to compute pure diffusion - D, pseudo-diffusion - D*, and flowing fraction - F, using in-house Matlab software. The renal artery average velocity profile was computed from PC-MRI and blood flow was averaged over all phases. Total renal artery blood flow (RBF) was computed as sum of left and right RBF. Derivative parameters were computed as follows: renal plasma flow (RPF) = RBF * (1 – hematocrit); filtration fraction (FF) = GFR/RPF*100; and renal vascular resistance (RVR) = mean arterial pressure / RPF. The correlations between MRI and histologic and clinical findings were investigated by Spearman’s correlation.Results
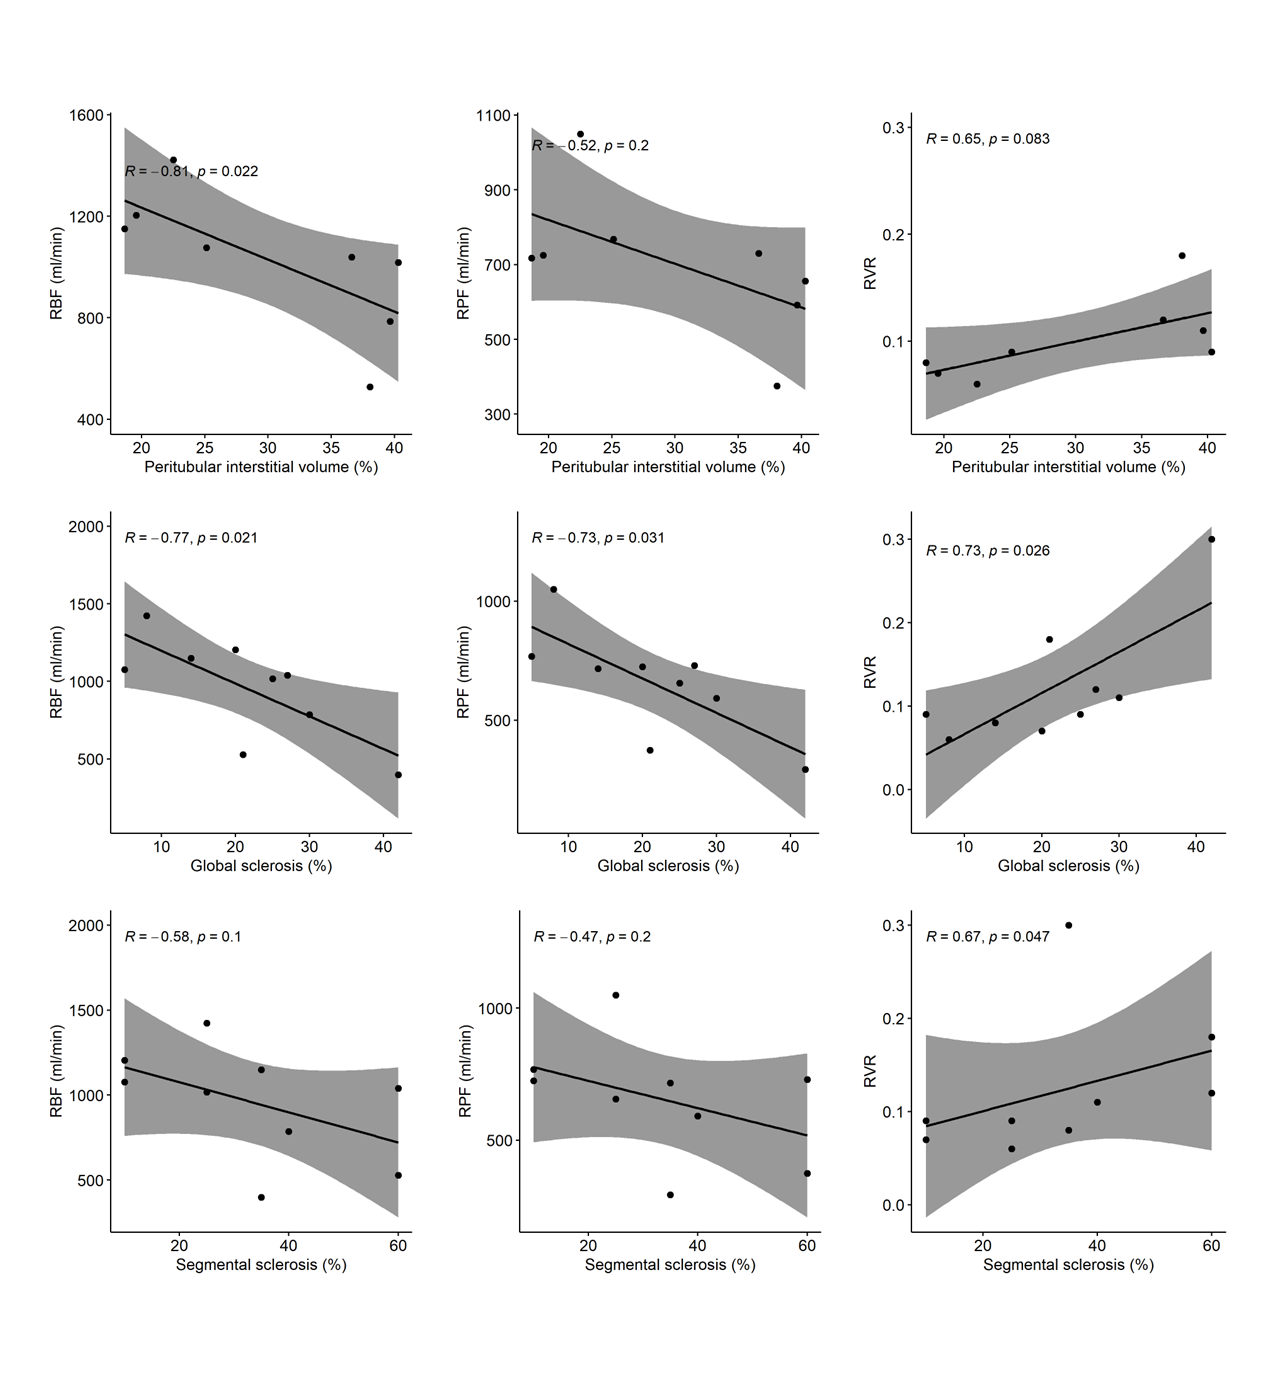
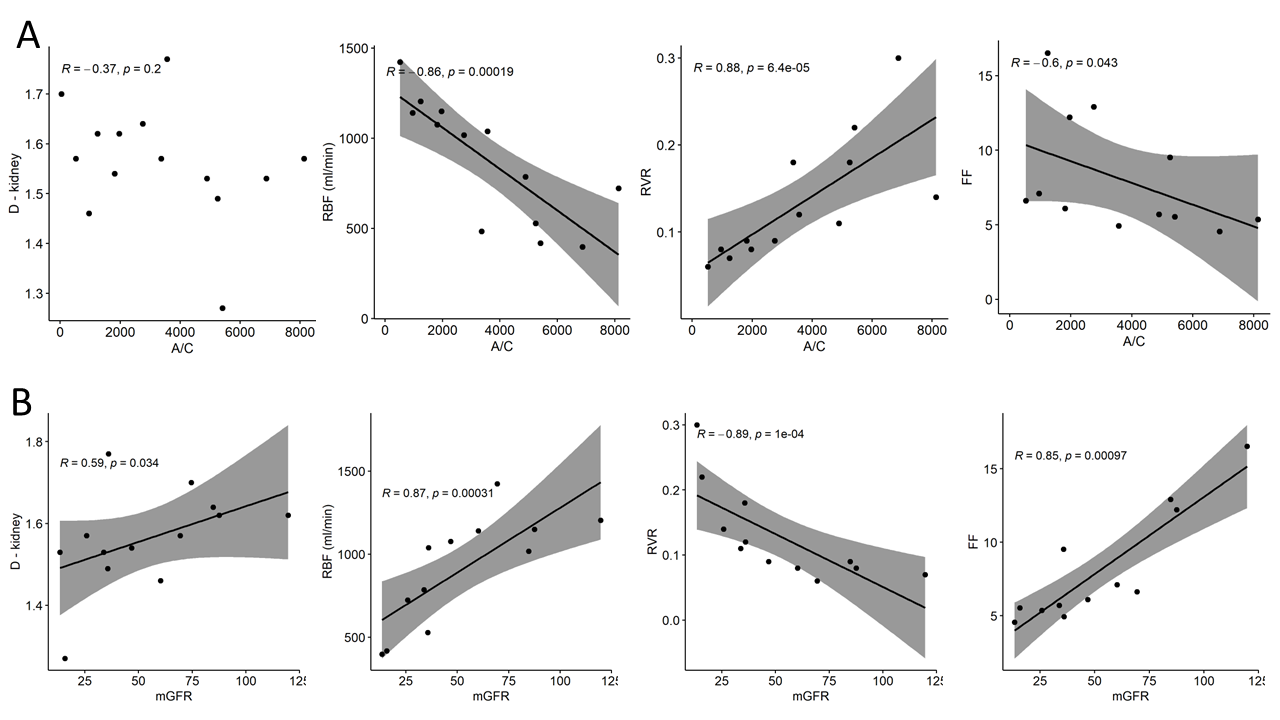
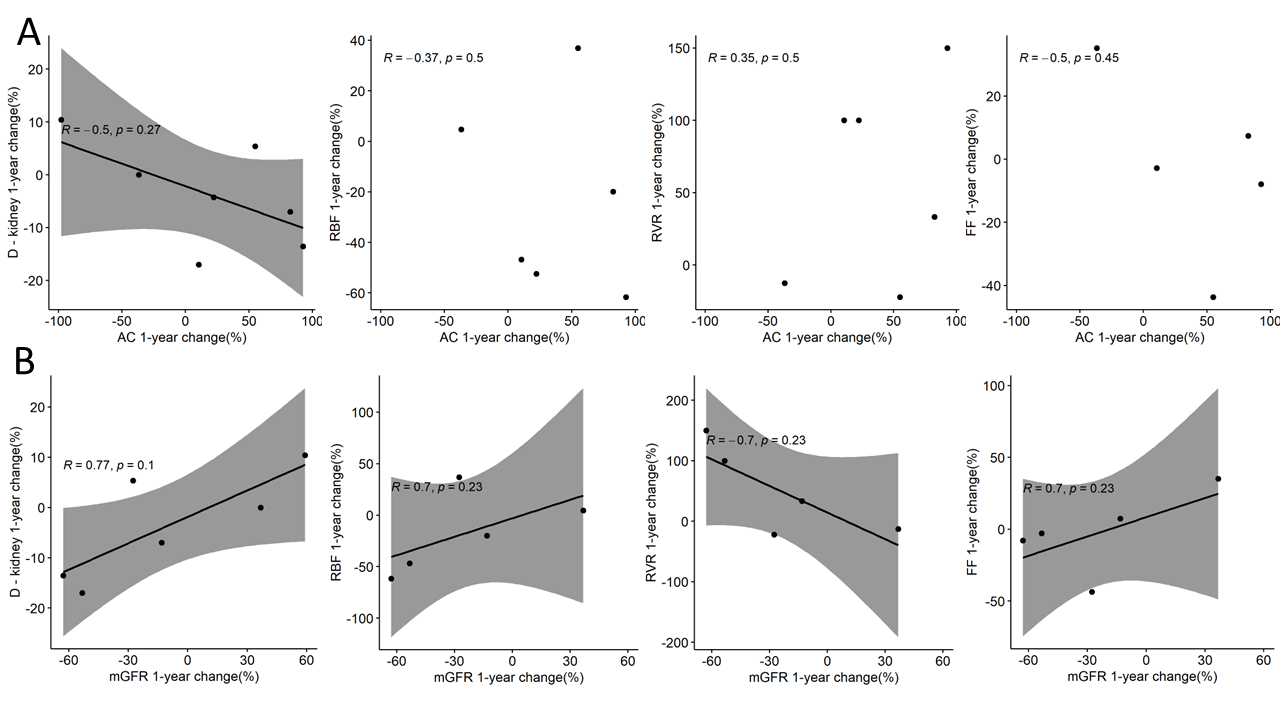
Kidney biopsies showed variable degree of global and segmental glomerular sclerosis ([5-30]% and [10-60]% respectively), mild interstitial fibrosis (<10%), and increased peritubular interstitial volume ([19-40]%). Peritubular interstitial volume, global and segmental glomerular sclerosis, assessed at all available time points, were negatively associated with RBF (rho =-0.81, p=0.022; rho = -0.77, p=0.021; and rho = -0.58, p=0.100, respectively) and RPF (rho=-0.52, p=0.200; rho = -0.73, p=0.031; and rho = -0.47, p=0.200, respectively) and positively associated with RVR (rho=0.65, p=0.083; rho = 0.73, p=0.026; and rho = 0.67, p=0.047) (Figure 1). No significant correlation was found between any MRI parameter and interstitial fibrosis. The albumin to creatinine ratio (A/C) was negatively associated with RBF and FF (rho=-0.86, p<0.001 and rho=-0.6, p=0.043, respectively), while positively correlated with RVR (rho=0.88, p<0.001). No correlation was found between A/C and diffusivity at individual time points (Figure 2A). Measured glomerular filtration rate (GFR) was positively associated with diffusivity in the kidney (rho=0.59, p=0.034), with RBF and FF (rho=0.87, p<0.001 and rho=0.85, p<0.001), while negatively correlated with RVR (rho=-0.89, p<0.001) (Figure 2B). Considering the disease course in individual patients, a decrease in A/C after 1 year follow-up was associated with an increase in kidney diffusivity (rho=-0.5, p=0.27) (Figure 3A). An increase in mGFR was associated with an increase in kidney diffusivity (rho=0.77, p=0.1), RBF and FF (rho=0.7, p=0.23 in both cases), and with a decrease in RVR (rho=-0.7, p=0.23) (Figure 3B).Discussion
Measured GFR and A/C was associated with functional MRI markers, reflecting renal damage and parenchymal changes, in line with a previous study7. Among the histologic parameters, global and segmental glomerular sclerosis were associated with perfusion parameters, indicating a possible detrimental effect of these histologic features on renal function. The significant association found between MRI-based perfusion parameters and peritubular interstitial volume suggests that the latter could represent a possible therapeutic target. Despite several cross-sectional studies5,6, longitudinal evidence of DWI or PC-MRI clinical validity in monitoring kidney disease progression is still limited8-12. Current findings are in line with a recent study showing a good correlation between multiparametric MRI and renal function biomarkers in healthy volunteers and patients with CKD13. Limitations of this study include the small number of patients, still significant due to the rarity of the disease, and the lack of follow-up biopsies, that did not allow to investigate the correlation between changes in MRI biomarkers and changes in histologic parameters.Conclusion
Functional MRI biomarkers significantly correlated with histologic and clinical findings in rare kidney disease patients with very different disease course, suggesting that functional MRI could replace repeated biopsy for monitoring kidney disease progression. Future larger studies are needed to confirm current findings and demonstrate the benefit and cost effectiveness of multiparametric MRI in kidney disease management.Acknowledgements
This study was supported in part by Alexion Pharmaceuticals, Boston, Massachusetts, USA, and by the Italian Ministry of Health, under the frame of ERAPerMed (ERAPERMED2020-326 - RESPECT).References
1. Cook HT, Pickering MC: Histopathology of MPGN and C3 glomerulopathies. Nat Rev Nephrol 11: 14–22, 2015
2. Iatropoulos P, Daina E, Curreri M, Piras R, Valoti E, Mele C, Bresin E, Gamba S, Alberti M, Breno M, Perna A, Bettoni S, Sabadini E, Murer L, Vivarelli M, Noris M, Remuzzi G: Cluster Analysis Identifies Distinct Pathogenetic Patterns in C3 Glomerulopathies/Immune Complex–Mediated Membranoproliferative GN. J Am Soc Nephrol 29: 283–294, 2018
3. Servais A, Noël L-H, Roumenina LT, Le Quintrec M, Ngo S, Dragon-Durey M-A, Macher M-A, Zuber J, Karras A, Provot F, Moulin B, Grünfeld J-P, Niaudet P, Lesavre P, Frémeaux-Bacchi V: Acquired and genetic complement abnormalities play a critical role in dense deposit disease and other C3 glomerulopathies. Kidney Int 82: 454–464, 2012
4. Caroli A, Remuzzi A, Ruggiero B, Carrara C, Rizzo P, Brambilla P, Ruggenenti P, Remuzzi G: Functional Magnetic Resonance Imaging Versus Kidney Biopsy to Assess Response to Therapy in Nephrotic Syndrome: A Case Report. Kidney Med 2: 804–809, 2020
5. Caroli A, Schneider M, Friedli I, Ljimani A, De Seigneux S, Boor P, Gullapudi L, Kazmi I, Mendichovszky IA, Notohamiprodjo M, Selby NM, Thoeny HC, Grenier N, Vallée J-P: Diffusion-weighted magnetic resonance imaging to assess diffuse renal pathology: a systematic review and statement paper. Nephrol Dial Transplant 33: ii29–ii40, 2018
6. Villa G, Ringgaard S, Hermann I, Noble R, Brambilla P, Khatir DS, Zöllner FG, Francis ST, Selby NM, Remuzzi A, Caroli A: Phase-contrast magnetic resonance imaging to assess renal perfusion: a systematic review and statement paper. Magn Reson Mater Phys Biol Med 33: 3–21, 2020
7. Lomax-Browne HJ, Medjeral-Thomas NR, Barbour SJ, Gisby J, Han H, Bomback AS, Fervenza FC, Cairns TH, Szydlo R, Tan S-J, Marks SD, Waters AM, Appel GB, D’Agati VD, Sethi S, Nast CC, Bajema I, Alpers CE, Fogo AB, Licht C, Fakhouri F, Cattran DC, Peters JE, Cook HT, Pickering MC: Association of Histologic Parameters with Outcome in C3 Glomerulopathy and Idiopathic Immunoglobulin-Associated Membranoproliferative Glomerulonephritis. Clin J Am Soc Nephrol 17: 994–1007, 2022
8. Berchtold L, Friedli I, Crowe LA, Martinez C, Moll S, Hadaya K, de Perrot T, Combescure C, Martin P-Y, Vallée J-P, de Seigneux S: Validation of the corticomedullary difference in magnetic resonance imaging-derived apparent diffusion coefficient for kidney fibrosis detection: a cross-sectional study. Nephrol Dial Transplant 35: 937–945, 2020
9. Berchtold L, Crowe LA, Combescure C, Kassaï M, Aslam I, Legouis D, Moll S, Martin P-Y, de Seigneux S, Vallée J-P: Diffusion-Magnetic Resonance Imaging predicts decline of kidney function in chronic kidney disease and in patients with a kidney allograft. Kidney Int S0085253821012151, 2022
10. Srivastava A, Cai X, Lee J, Li W, Larive B, Kendrick C, Gassman JJ, Middleton JP, Carr J, Raphael KL, Cheung AK, Raj DS, Chonchol MB, Fried LF, Block GA, Sprague SM, Wolf M, Ix JH, Prasad PV, Isakova T: Kidney Functional Magnetic Resonance Imaging and Change in eGFR in Individuals with CKD. Clin J Am Soc Nephrol 15: 776–783, 2020
11. Khatir DS, Pedersen M, Ivarsen P, Christensen KL, Jespersen B, Buus NH: Effects of additional vasodilatory or nonvasodilatory treatment on renal function, vascular resistance and oxygenation in chronic kidney disease: a randomized clinical trial. J Hypertens 37: 116–124, 2019
12. Torres VE, King BF, Chapman AB, Brummer ME, Bae KT, Glockner JF, Arya K, Risk D, Felmlee JP, Grantham JJ, Guay-Woodford LM, Bennett WM, Klahr S, Meyers CM, Zhang X, Thompson PA, Miller JP: Magnetic Resonance Measurements of Renal Blood Flow and Disease Progression in Autosomal Dominant Polycystic Kidney Disease. Clin J Am Soc Nephrol 2: 112–120, 2007
13. Buchanan CE, Mahmoud H, Cox EF, McCulloch T, Prestwich BL, Taal MW, Selby NM, Francis ST: Quantitative assessment of renal structural and functional changes in chronic kidney disease using multi-parametric magnetic resonance imaging. Nephrol Dial Transplant 35: 955–964, 2020
Figures