1294
Renal impairment characterization of patients with systemic sclerosis by multi-parametric magnetic resonance imaging1School of Clinical Medicine, Tsinghua University, Beijing, China, 2Department of Rheumatology and Clinical Immunology, Chinese Academy of Medical Sciences & Peking Union Medical College, Beijing, China, 3Center for Biomedical Imaging Research, Tsinghua University, Beijing, China
Synopsis
Keywords: Kidney, Kidney, systemic sclerosis
Renal microstructure and functional impairment in systemic sclerosis were characterized using multi-parametric quantitative MR imaging including SAMURAI, DWI and BOLD sequences. The mean values of T1, RBF, aBAT, tBAT, ADC, T2* in renal cortex and volume of renal parenchyma were quantified. Compared to healthy volunteers, patients with systemic sclerosis had significantly lower mean RBF values in both sides of renal cortex. This study revealed that decline of RBF in systemic sclerosis may indicate the pathology of microvascular impairment of renal tissues.Introduction
Systemic sclerosis (SSc) is one of the systemic autoimmune diseases. SSc frequently lead to fibrosis of skin and multiple organs including lung and kidney1. It has been shown that 2-15% of SSc patients suffered from scleroderma renal crisis (SRC). As a life-threatening complication, SRC is characterized by acute accelerated hypertension and renal failure2. The diagnosis of SRC depends on clinical characteristics including hypertension, proteinuria, and hematuria3. However, microstructural and functional impairment of kidneys may occur prior to clinical symptoms. This study aimed to characterize renal microstructure and functional impairment in SSc patients using multi-parametric quantitative MR imaging.Methods
Study sample: Patients who were diagnosed with SSc and age- and sex-matched healthy volunteers were recruited and underwent renal MR imaging. Clinical characteristics of patients were collected. The study protocol was approved by institutional review board and written consent form was obtained from all patients and healthy volunteers. MR imaging protocol: Renal MR imaging was performed on a 3T MR scanner (Ingenia CX, Philips Healthcare, Netherlands) with a 16-channel dStream Torso coil and a 12-channel embedded posterior coil. The MR renal imaging protocol includes diffusion weighted imaging (DWI), blood oxygen level dependent (BOLD) and saturated multi-delay renal arterial spin labeling (SAMURAI) proposed by our group4. Detailed parameters of the imaging protocol are listed in Table 1. MR Image post-processing: For SAMURAI images, Elastix was utilized to minimize the effects of respiratory motion on renal images analysis. During registration, a non-rigid principal component analysis-based (PCA-based) group-wise strategy with B-spline interpolator was applied5, 6. From the registered images, the T1 map was estimated by a dictionary searching-based method generated according to Bloch simulation of MR signal. Meanwhile, renal blood flow (RBF), arterial bolus arrival time (aBAT), and tissue BAT (tBAT) were quantified by stepwise kinetic model proposed in our previous study4. After parametric mapping, the renal cortex regions of interests (ROIs) were manually extracted from T1 mapping images and the mean values of T1 and three perfusion quantitative parameters were recorded. All above procedures were completed by in-home program on Matlab R2022a (Mathworks, Natick, MA). For DWI, volumetric and mean ADC values were calculated on renal parenchyma by 3D slicer. For BOLD, mean T2* values of renal cortex were recorded from one center slice. The illustration of whole post-processing analysis is shown in Figure 1. Statistical analysis: Mann-Whitney U test was utilized to compare the renal quantitative measurements between SSc patients and healthy volunteers. The statistical analyses were conducted using SPSS 27.0 (SPSS Inc. Chicago, IL, USA).Results
A total of 30 patients (mean age: 48.1 ± 13.1 years, 4 males) and 8 healthy volunteers (mean age: 52.9 ± 13.1 years, 1 male) were enrolled. Figure 2 presents the comparison results of renal quantitative measurements between SSc patients and healthy volunteers. Compared to healthy volunteers, SSc patients had significantly lower mean RBF values in both sides of renal cortex (right cortex: 232.6 ± 63.2 ml/100g/min vs. 294.8 ± 42.8 ml/100g/min, p=0.010; left cortex: 204.4 ± 69.4 ml/100g/min vs. 274.1 ± 42.4 ml/100g/min, p=0.007). No significant differences were found in renal ADC, aBAT, and tBAT between SSc patients and healthy volunteers (all p >0.05). Figure 3 shows the T1 maps and quantitative images of RBF, aBAT, tBAT of three SSc patients (two with occurred SRC) and one healthy volunteer. In this figure, slightly higher overall T1 values and significantly lower RBF values were found in SSc patients compared with healthy volunteer, especially for the first patient with 4-year renal crisis.Discussion and Conclusion
We found that, among microstructural and functional measurements, RBF was found to be an effective indicator for discriminating SSc patients from healthy subjects. In this study, an imaging sequence proposed by our group was used and this sequence has been demonstrated to be reproducible in measuring RBF and T1 values4. Since the injury of vascular endothelial cells, renal vasospasm and “renal Raynaud” may decrease renal cortical blood flow7, SSc patients would have lower RBF and more severe renal fibrosis ahead of clinical symptoms. Therefore, our finding of decline of RBF in SSc may indicate the pathology of microvascular impairment8 of renal tissues. Future studies are warranted to further investigate the characteristics of renal microstructure and function with larger sample size of SSc patients.Acknowledgements
No acknowledgement found.References
1. Denton CP, Khanna D. Systemic sclerosis. Lancet. 2017; 390(10103):1685-1699.
2. Woodworth TG, Suliman YA, Li W, et al. Scleroderma renal crisis and renal involvement in systemic sclerosis. Nat Rev Nephrol. 2016; 12(11):678-691.
3. Zanatta E, Polito P, Favaro M, et al. Therapy of scleroderma renal crisis: State of the art. Autoimmun Rev. 2018;17(9):882-889.
4. Ning Z, Chen S, Chen Z, et al. Saturated multi-delay renal arterial spin labeling technique for simultaneous perfusion and T1 quantification in kidneys. Magn Reson Med. 2022; 88(3):1055-1067.
5. Klein S, Staring M, Murphy K, et al. Elastix: a toolbox for intensity-based medical image registration. IEEE Trans Med Imaging. 2010; 29:196-205.
6. Huizinga W, Poot DH, Guyader JM, et al. PCA-based groupwise image registration for quantitative MR imaging. Med Image Anal. 2016; 29:65-78.
7. Bose N, Chiesa-Vottero A, Chatterjee S. Scleroderma renal crisis. Semin Arthritis Rheum. 2015;44(6):687-694.
8. Saygin D, Highland KB, Tonelli AR. Microvascular involvement in systemic sclerosis and systemic lupus erythematosus. Microcirculation. 2019;26(3):e12440.
Figures
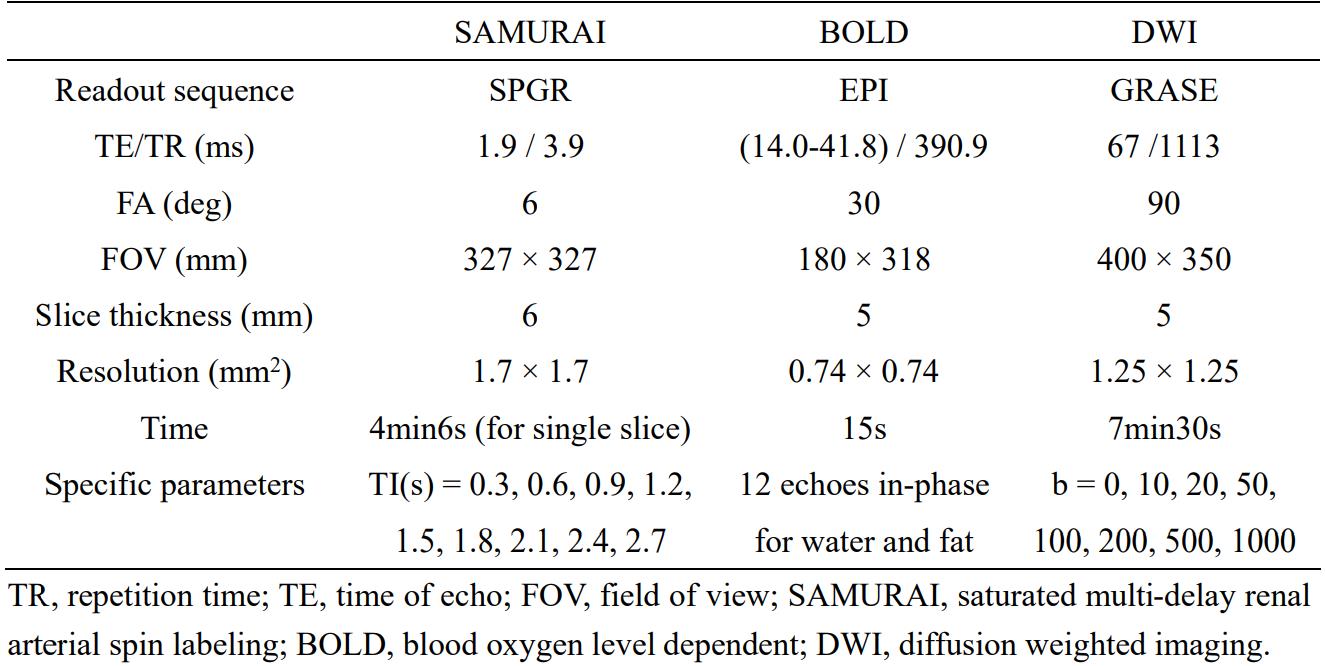
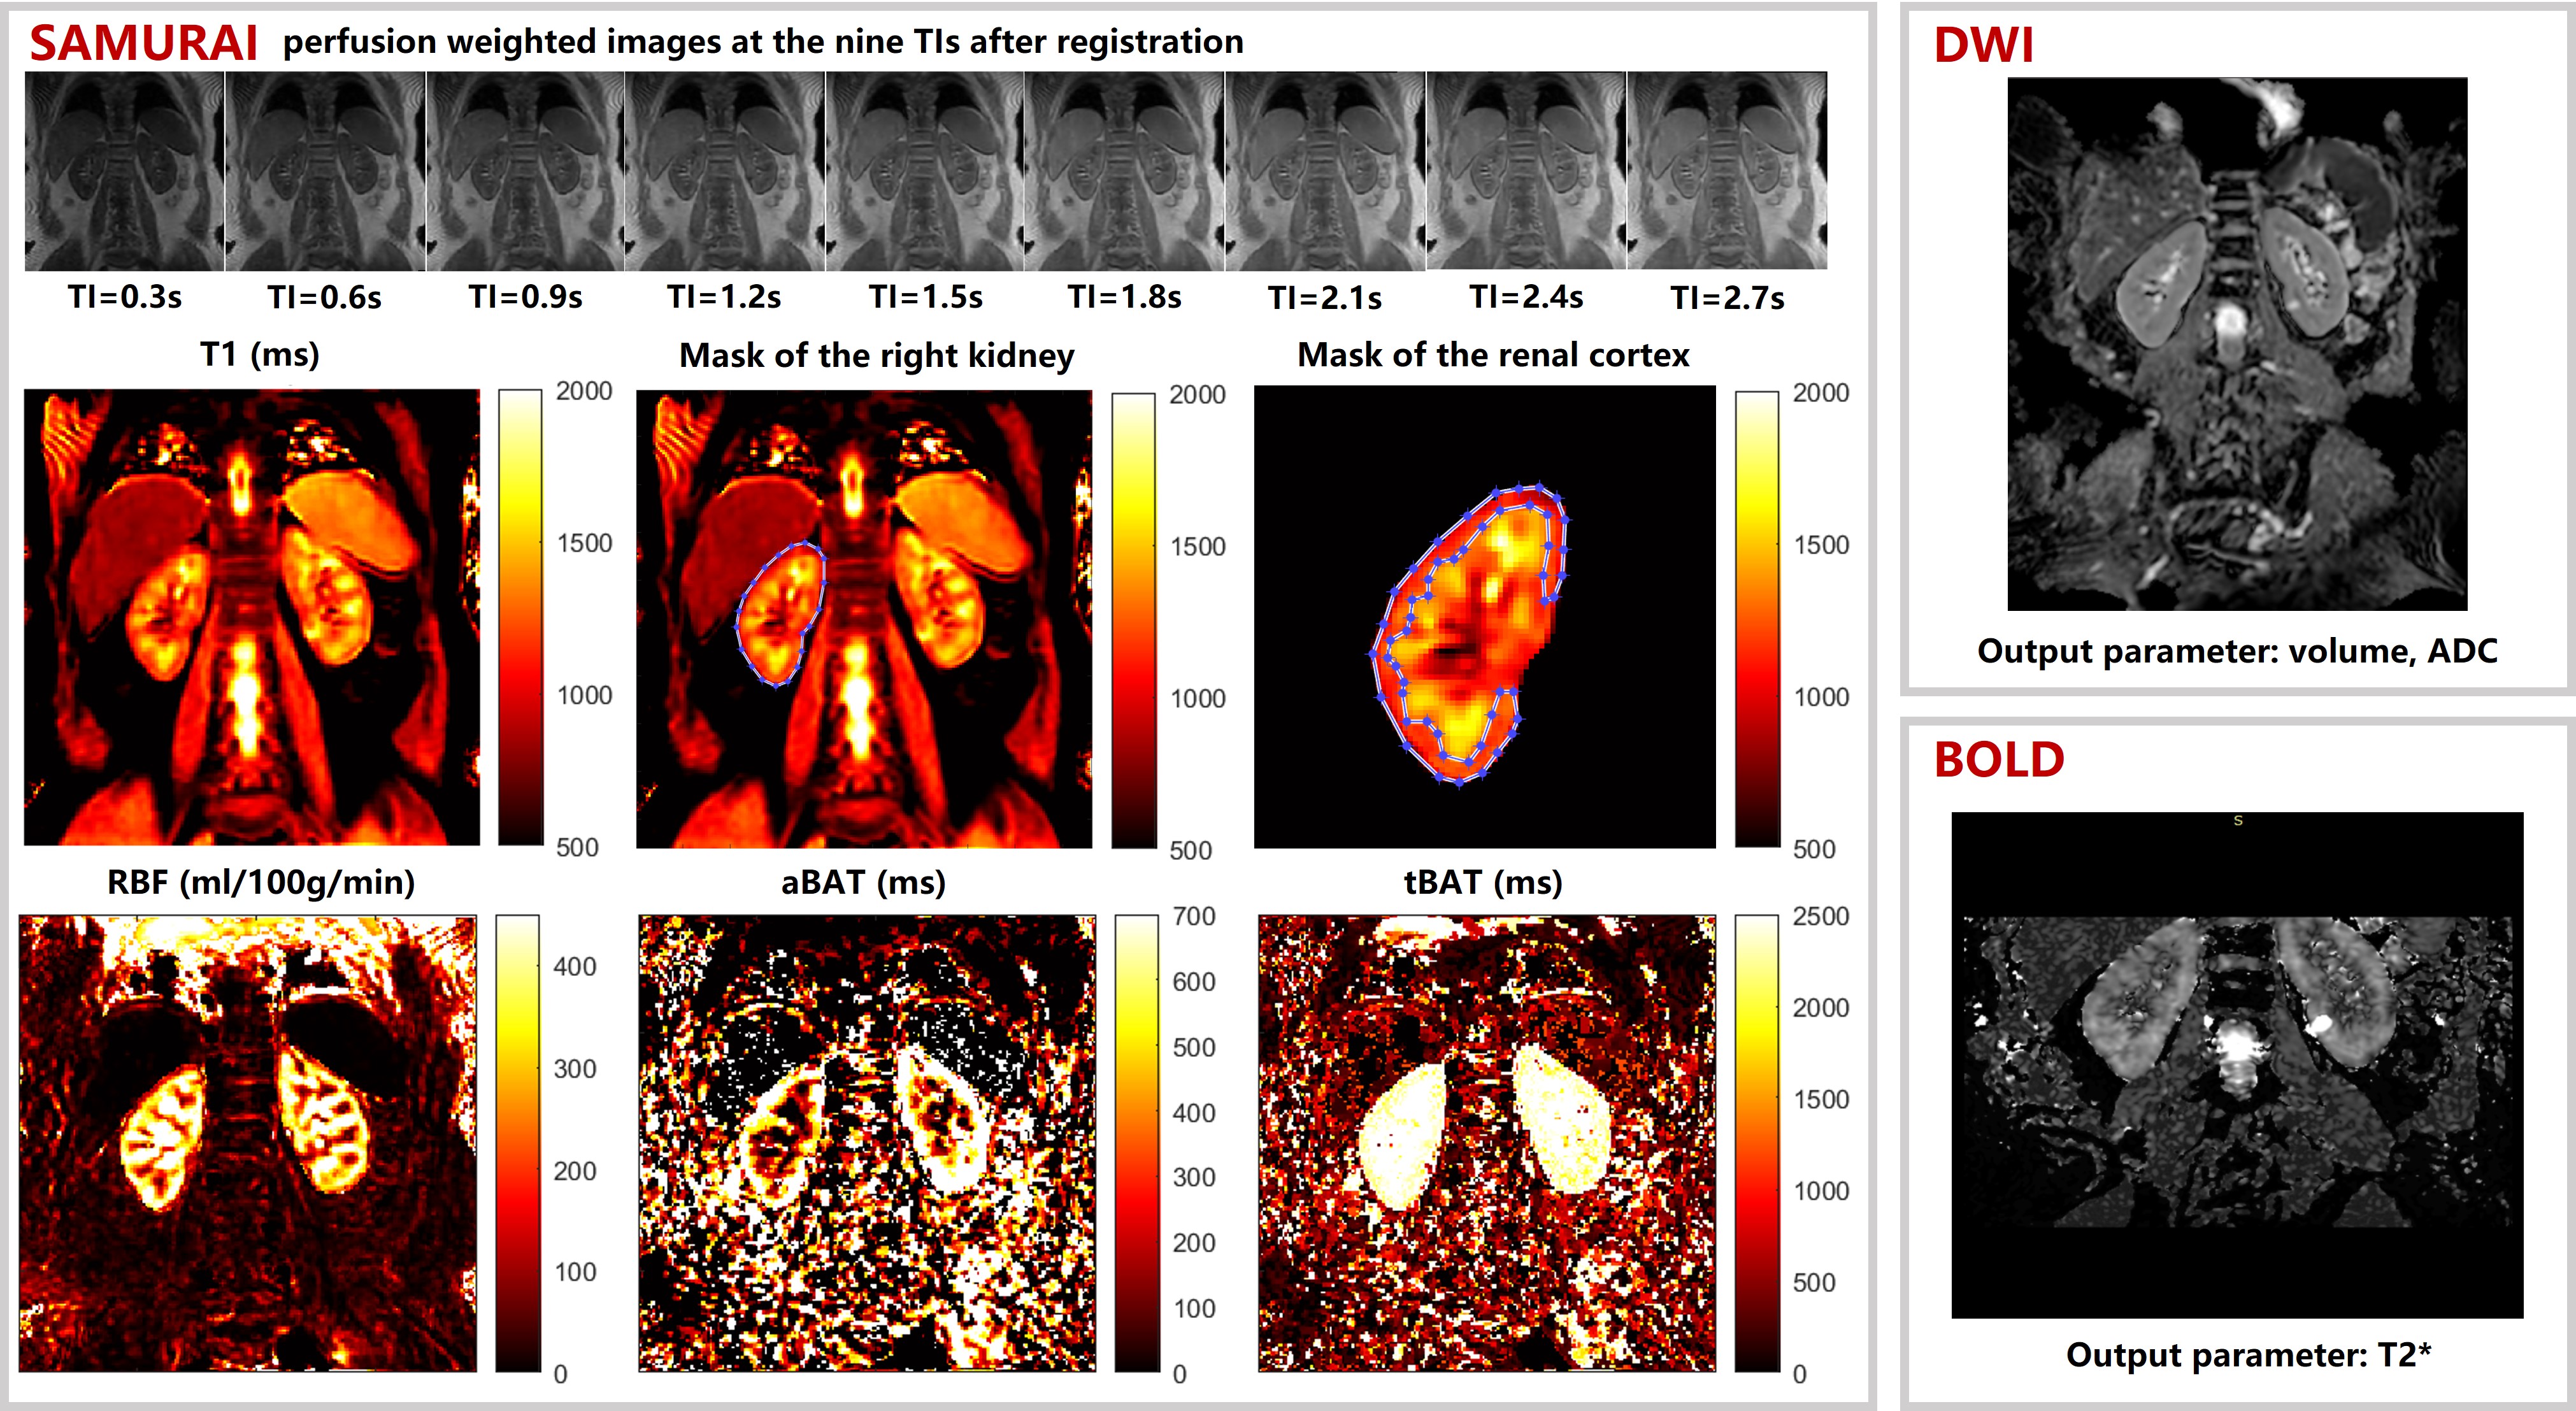
Figure 1. Multi-parametric quantitative MR imaging (SAMURAI, DWI, BOLD), parametric mapping results (from SAMURAI) and renal cortex mask of a healthy volunteer.
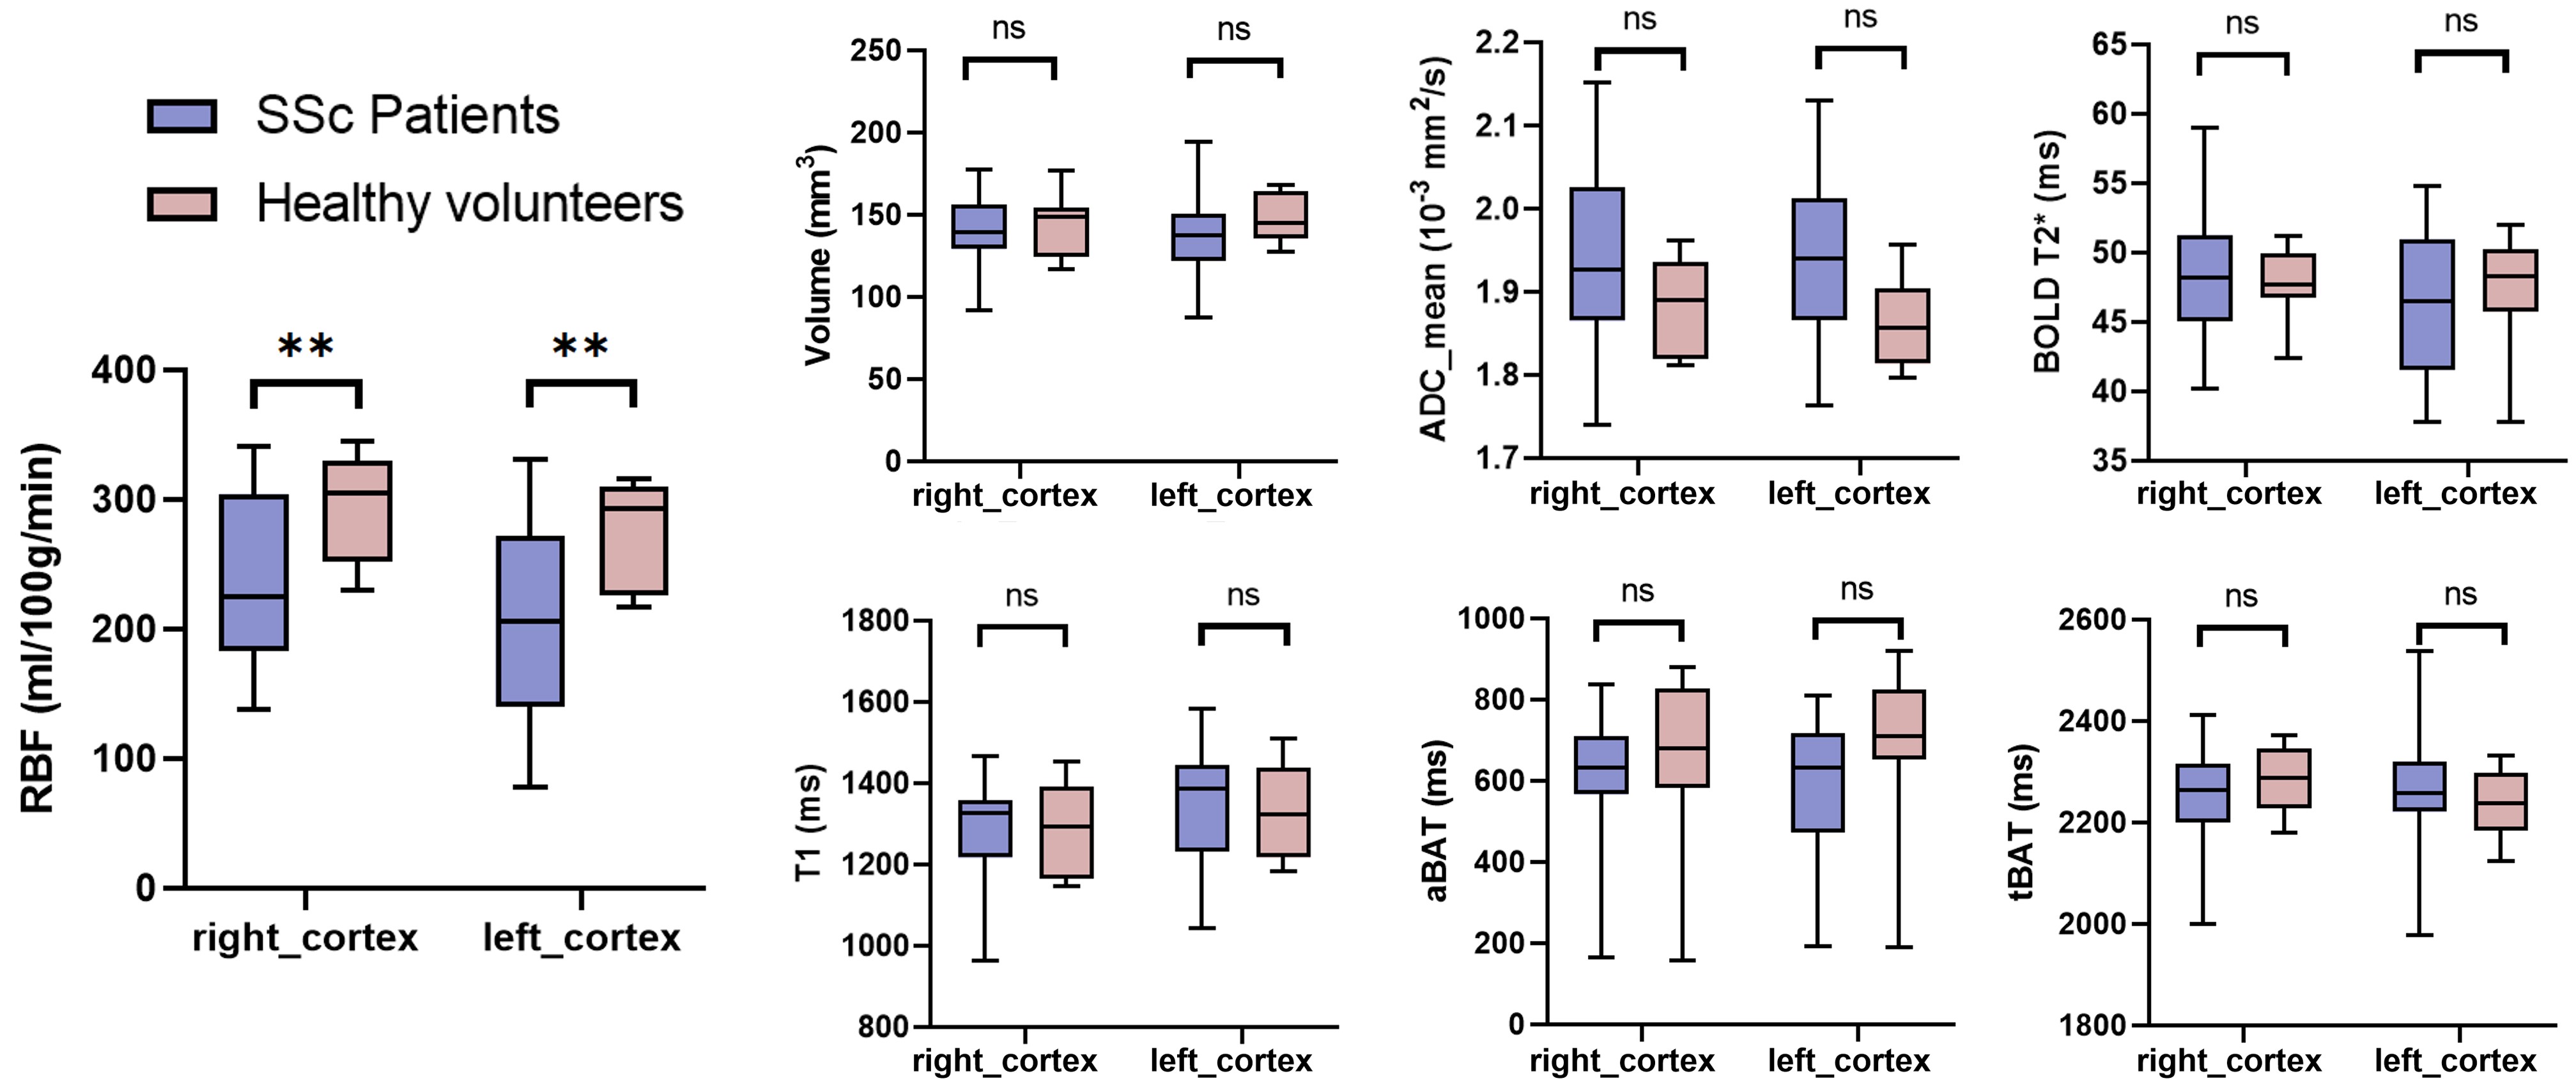
Figure 2. Comparison of quantitative parameters between SSc patients and healthy volunteers.
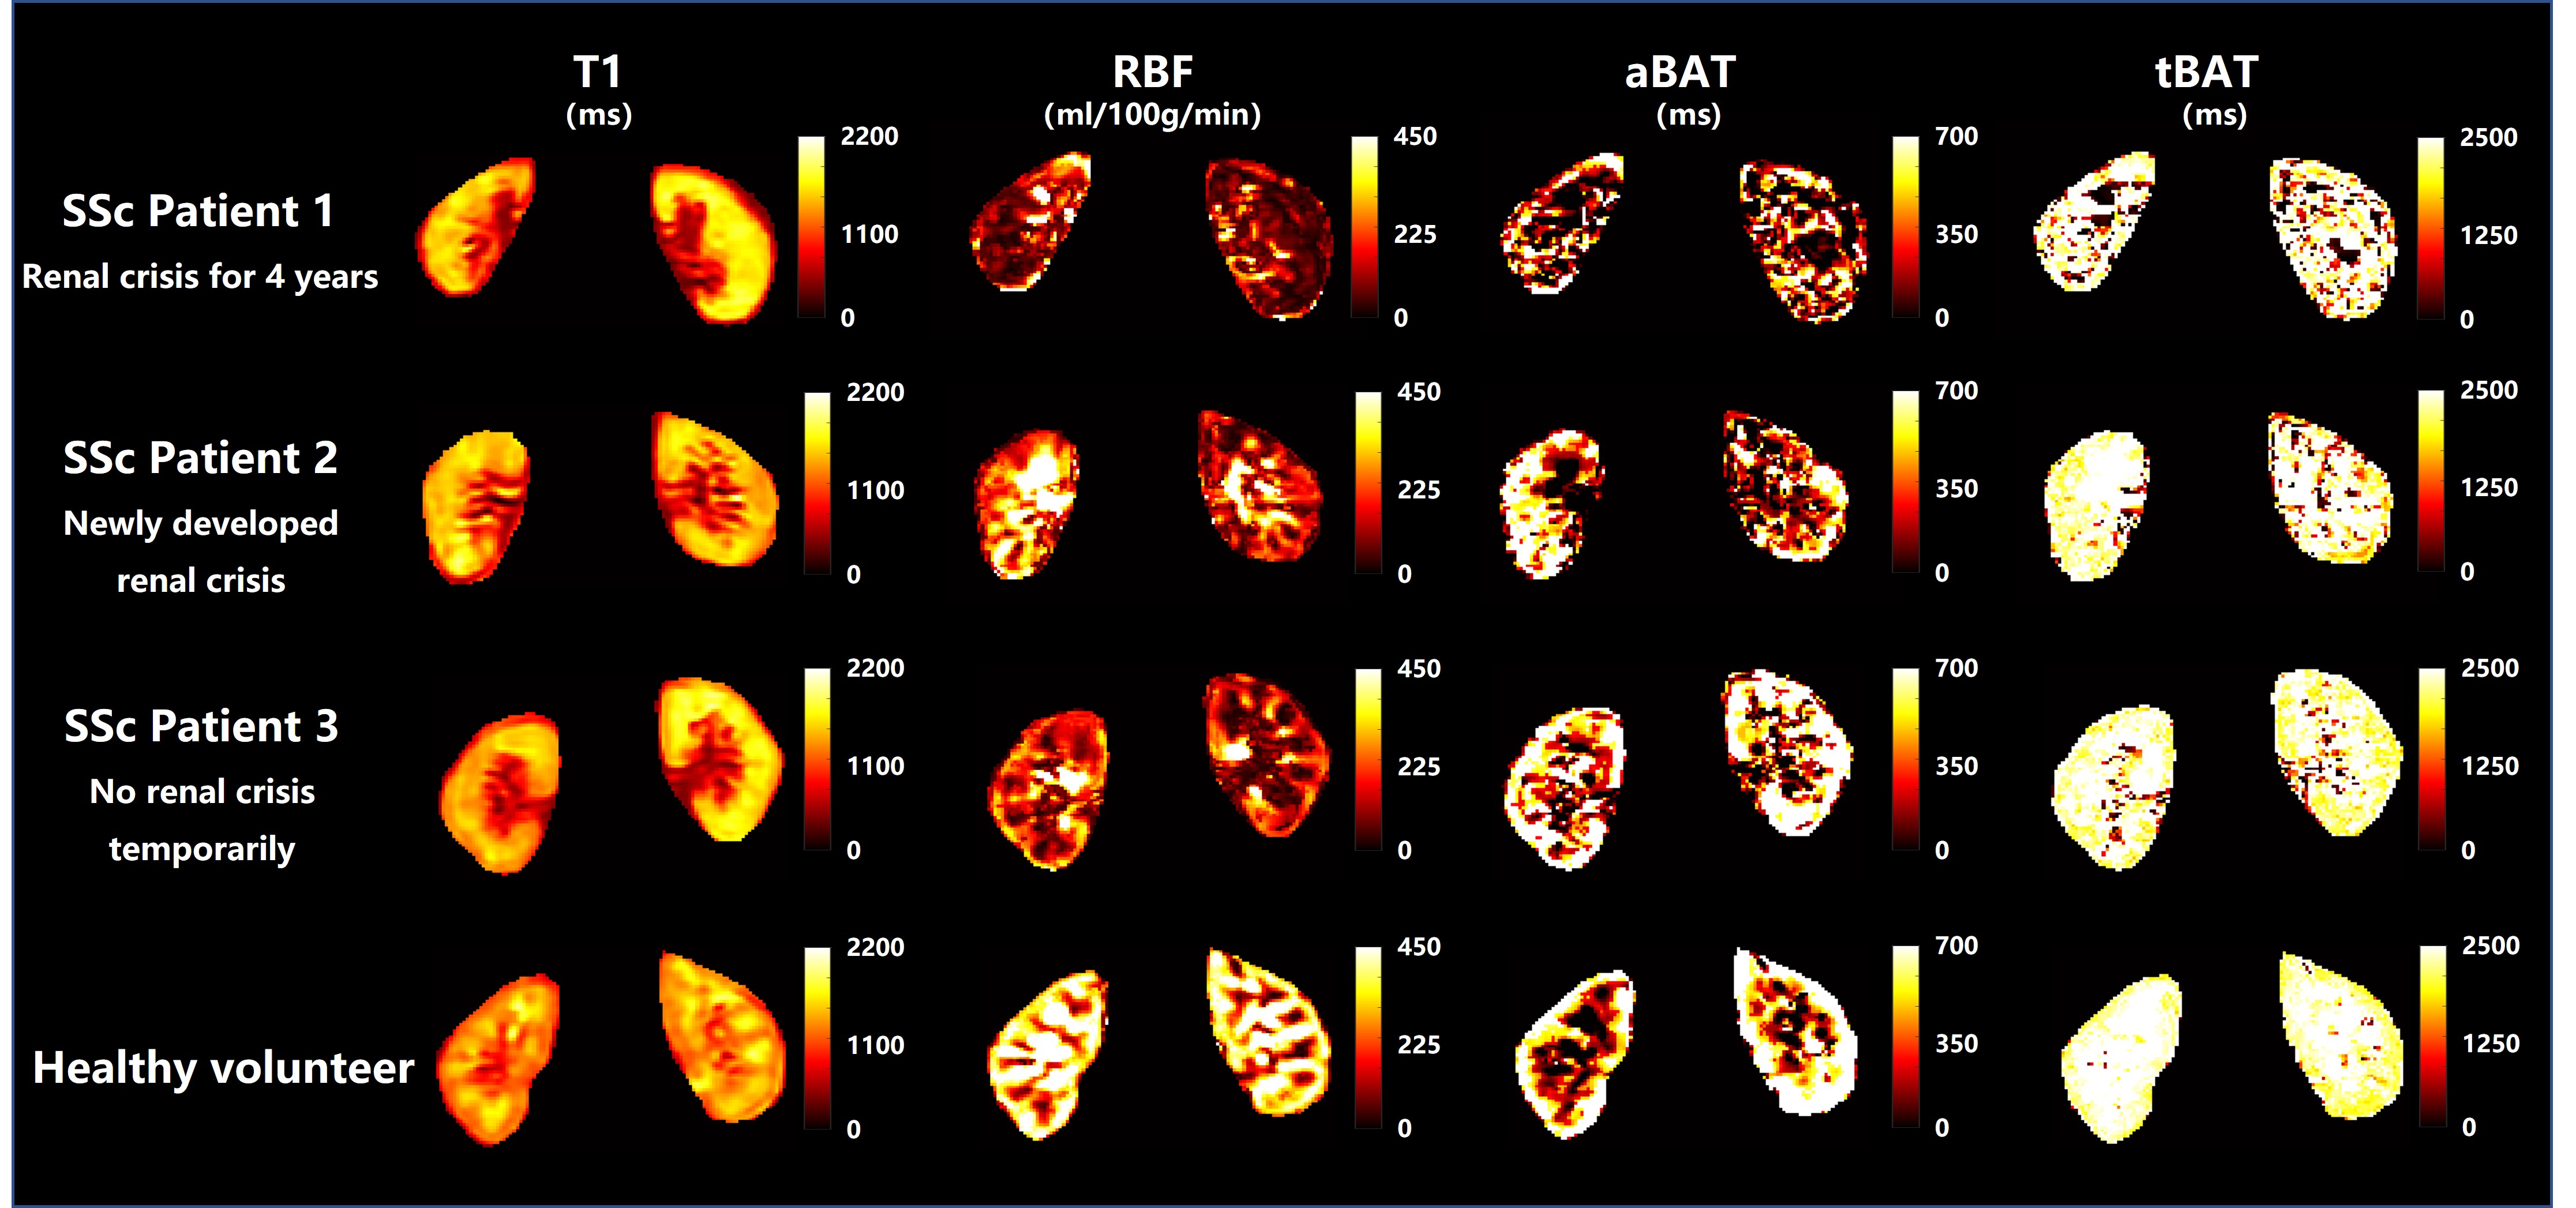
Figure 3. The T1 maps and quantitative images of RBF, aBAT, tBAT obtained by SAMURAI in three SSc patients (two with occurred SRC) and one healthy volunteer.