1293
Potential of multiparametric MRI in the longitudinal assessment of renal allografts after transplantation
Rebeca Echeverria-Chasco1,2, Paloma L. Martin-Moreno2,3, Nuria Garcia-Fernandez2,3, Marta Vidorreta4, Leyre Garcia-Ruiz1, Anne Oyarzun5, Arantxa Villanueva Larre2,5,6, Gorka Bastarrika1,2, and Maria A. Fernández-Seara1,2
1Radiology, Clinica Universidad de Navarra, Pamplona, Spain, 2IdiSNA, Instituto de Investigación Sanitaria de Navarra, Pamplona, Spain, 3Nephrology, Clinica Universidad de Navarra, Pamplona, Spain, 4Siemens Healthcare, Madrid, Spain, 5Electrical Electronics and Communications Engineering, Public University of Navarre, Pamplona, Spain, 6ISC, Institute of Smart Cities, Pamplona, Spain
1Radiology, Clinica Universidad de Navarra, Pamplona, Spain, 2IdiSNA, Instituto de Investigación Sanitaria de Navarra, Pamplona, Spain, 3Nephrology, Clinica Universidad de Navarra, Pamplona, Spain, 4Siemens Healthcare, Madrid, Spain, 5Electrical Electronics and Communications Engineering, Public University of Navarre, Pamplona, Spain, 6ISC, Institute of Smart Cities, Pamplona, Spain
Synopsis
Keywords: Kidney, Transplantation
A multiparametric MRI protocol (perfusion, diffusion and T1) was employed to assess longitudinally the kidney allograft at different time points after the transplatation (first week, 3rd month and one year after the surgery) in a 3T system. Patients were divided into stable and unstable function according to their evolution.
Results showed that GFR and RBF increased for patients with stable function and decreased for patients with unstable function, showing significant differences between groups at Exam 3.
In conclusion, multiparametric MRI can help to assess the allograft longitudinally and has the potential to predict allograft dysfunction when ASL measurements are included.
INTRODUCTION
Kidney transplantation is the treatment for patients with kidney failure that offers them a better-quality of life and better prognosis than dialysis1. However, long-term allograft loss is quite high2. Post-transplant complications can affect the long-term allograft evolution3,4. Thus, monitoring kidney function closely post-transplantation is crucial to detect and identify allograft damage since the early stages.Multiparametric MRI can characterize non-invasively both renal physiology and physiopathology without using any contrast agent by quantifying renal biomarkers associated with variations in tissue perfusion, oxygenation, inflammation or fibrosis, among others5.
This work aimed at evaluating the potential of a multiparametric MRI protocol (including perfusion, diffusion and T1 measurements) for the longitudinal assessment of the allograft at different time points during the first year after the transplantation.
METHODS
Subjects and Study DesignThis study was approved by the local Ethics Committee. Written informed consent was obtained from all subjects.
18 renal transplanted patients were scanned 3 times in one year: early after the surgery (Exam 1), at 3 months (Exam 2) and one year after the transplantation (Exam 3).
All participants underwent clinical laboratory measurements of urine and blood samples every 2-4 weeks after the surgery. eGFR was calculated according to Chronic Kidney Disease Epidemiology Collaboration (CKD-EPI) equation based on creatinine6. Lineal regression analyses of the eGFR measurements acquired in the previous 9 months were performed to patients with eGFR≥45ml/min1.73m2 in Exam 3, to discriminate between subjects with stable/unstable function.
MRI Protocol
Scans were performed on a 3T Skyra (Siemens) using an 18-channel body-array coil. MRI protocol was similar to [7].
Arterial Spin Labeling: Pseudo-continuous ASL (PCASL)8,9 with background suppression and SE-EPI readout was employed. PCASL configuration: unbalanced, B1=1.6µT, average gradient=0.5mT/m, ratio=6, labeling duration=1.6s, PLD=1.2s. Sequence parameters are described in Table 1.
Intra-voxel incoherent motion (IVIM)10: 13 b-values (0,10,20,30,40,50,70,100,200,300,400,500,800s/mm2), 3 signal averages, monopolar gradients, 3 orthogonal directions. Readout was single-shot EPI (Table 1).
T1 mapping: Inversion Recovery sequence employing 14 TIs [200:2000]ms11. SE-EPI readout (parameters in Table 1).
Image processing
Motion was corrected using a PCA-groupwise registration method12 in Elastix13.
RBF maps in ml/min/100g were generated using the single compartment model (Table 1). IVIM data were analyzed using a biexponential decay model (Table 1) to generate coefficient D (10-3mm2/s), coefficient D∗ (10-3mm2/s) and $$$f$$$ (flowing fraction) (%) maps. T1 maps were calculated by fitting the signal to the inversion-recovery equation (Table 1). ROIs were manually drawn in the T1 map14 or b=0 images for cortex and medulla.
Statistical analysis
Data are reported as median and interquartile range, as they did not follow a normal distribution.
To assess statistical differences in the measured parameters across groups and exams, data were transformed employing the Aligned Rank Transform (ART)15, and factorial analysis of variance (ANOVA) for repeated measurements was performed on the aligned data. The model included one between-subject factor: group (2 levels = 1,2), one within-subject factor: MR exam (3 levels: 1,2,3), and an interaction term between the two factors. ANOVA was followed by post-hoc contrasts using the Wilcoxon-Mann-Whitney test where appropriate, correcting for multiple comparisons using Bonferroni.
RESULTS
Subjects were divided into 2 groups according to the allograft evolution: Group 1 (stable function)(N=9) and Group 2 (unstable function)(N=7). Demographic data and MR exam timings are reported in Table 2.Figure 1 shows MRI parameter maps for one representative subject for each group. Table 3 reports cortical and medullary parameter values (median (IQR)), which are in line with the literature. Figure 2 shows the evolution of the cortical parameters.
For RBF and GFR, ANOVA yielded the following results: there was a significant interaction between the two factors (group and exam). Post-hoc tests revealed differences between groups in Exam 3 (P=0.0059 and P=0.0017 for RBF and GFR, respectively). For Proteinuria, there was a main effect of MR exam. Post hoc-tests found differences between Exam 2 and Exam 1 (P<0.001) and Exam 3 and Exam 1 (P<0.001). No other significant differences were found.
DISCUSSION AND CONCLUSION
Interestingly, none of the parameters showed significant differences between Group 1 and 2 at the baseline MR examination. However, in the following examinations parameters changed between groups, indicating that the evolution of the allograft (function and structure) was different for the two groups. Proteinuria showed a significant decrease with time (as expected), while GFR and RBF increased for patients with stable function and decreased for patients with unstable function. In addition, RBF in this group started to decrease earlier than eGFR, suggesting that RBF could be a promising predictor of allograft dysfunction.IVIM-derived parameters showed higher values in Group 1 for coefficient D and flowing fraction, and the opposite for D*, while T1 values were also higher for Group 2 since the Exam 2, however the differences were not significant . The small sample size and the fact that diffusion parameters and T1 are more related to fibrosis, which was not assessed in this study, could be a reason for not finding significant differences between groups, suggesting also that RBF is more closely related to renal function.
In conclusion, multiparametric MRI can help to assess the allograft longitudinally and has the potential to predict allograft dysfunction when perfusion measurements with ASL are included.
Acknowledgements
This project was supported by the Government of Navarra under the frame of ERA PerMed (ERAPERMED2020-326 - RESPECT) and under the Grant: PC181-182 RM-RENAL. Rebeca Echeverria-Chasco received Ph.D. grant support from Siemens Healthcare SpainReferences
- M.A. Kaballo et al. A comparative analysis of survival of patients on dialysis and after kidney transplantation, Clin. Kidney J. 11 (2017) 389–393.
- P.L. Martin Moreno et al. More Than 1000 Kidney Transplants Performed in Pamplona, Navarra: Data From the Collaborative Transplant Study, Transplant. Proc. 48 (2016) 2891–2894.
- W.K. Wu et al. Delayed graft function and the risk of acute rejection in the modern era of kidney transplantation, Kidney Int. 88 (2015) 851–858.
- A. Sharfuddin, Renal Relevant Radiology: Imaging in Kidney Transplantation, Clin. J. Am. Soc. Nephrol. 9 (2014) 416–429
- N.M. Selby et al. Magnetic resonance imaging biomarkers for chronic kidney disease : a position paper from the European Cooperation in Science and Technology Action PARENCHIMA, (2018) 4–14.
- Levey AS, et al.: A new equation to estimate glomerular filtration rate. Ann Intern Med 2009; 150:604–612.
- Echeverria-Chasco R, et al. Multiparametric renal magnetic resonance imaging: A reproducibility study in renal allografts with stable function. NMR in Biomedicine. 2022; e4832
- Nery F, et al.: Consensus-based technical recommendations for clinical translation of renal ASL MRI. Magn Reson Mater Physics, Biol Med 2020; 33:141–161.
- Echeverria-Chasco R, et al. Optimization of pseudo-continuous arterial spin labeling for renal perfusion imaging. 2020(September):1–15.
- Ljimani A, et al. Consensus-based technical recommendations for clinical translation of renal diffusion-weighted MRI. Magn Reson Mater Physics, Biol Med 2020; 33:177–195.
- Dekkers IA, et al. Consensus-based technical recommendations for clinical translation of renal T1 and T2 mapping MRI. Magn Reson Mater Physics, Biol Med 2020; 33:163–176.
- Huizinga W, et al.: PCA-based groupwise image registration for quantitative MRI. Med Image Anal 2016; 29:65–78.
- Klein S et al. Elastix: A Toolbox for Intensity-Based Medical Image Registration. IEEE Trans Med Imaging 2010; 29:196–205.
- Cox EF et al. Multiparametric Renal Magnetic Resonance Imaging: Validation, Interventions, and Alterations in Chronic Kidney Disease. Front. Physiol. 2017; 8:696.
- J.O. Wobbrock et al. The Aligned Rank Transform for Nonparametric Factorial Analyses Using Only Anova Procedures, in: Proc. SIGCHI Conf. Hum. Factors Comput. Syst., Association for Computing Machinery, New York, NY, USA, 2011: pp. 143–146.
Figures
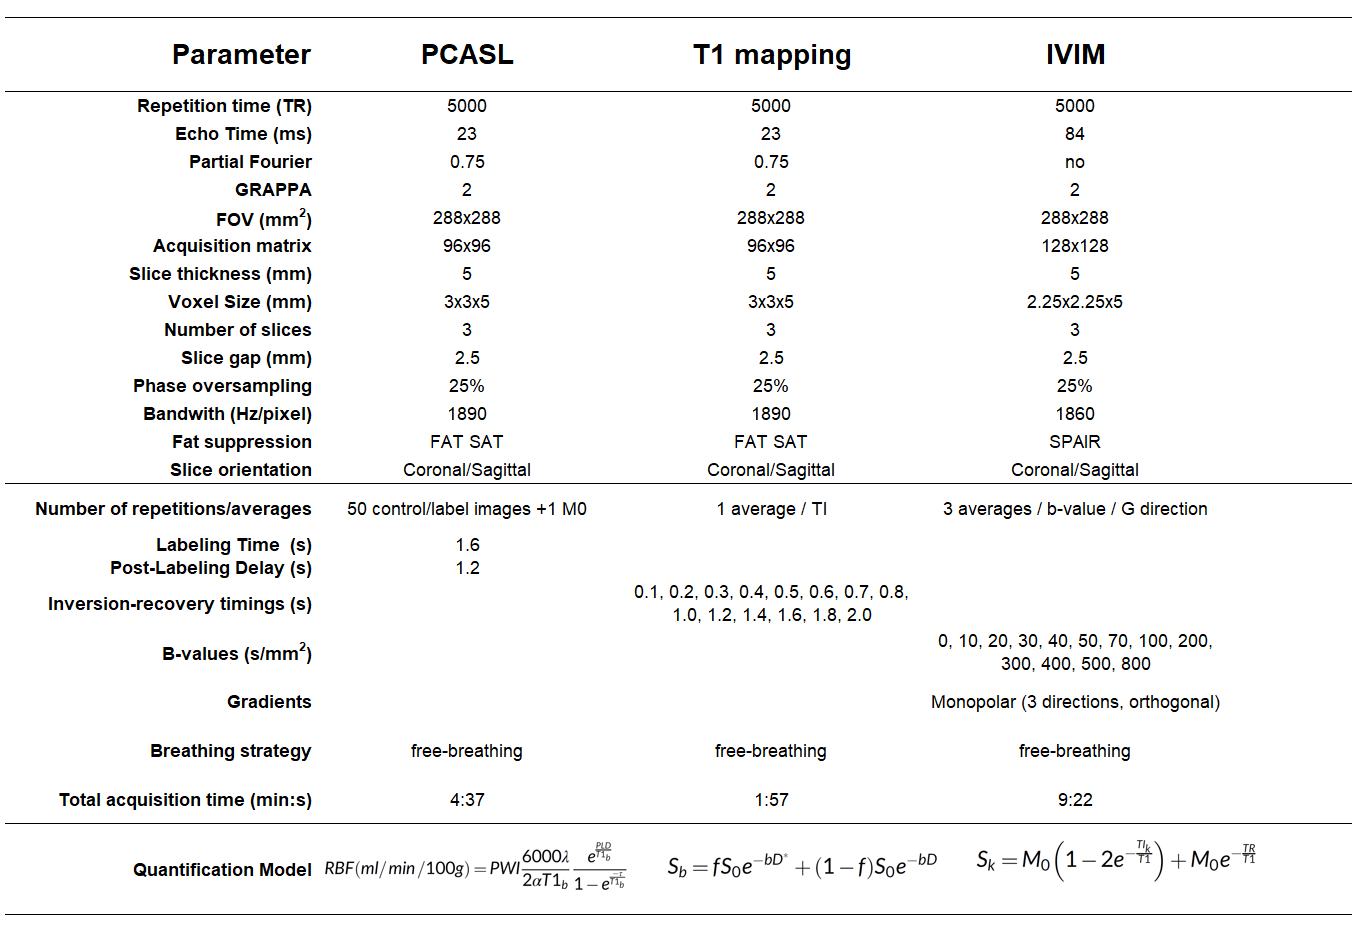
Table 1: Description of
sequence parameters employed in the MRI protocol and quantification models used to generate
the quantitative maps
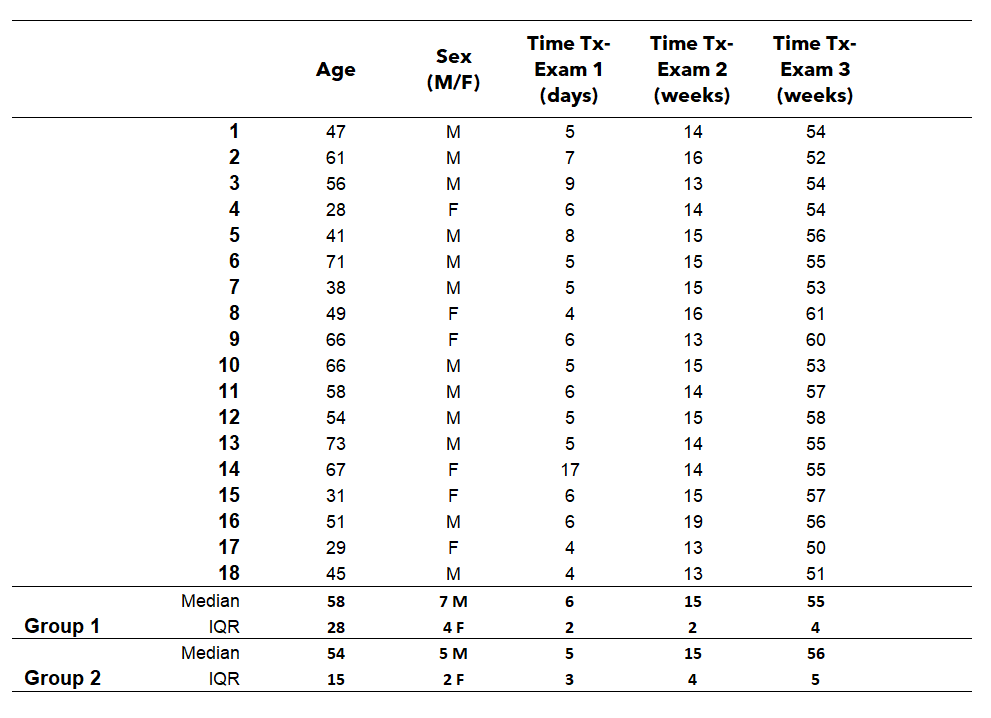
Table 2: Demographic data and times between the transplantation (Tx) and MR examinations
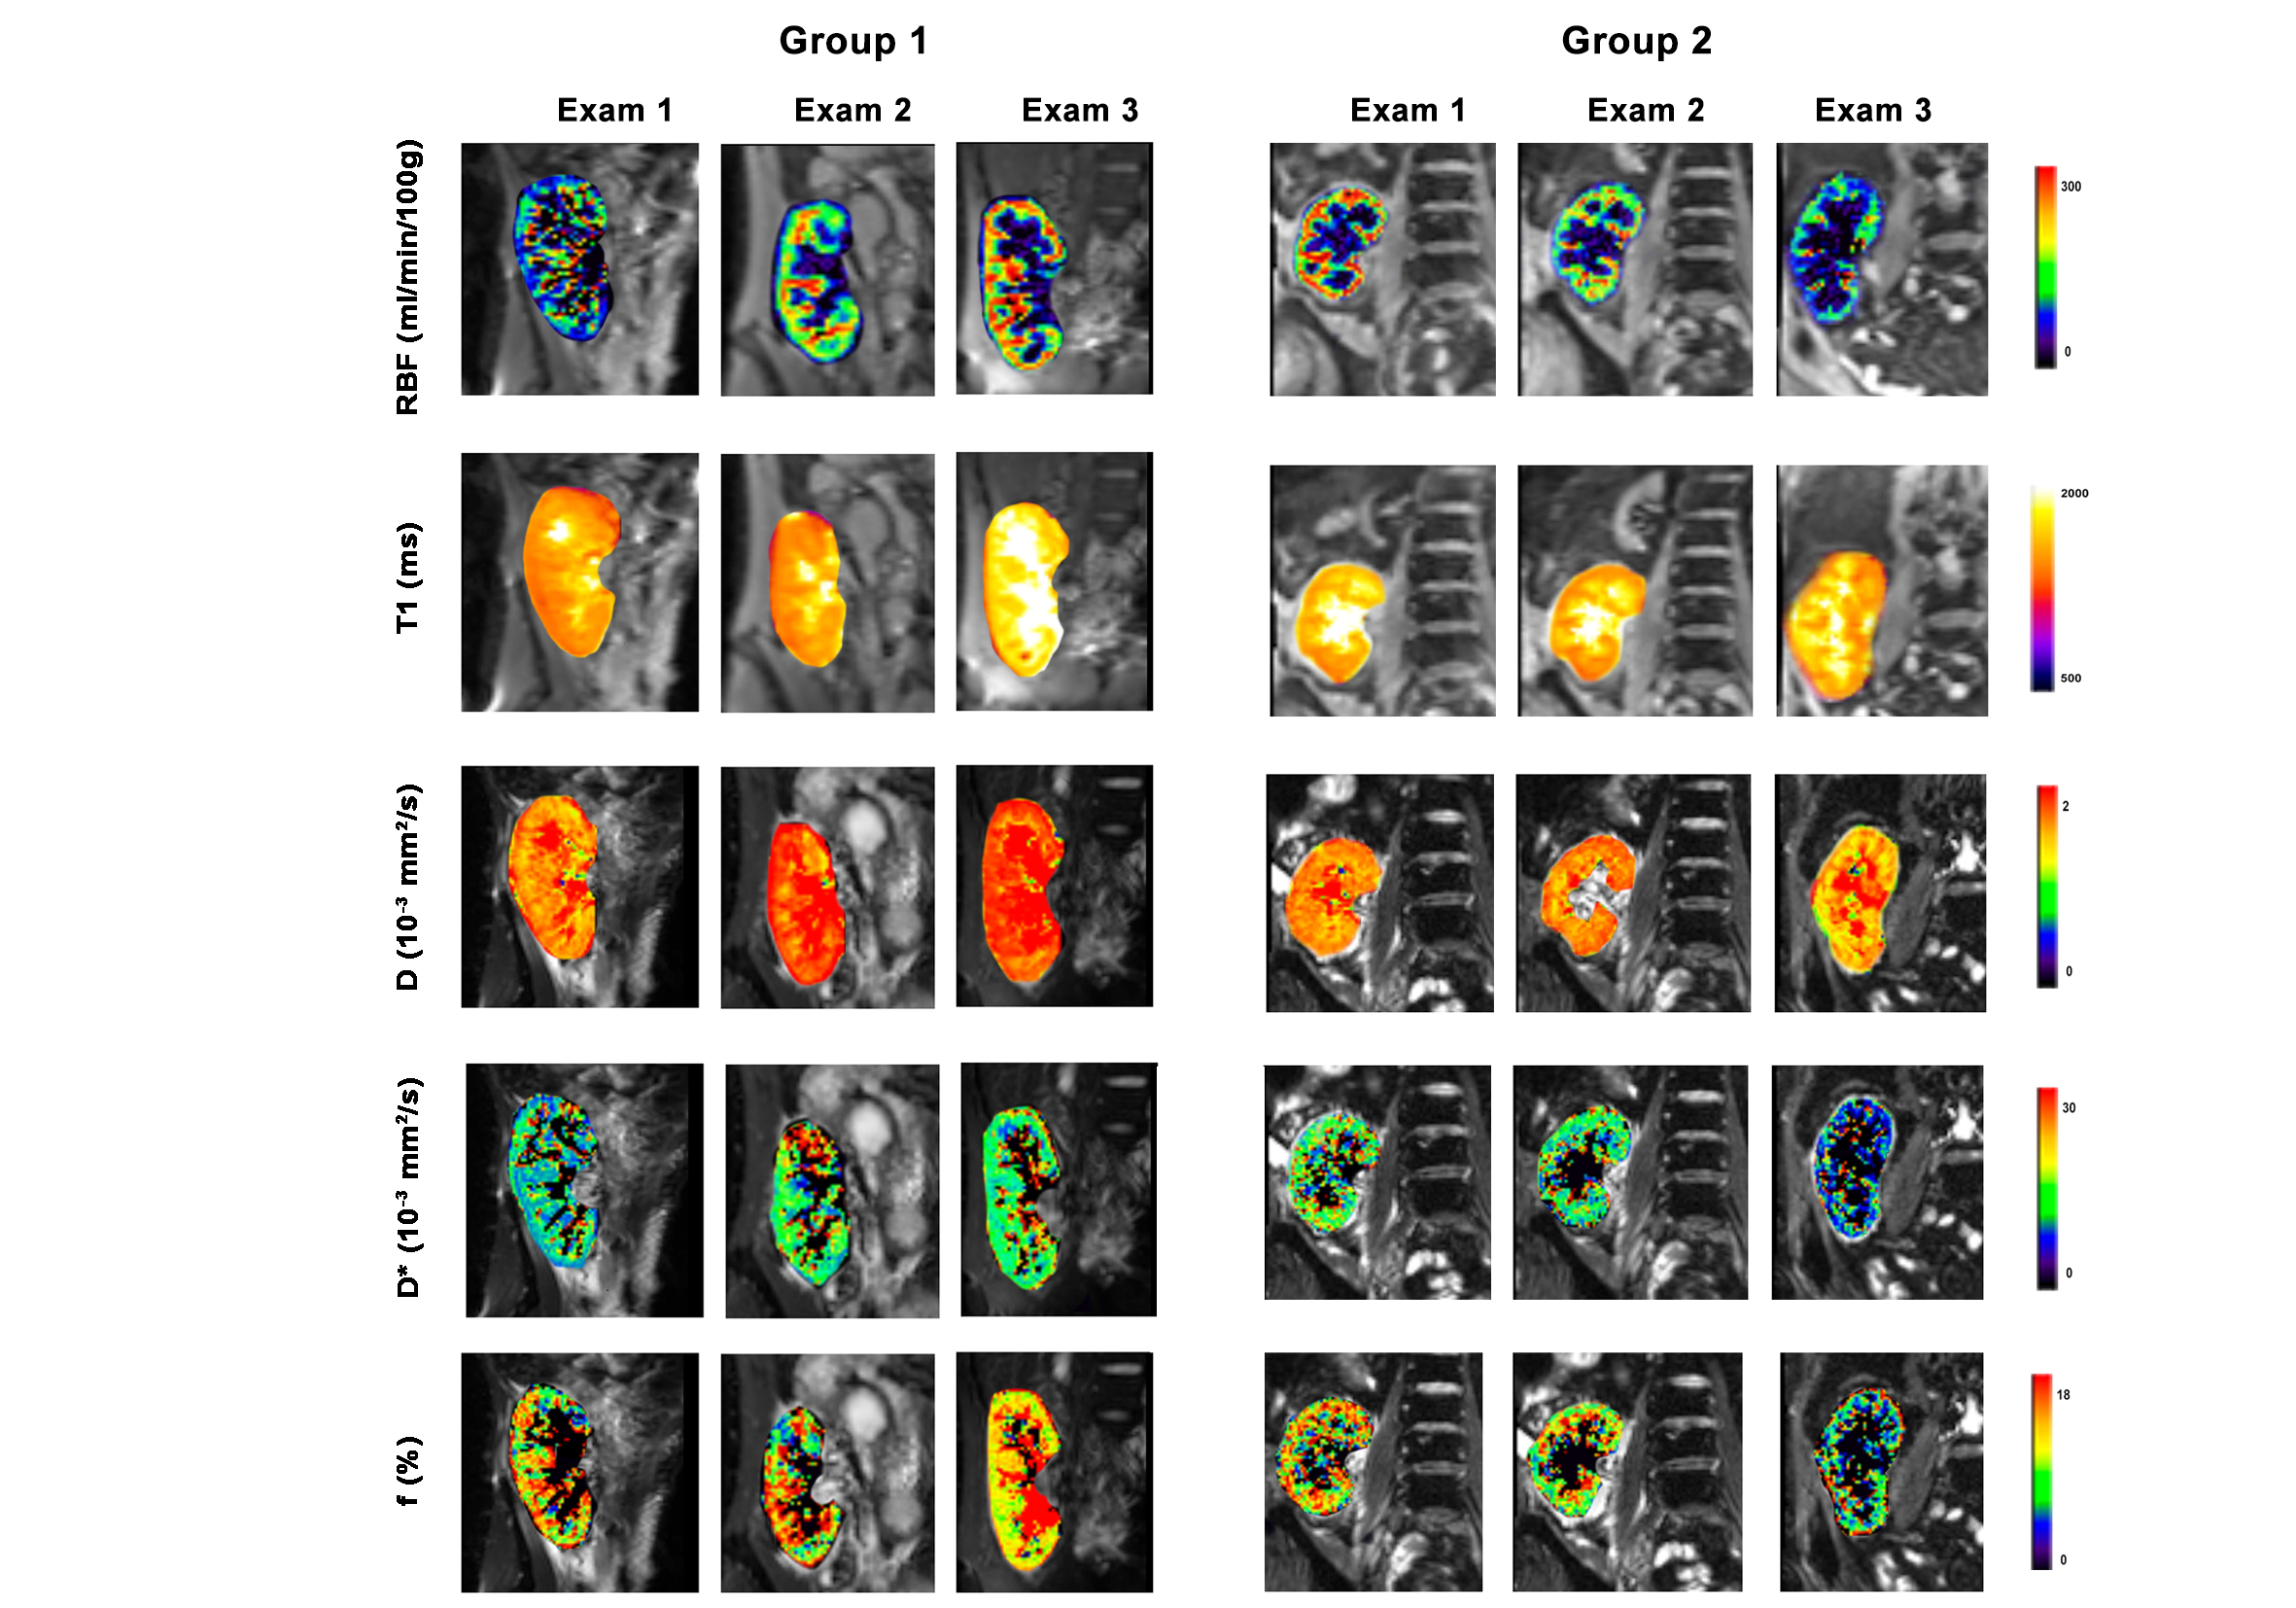
Figure 1: Example of
multiparametric MRI maps acquired during the three examinations, in a
representative patient for each group and exam.
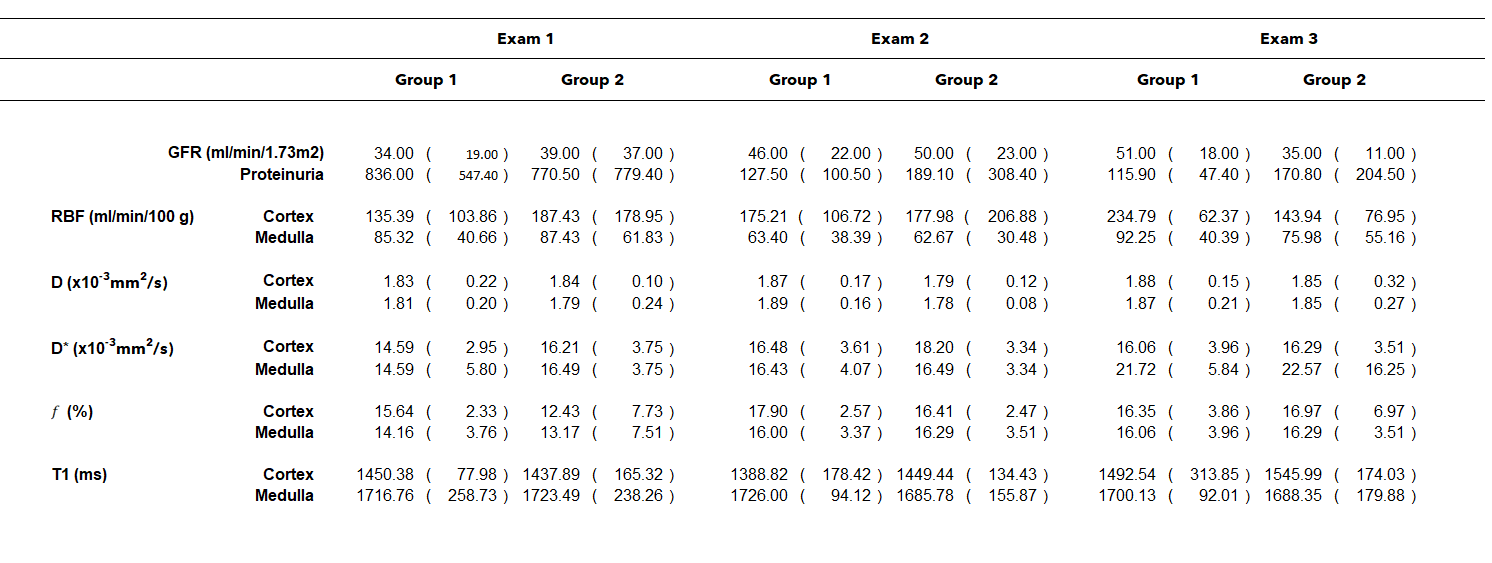
Table 3: MRI
parameters (perfusion, diffusion,
and T1) and clinical parameters (GFR and proteinuria). Values are presented as
group median (IQR: Q3-Q1) for the three exams and groups.
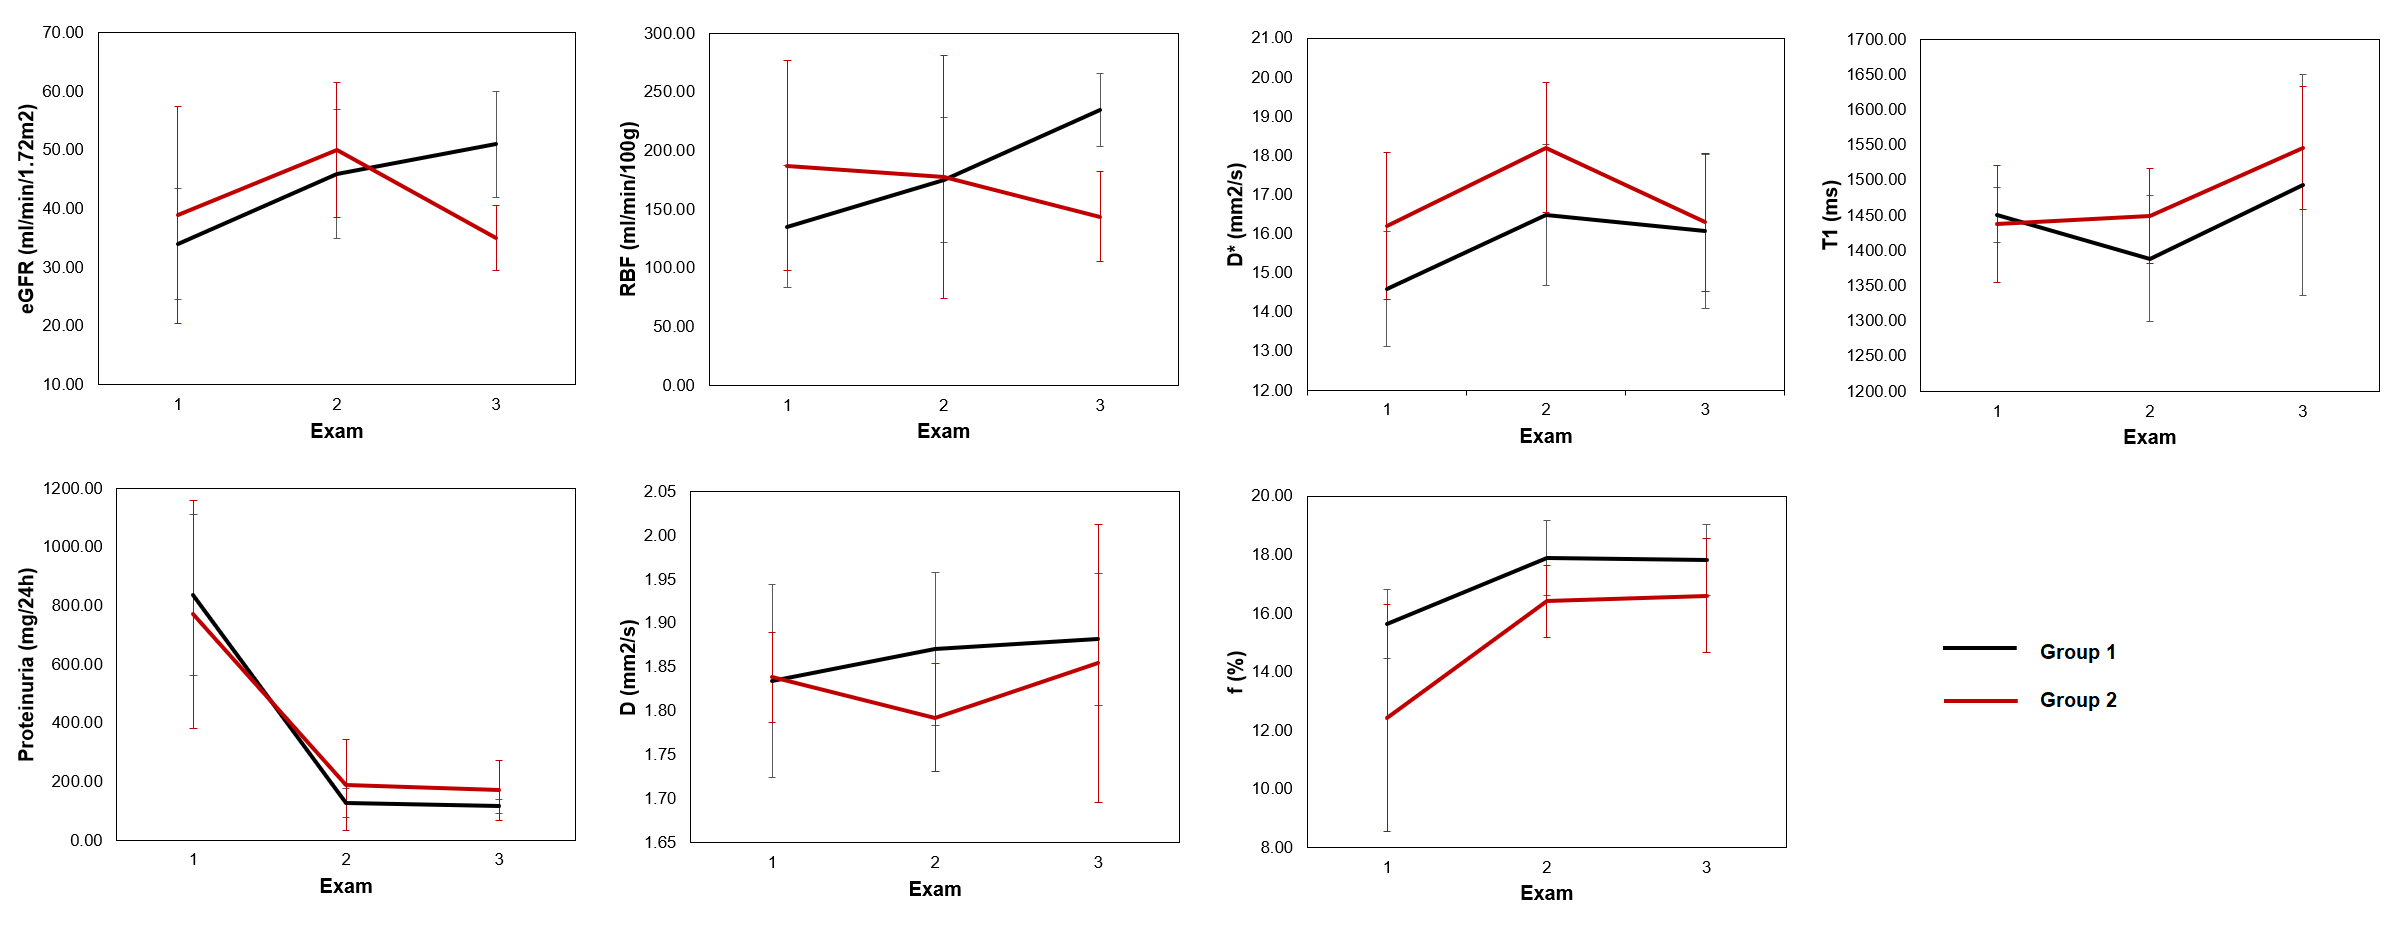
Figure 2: MRI parameters (perfusion,
diffusion, and T1) and clinical parameters (GFR and proteinuria). Values are
presented as group median and error bars represent the interquartile range (IQR:
Q3-Q1) for the three exams and two groups (Group 1: in black, Group 2: in red).
DOI: https://doi.org/10.58530/2023/1293