1292
Quantitative BOLD MRI for Estimating Intra-renal Oxygen Availability: Are Kidneys Hypoxemic in CKD?
Pottumarthi V Prasad1, Lu-Ping Li1, Bradley Hack1, Nondas Leloudas1, and Stuart Sprague1
1NorthShore University HealthSystem, Evanston, IL, United States
1NorthShore University HealthSystem, Evanston, IL, United States
Synopsis
Keywords: Kidney, Oxygenation
Kidney BOLD MRI measurements are not specific to oxygen availability especially when comparing different cohorts because R2* also depends on fractional blood volume (fBV) and hematocrit (Hct). In this study, we have estimated fBV using ferumoxytol and Hct by blood sampling. Using these we show Quantitative BOLD MRI can characterize oxygen availability in quantitative terms. For the first time, we show that kidney cortex is normoxemic in healthy controls while moderately hypoxemic in CKD. Medulla is mildly hypoxemic in controls while moderately hypoxemic in CKD.INTRODUCTION
Blood oxygenation level dependent (BOLD) MRI uses hemoglobin (Hb) as a reporter of oxygen status and has been shown to be useful in the evaluation of relative oxygenation availability of the kidneys non-invasively over two decades ago [1]. BOLD MRI contrast is inherently sensitive to the amount of deoxyhemoglobin within each voxel [2], which in turn is determined by the fractional blood volume (fBV), i.e. fraction of tissue made up of blood, hematocrit (Hct) or fraction of the blood made up of red blood cells, and how well the hemoglobin is oxygenated or oxygen saturation of blood (StO2). Hence R2*, currently used BOLD MRI parameter is not specific to StO2. The effects of reduced fBV and Hct have an opposite effect on R2* compared to reduced StO2, i.e. while reduced fBV and Hct would decrease R2*, reduction in StO2 will increase R2*. Since all three could be reduced in CKD, the net effect on R2* may be compromised leading to minimal change in R2* observed with disease severity.In this study, we have adapted the method previously used in rat brains [3] and kidneys [4] to human kidneys and have demonstrated the feasibility of estimating StO2 and bloodPO2 in the kidney cortex and medulla in a small number of healthy volunteers and individuals with CKD. We used ferumoxytol to measure fBV and used a measure of Hct in peripheral blood to estimate cortical and medullary Hct based on prior literature.
MATERIALS AND METHODS
Participants: All procedures were performed with approval from the institutional review board and written consent from each of the participants. 15 subjects participated with 9 healthy controls and 6 individuals with CKD and diabetes. Among the controls, one participant did not complete imaging acquisitions and another one had inadequate image quality and were not included in the analysis. All patients with CKD were either stage III or IV. Table 1 summarizes of participants’ demographic information inlcuding eGFR estimates based on both creatinine and Cystatin-C using CKD-EPI equations.MRI Methods: Participants were instructed to fast overnight before coming for the MRI scans performed in the morning. They were also asked to refrain from using non-steroidal anti-inflammatory drugs (NSAIDs) for three days prior to the scheduled MRI scans. All MRI data was acquired on a 3.0 T whole body scanner (Magnetom Skyra-Fit, Siemens Healthcare, Erlangen, Germany). R2* mapping data was acquired using breath-hold multiple gradient echo (mGRE) sequence and R2 mapping data was acquired with a breath-hold multiple TE turbo spin echo sequence.
After baseline R2* images were acquired using a mGRE sequence (R2* Map_pre in Table 2), ferumoxytol (5mg/kg) was administered i.v. using a Medrad Spectris (Bayer Healthcare, NJ) MRI compatible power injector. The dose was diluted to 100 ml in saline and was administered at a rate of 0.1 ml/s over ~ 17 minutes. Post ferumoxytol R2* maps were acquired with the same mGRE sequence but using higher bandwidth to support shorter echo times. Table 2 summarizes acquisition parameters.
fBV and StO2 were estimated using:
$$fBV=\frac{3}{4\pi}\frac{R2^{*}(ferumoxytol)-R2^{*}(baseline)}{\gamma\cdot B_{0}\triangle\chi(ferumoxytol)}eq.1$$
where $$$\gamma$$$ is the gyromagnetic ratio, Bo is the field strength in Tesla and $$$\triangle\chi$$$ is the susceptibility difference due to ferumoxytol.
$$StO2 = 1-(\frac{3}{4\pi}\frac{R2^{*}-R2}{fBV \gamma \triangle\chi_{0} Hct B_{0}}) eq. 2$$
$$$ \triangle\chi_{0}$$$ is the magnetic susceptibility difference between fully oxygenated and fully deoxygenated hemoglobin (0.264 ppm). Using Hill’s equation [5], StO2 can be converted to bloodPO2.
RESULTS
Figure 1 shows the R2* maps at baseline and post 5 mg/kg of ferumoxytol in a representative control participant and an individual with CKD. These changes were used to estimate regional fBV using eq.1. Using this estimate along with baseline regional R2* and R2 values, an estimate of regional StO2 using eq.2 and hence bloodPO2. These measurements are summarized in Figure 2 for the two groups of participants.Table 3 summarizes the Spearman correlation coefficients for regional fBV, StO2 and bloodPO2 with eGFR and eGFR_cystatin-C, and urine albumin creatine ratio (UACR) as measures of disease severity.
DISCUSSION AND CONCLUSION
The data presented here for the first time reports kidney fBV in human kidneys, which is substantially decreased in individuals with CKD. Most interestingly, taking fBV in to account, the estimated StO2 and bloodPO2 indicate that kidney cortex is normoxemic in healthy controls while moderately hypoxemic in CKD. Similarly, medulla is mildly hypoxemic in controls and moderately hypoxemic in CKD. The main conclusion to be drawn from Table 3 is that qBOLD parameters in cortex are associated with disease severity while BOLD MRI parameter R2* was not.Zhang et al [6] had previously proposed a numerical method based on Monte Carlo simulations to relate measured R2’ (i.e. R2*-R2) with an estimate of StO2. However, the report did not include an independent measure of fBV or Hct. Given that the values they assumed for cortex were consistent with our measured values, their estimate for cortical PO2 of 58 mm Hg and StO2 of 0.92 are quite comparable to our estimates.
In conclusion, both StO2 and bloodPO2 in both cortex and medulla were substantially lower in individuals with CKD consistent with chronic hypoxia hypothesis [7].
Acknowledgements
Work supported by a grant from the National Institutes of Health, R21-DK079080. We thank Covis Pharma for providing us ferumoxytol for this study.References
- Prasad PV, et al., Circulation. 1996;94(12):3271-3275.
- Ogawa S, et al, Proc Natl Acad Sci U S A. 1990;87(24):9868-9872.
- Christen T, et al, Magn Reson Med. 2012;67(5):1458-1468.
- Pohlmann A, et al. Tomography. 2017;3(4):188-200.
- Severinghaus JW. Journal of applied physiology: respiratory, environmental and exercise physiology. 1979;46(3):599-602.
- Zhang JL, et al. Am J Physiol Renal Physiol. 2014;306(6):F579-587.
- Fine LG, et al. Kidney Int Suppl. 1998;65:S74-78.
Figures
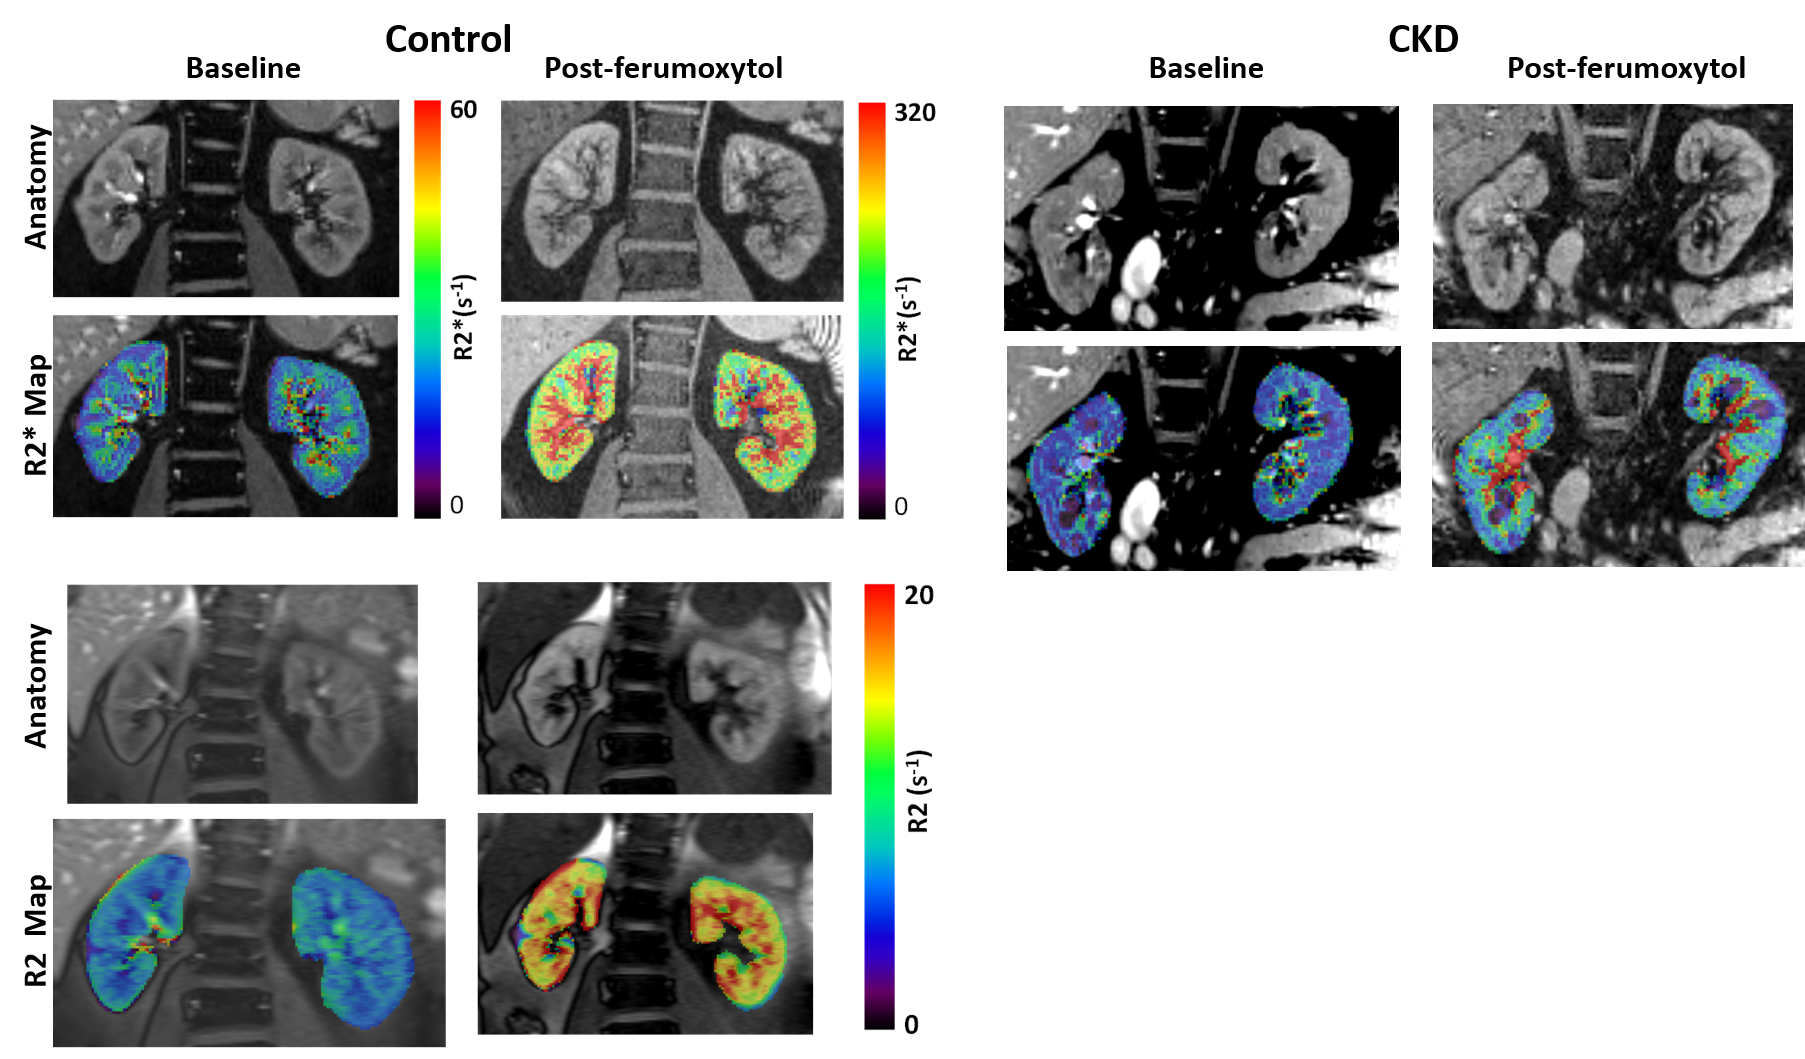
Figure 1: R2* and R2 maps acquired at baseline and
post-ferumoxytol (5 mg/kg) in a representative control (Left) and individual
with CKD (Right). The R2* maps for
control and CKD used the same color bar.
Note the substantial increase in R2* following ferumoxytol both in
cortex and medulla, but much smaller increase in the individual with CKD,
suggesting reduced fBV. While R2 also
shows a similar trend of increase (Bottom), the magnitude of change is much
smaller. Both R2* and R2 show a higher
degree of enhancement in the medulla compared to cortex, suggesting higher fBV
in the medulla.
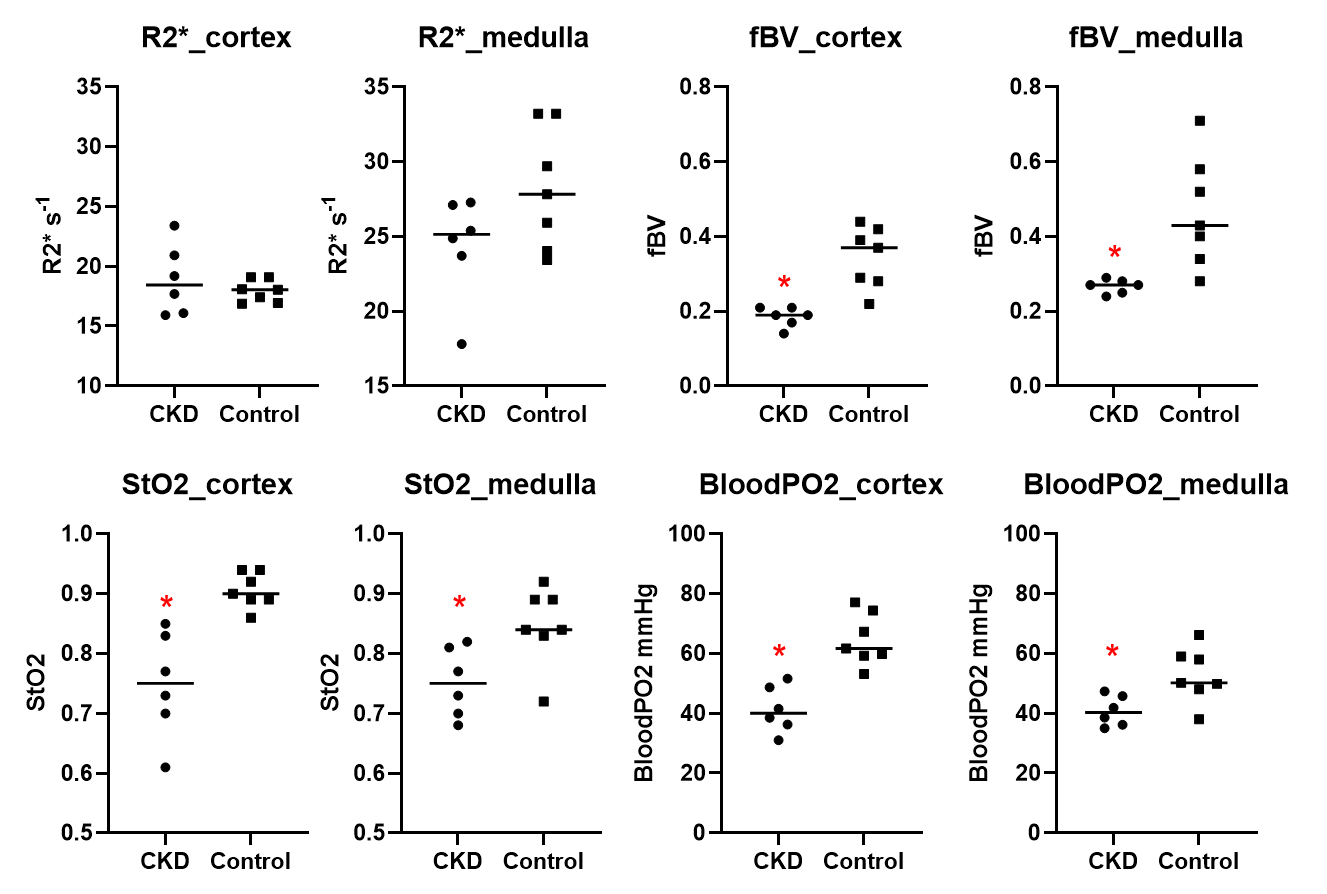
Figure 2: Individual scatter
plots summarizing R2*, fBV, StO2 and bloodPO2 in both cortex and medulla
obtained in the two groups of individuals participated in the study (CKD vs.
Control). Note the significantly lower
values in CKD for fBV, StO2 and bloodPO2 while R2* show only minimal
differences. Further, R2* in medulla is
lower in CKD which may be wrongly interpreted as the oxygenation to be improved
in CKD. * p < 0.05 by non-parametric
Mann-Whitney test.

Table 1

Table 2
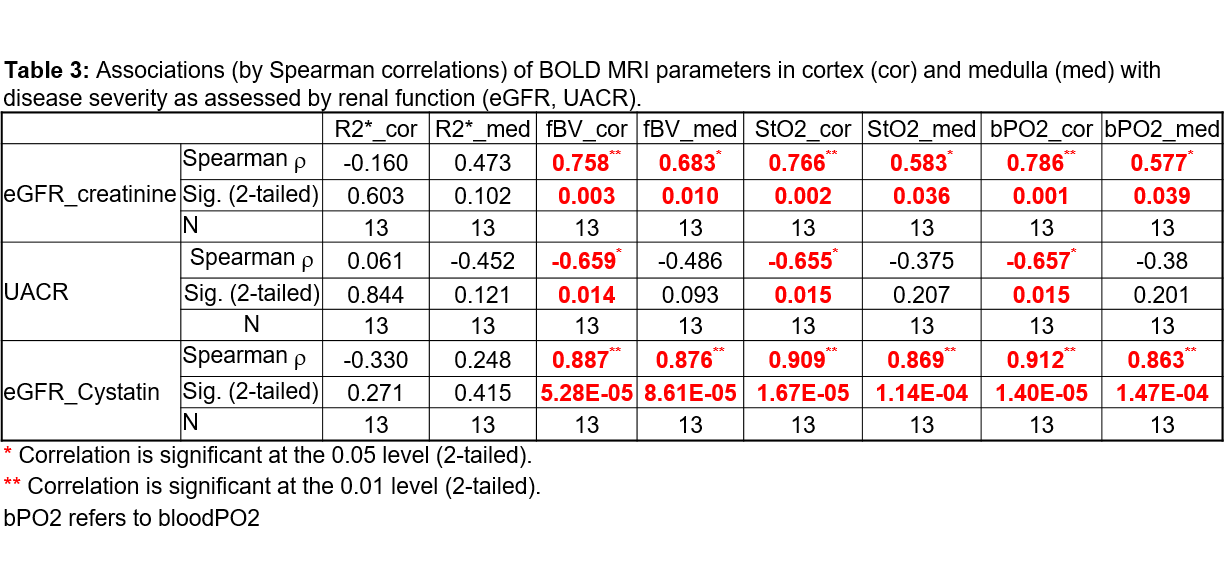
Table 3
DOI: https://doi.org/10.58530/2023/1292