1288
A shortened MOLLI for renal T1 mapping1The University of Sheffield, Sheffield, United Kingdom, 2Department of Biomedical Imaging Sciences, University of Leeds, Leeds, United Kingdom, 3University of Exeter Medical School, Exeter, United Kingdom, 4Leeds Teaching Hospitals NHS Trust, Leeds, United Kingdom
Synopsis
Keywords: Kidney, Kidney, MOLLI, T1 MAPPING
A recent consensus recommends MOLLI-type methods for T1-mapping in the kidney, but these are slow due to the need for full relaxation between inversions. Acceleration can be easily achieved on routine MOLLI-sequences by repeating preparation pulses before complete relaxation, but this requires more accurate signal modelling. Here we propose a broadly applicable model-based approach which inverts a signal model built on Bloch simulations of magnetisation propagation. The method is validated on phantom data and a two-centre cohort of 50 patients with diabetic kidney disease.Introduction
Several studies have shown that T1 mapping can be a useful tool to diagnose kidney disease [1, 2]. A recent consensus [3] recommends a MOLLI based pulse sequence [4] for T1-mapping in the kidney, but MOLLI-sequences are slow due to the need of full relaxation between the 180o inversions. Acceleration can be easily achieved by repeating preparation pulses before complete relaxation, but this requires accurate signal modelling to account for incomplete recovery of the magnetization. The well-known “ShMOLLI” [5] approach for cardiac T1-mapping uses conditional data analysis, but this may be difficult to generalise to other applications. A more flexible and widely applicable alternative is to use Bloch simulations of the pulse sequence - as also applied, for instance, in MR Fingerprinting [6].The aim of this study is to evaluate a shortened MOLLI approach for T1-mapping in the kidney, which can be performed with current available routine sequences and uses Bloch simulations to account for the incomplete recovery. We test the accuracy of the approach using the NIST/ISMRM phantom as ground truth and under real world conditions in a cohort of 50 patients with diabetic kidney disease (DKD).
Methods
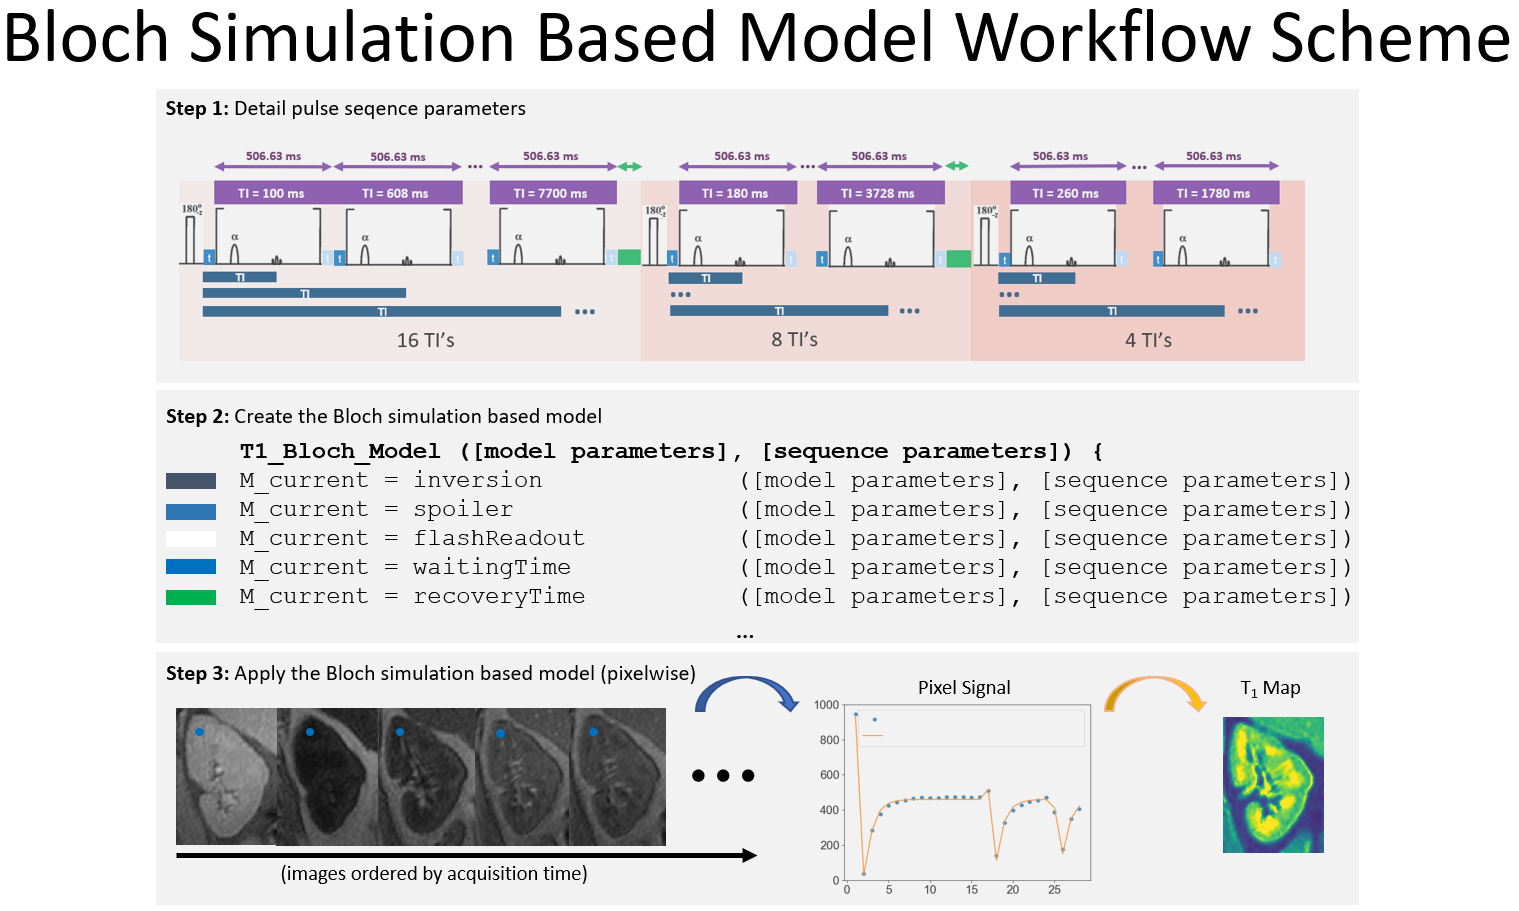
T1 mapping (MOLLI based sequence): three sets of TI [16,8,4] ranging from [100:7700]ms were immediately followed by a 2D-FLASH readout (TE=2.36ms, TR=2.6ms, Grappa=2, Partial Fourier acceleration=5/8) [7] without complete recovery. Using Python, a Bloch simulation-based model was created to mathematically describes how the magnetization propagates through the pulses (Figure 1).Phantom experiments: to test the accuracy of our method the NIST/ISMRM phantom [8] was scanned using a MAGNETOM Prisma 3.0T MRI (Siemens Healthcare GmbH, Erlangen, Germany). T1 mapping data was acquired with the described MOLLI sequence. Using Python, three ROIs were placed over three T1 reference spheres: T2-5: (T1=1340ms, T2=134ms), T2-6: (T1=1017ms, T2=94ms,) and T2-7: (T1=782ms, T2=62ms,) and fitted using a standard mono exponential and the Bloch model.
Patient experiments: to test the systematic error in real world, 50 patients with a diagnosis of type 2 diabetes and eGFR greater or equal to 30 mL/min/1.73m2, aged between 18 and 80 years were recruited [7]. The described MOLLI was used (with breath hold), using a coronal-oblique orientation and a 400x400mm FOV. Renal cortex and medulla ROIs were created on the middle slice of the left kidney and right kidney. T1 from cortex and medulla were obtained by superimposing the ROI masks to the maps calculated by the Bloch model and the mono-exponential maps generated by the scanner software. The Welch's t-test was used to find if the corrected T1 was statistically different from the standard T1.
Results
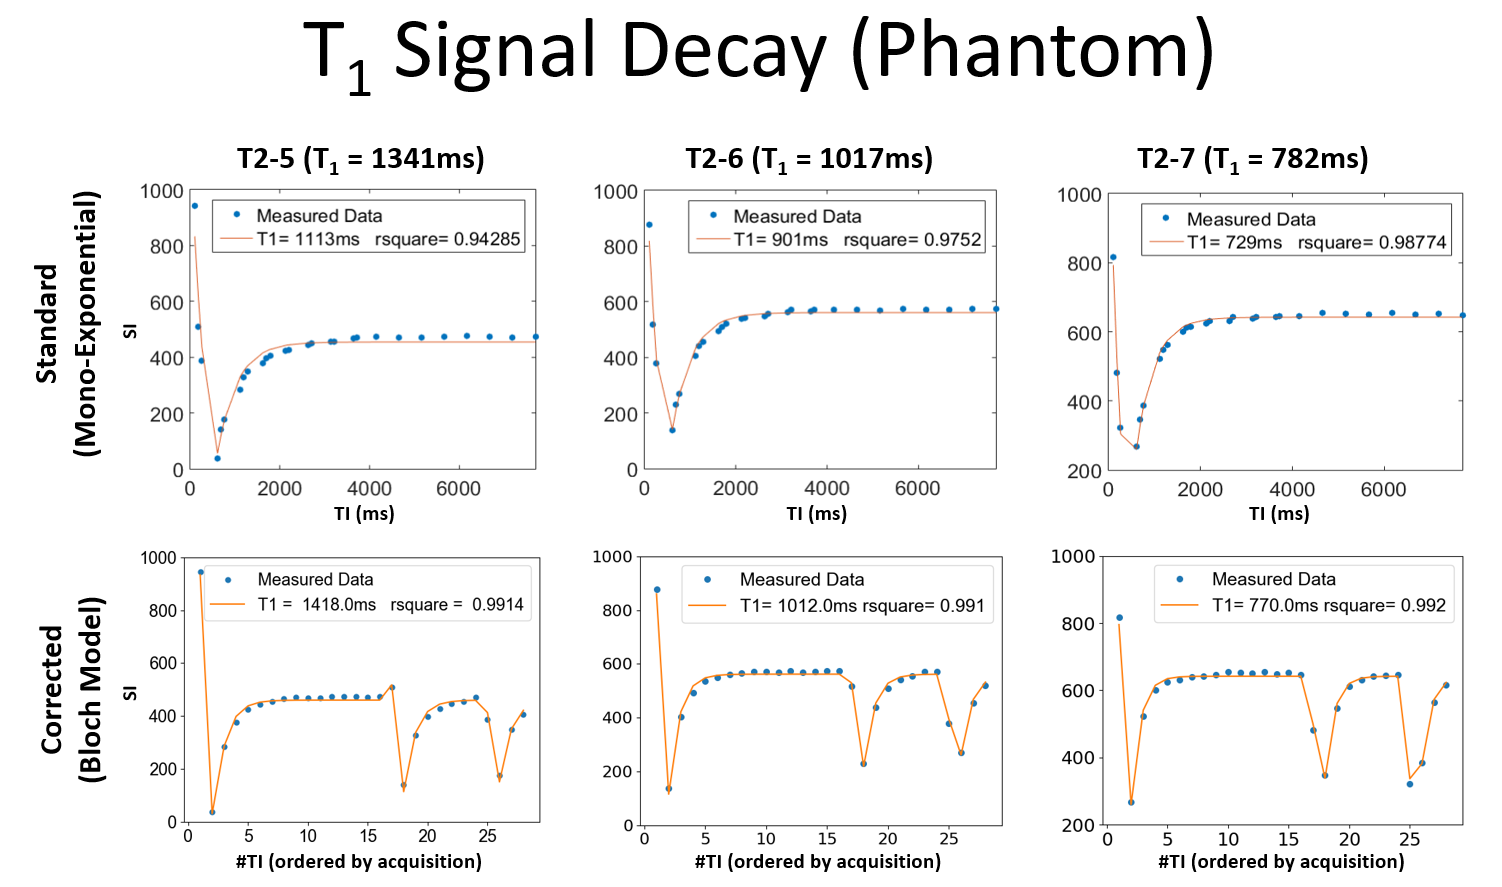
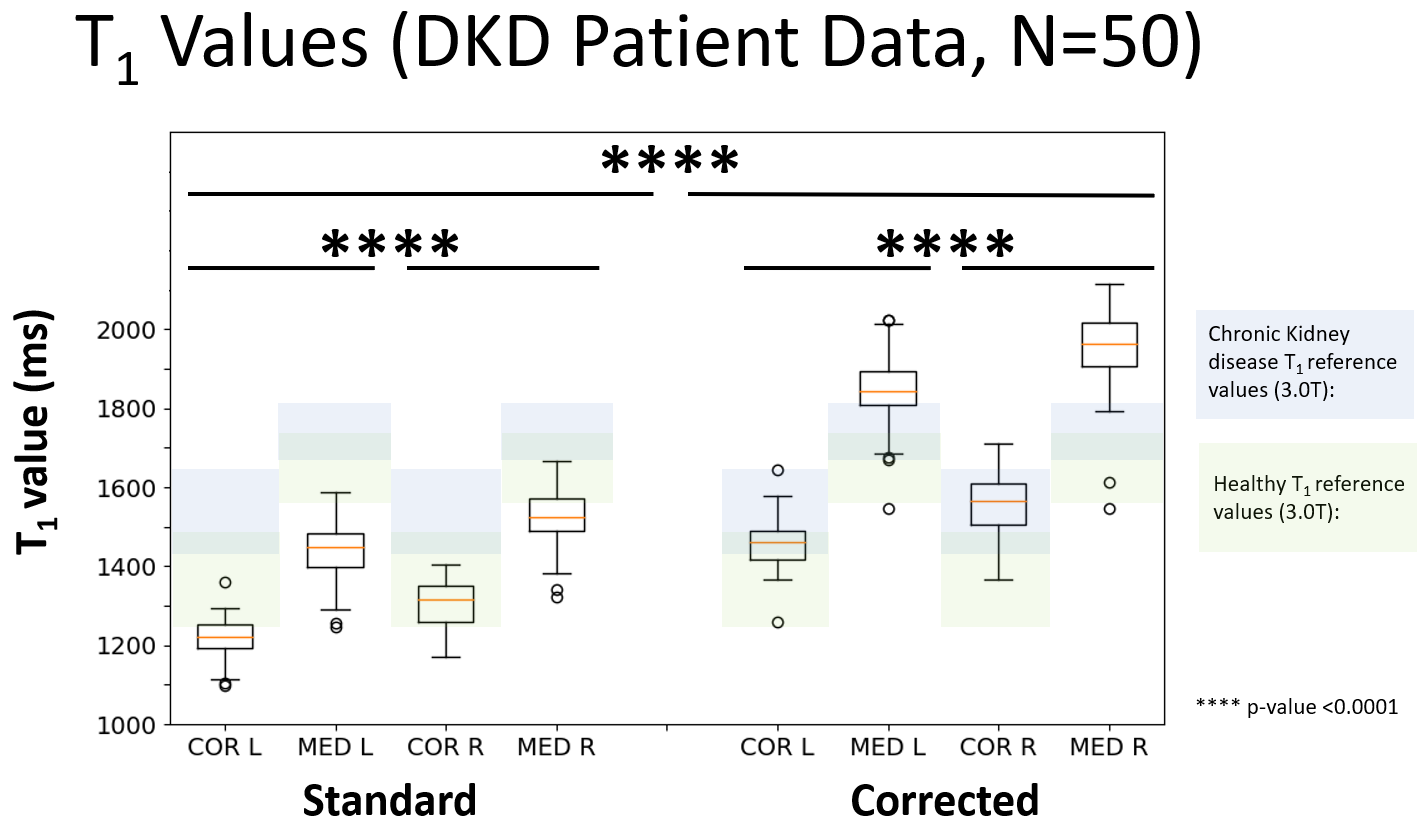
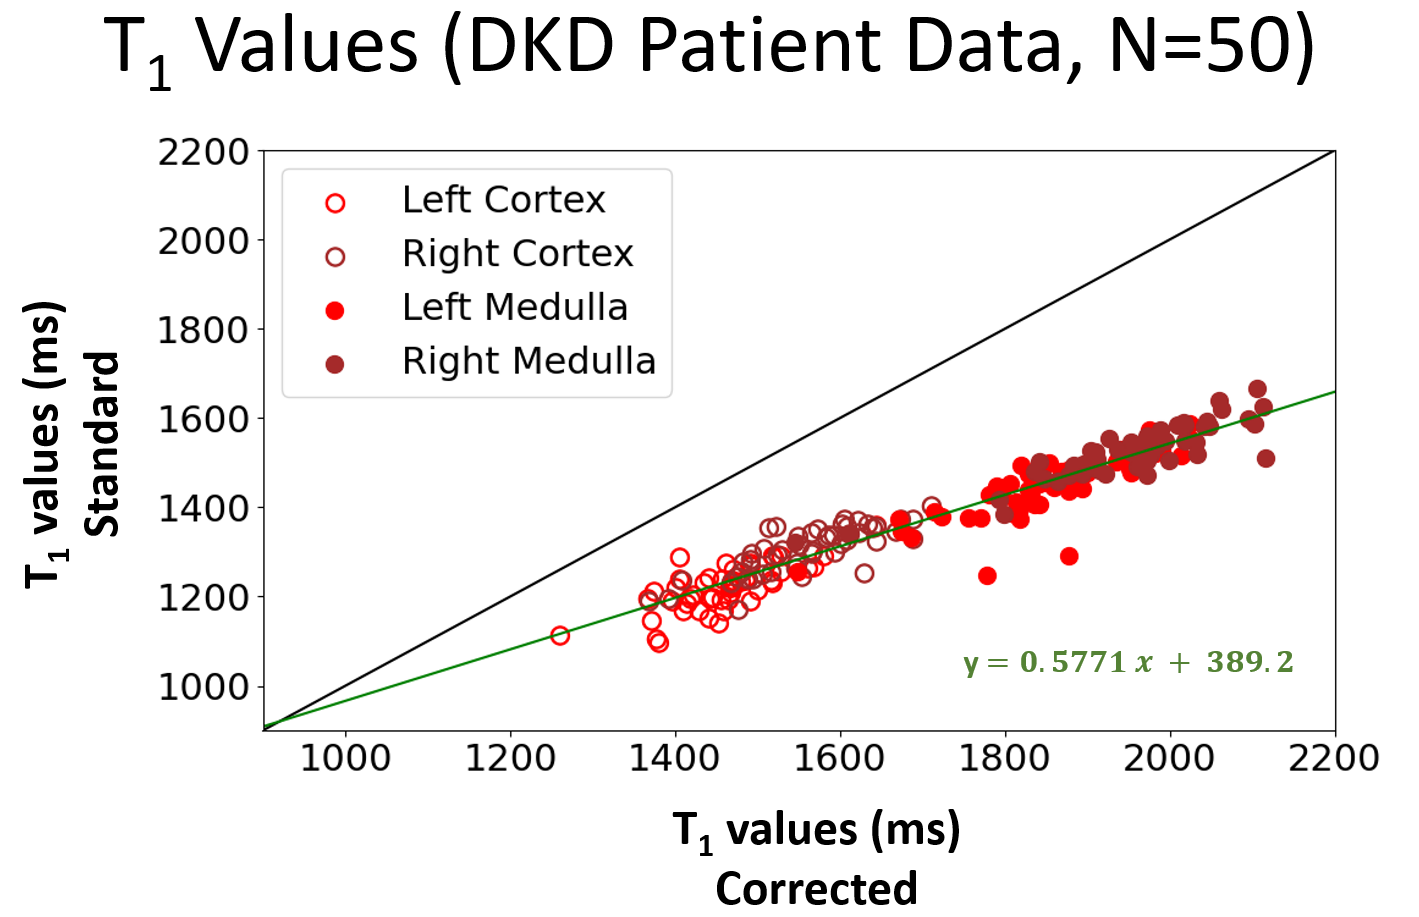
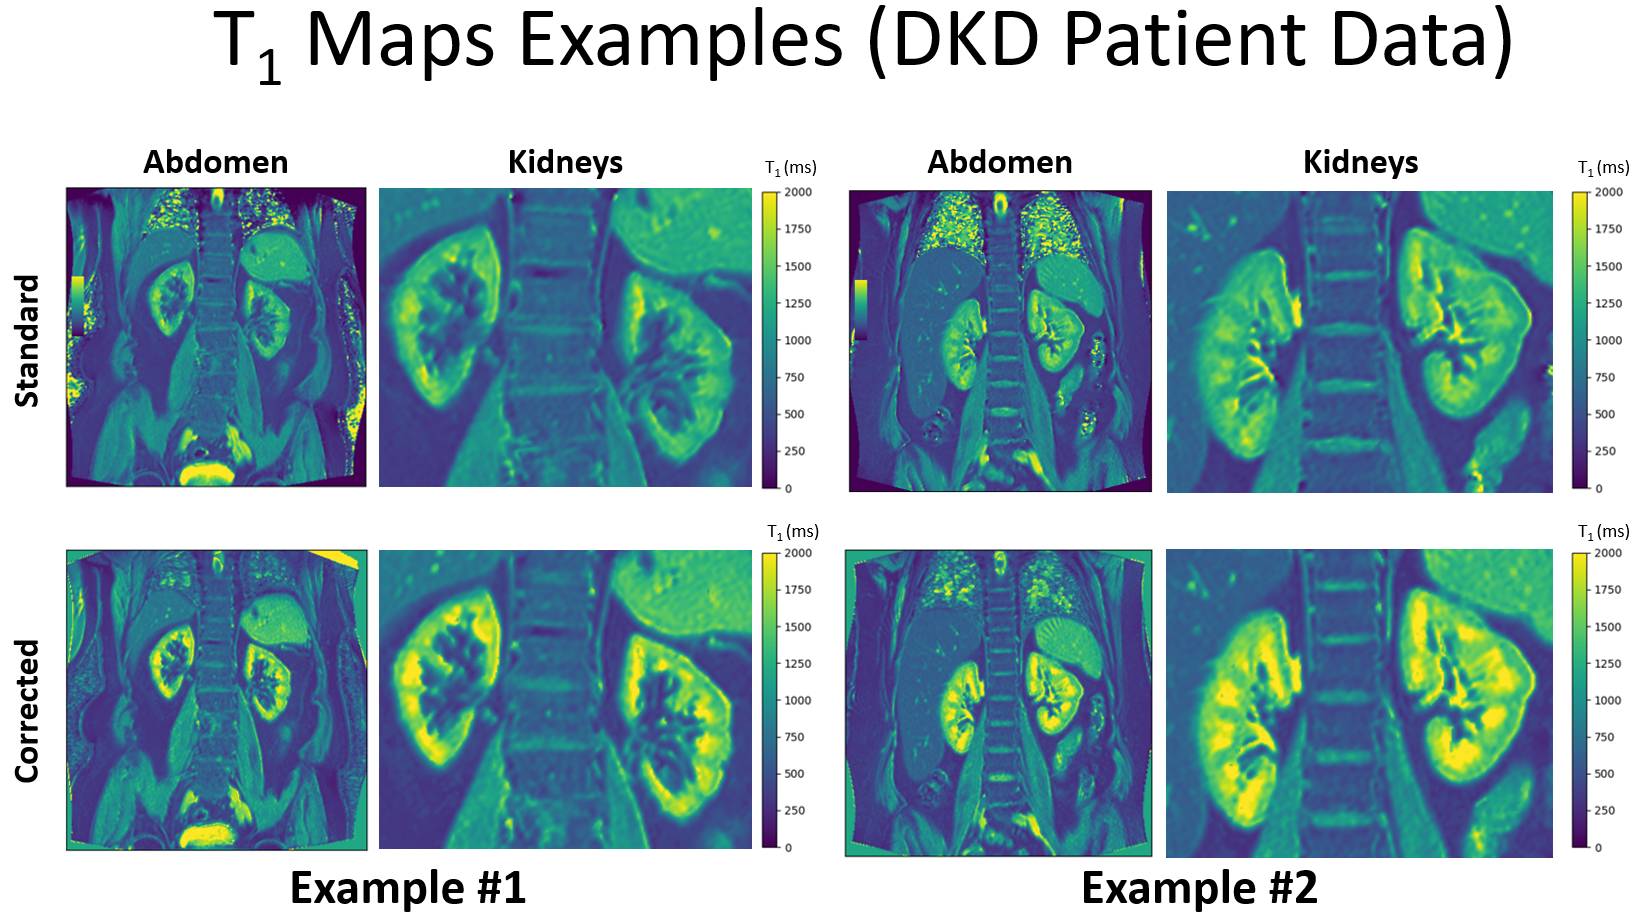
Phantom experiments: Figure 2 shows mono exponential fit fails to accurately quantify the T1 showing a bias of -17.0%, -11.4%, -6.7% in the spheres T2-5, T2-6, T2-7. The Bloch model showed a higher accuracy by reducing these biases to 5.7%, -0.5% and -1.5% respectively.Patient experiments: Figure 3 shows the median of the calculated T1 values using the Bloch model are in the range reported in the literature [1, 2] while T1 values calculated from mono exponential fit are below the reference range. Welch's t-test showed differences between Standard vs. Corrected and Left Kidney vs. Right Kidney (both techniques) by showing a p-value < 0.0001. Figure 4 shows the underestimation of the standard model compared to the corrected, the relationship is well-described by a straight line with y=0.5771x + 389.2. Figure 5 shows two examples of the T1 maps generated by the scanner (“Standard”) and by the Bloch model (“Corrected”).
Discussion
This work shows that the consensus [3] recommended T1 mapping MOLLI [4] sequence can be shortened and still provide accurately T1 values when coupled with Bloch-simulation signal modelling. The phantom experiments showed a relative error of <6% and renal T1 values from 50 DKD patients showed a good agreement with the literature. The data show that accurate signal modelling is critical. Standard signal modelling as recommended in the current consensus would produce a T1 underestimation of 50%, which would lead to an inaccurate classification of pathological kidneys. The approach of using Bloch simulations to allow more flexible sequence design is not new and is used, for instance, in MR Fingerprinting to model complex sequences [6]. However, the current approach of shortening MOLLI has the advantage of being currently applicable in clinical studies that run on routine scanners. This study is also the first to present data on DKD at a larger scale and unexpectedly demonstrates a difference between left and right kidney T1. Further analysis is needed to determine the causes for these differences.Conclusion
The proposed shortened MOLLI sequence with signal analysis based on Bloch simulations produces accurate and consistent measurements of renal T1. Standard mono-exponential models are very sensitive to incomplete recovery and should be used only when a sufficient waiting time between pulses is foreseen.Acknowledgements
On behalf of the iBEAt study team. iBEAt study is part of the BEAt-DKD project. The BEAt-DKD project has received funding from the Innovative Medicines Initiative 2 Joint Undertaking under grant agreement No 115974. This Joint Undertaking receives support from the European Union’s Horizon 2020 research and innovation programme and EFPIA with JDRF. For a full list of BEAt-DKD partners, see www.beat-dkd.eu. This project is supported by the National Institute for Health and Care Research (NIHR) Exeter Clinical Research Facility which is a partnership between the University of Exeter Medical School, and Royal Devon University Healthcare NHS Foundation Trust. The views expressed are those of the author (s) and not necessarily those of the NIHR or the Department of Health and Social Care.References
[1] - Cox EF, et al. Multiparametric renal magnetic resonance imaging: validation, interventions, and alterations in chronic kidney disease. Front Physiol 2017; 8: 696
[2] - Gillis KA, et al. Non-contrast renal magnetic resonance imaging to assess perfusion and corticomedullary differentiation in health and chronic kidney disease. Nephron 2016; 133: 183–192
[3] - Dekkers, Ilona A et al. “Consensus-based technical recommendations for clinical translation of renal T1 and T2 mapping MRI.” Magma (New York, N.Y.) vol. 33,1 (2020): 163-176. doi:10.1007/s10334-019-00797-5
[4] - Messroghli, Daniel R et al. “Modified Look-Locker inversion recovery (MOLLI) for high-resolution T1 mapping of the heart.” Magnetic resonance in medicine vol. 52,1 (2004): 141-6. doi:10.1002/mrm.20110
[5] - Stefan K, P., et al. (2010). Shortened Modified Look-Locker Inversion recovery (ShMOLLI) for clinical myocardial T1- mapping at 1.5 and 3 T within a 9 heartbeat breathhold. Journal of Cardiovascular Magnetic Resonance, 12, 69.
[6] - Laustsen, Christoffer. “Renal MR Fingerprinting: A Novel Solution to a Complex Problem.” Radiology vol. 300,2 (2021): 388-389. doi:10.1148/radiol.2021210924
[7] - Gooding, Kim M et al. “Prognostic imaging biomarkers for diabetic kidney disease (iBEAt): study protocol.” BMC nephrology vol. 21,1 242. 29 Jun. 2020, doi:10.1186/s12882-020-01901-x
[8] - Russek, S. E., et al. "Characterization of NIST/ISMRM MRI system phantom." Proceedings of the 20th Annual Meeting of ISMRM, Melbourne, Australia. 2012.
Figures