1287
A preliminary study of rapid T1mapping imaging for evaluating renal interstitial fibrosis1The Affiliated Wuxi People's Hospital of Nanjing Medical University, Wuxi, China, 2The Affiliated Wuxi Children's Hospital of Nanjing Medical University, Wuxi, China, 3Siemens Healthineers Digital Technology(Shanghai) CO.,Ltd., Nanjing, China
Synopsis
Keywords: Kidney, Quantitative Imaging, T1mapping
T1 mapping is a quantitative magnetic resonance imaging (MRI) technique that can reflect the extent of tissue fibrosis. Classical inversion recovery (IR) method can measure the T1 value with high accuracy, but it has long acquisition times. Therefore, the variable flip angle(VFA) method and the modified look‑locker inversion recovery method (MOLLI) are more frequently used in practical clinical applications. The objectives of this study was to compare the two rapid T1mapping imaging methods and to evaluate the diagnostic efficacy of T1 values measured by the two methods in differentiating the degree of renal interstitial fibrosis(IF).Introduction
Chronic kidney disease (CKD) is characterized by chronic, progressive damage to the renal parenchyma and a gradual loss of renal function, mainly resulting in histological findings of renal interstitial fibrosis (IF). In renal MRI, measurement of the T1 relaxation time of water molecules can noninvasively assess the renal IF degree and provide information for diagnosis and treatment decision and risk stratification in patients with CKD [1]. As the classical inversion recovery (IR) method in renal T1 mapping has long acquisition times [2], rapid imaging methods such as the variable flip angle(VFA) and the modified look‑locker inversion recovery (MOLLI) are more frequently used in practical clinical applications. However, there is still some controversy over which imaging method is preferred for renal MRI imaging [3] due to a lack of comparative studies. Therefore, the objectives of this study was to compare the two rapid imaging methods and to evaluate the diagnostic efficacy of T1 values measured by the two methods in differentiating the degree of renal IF.Methods
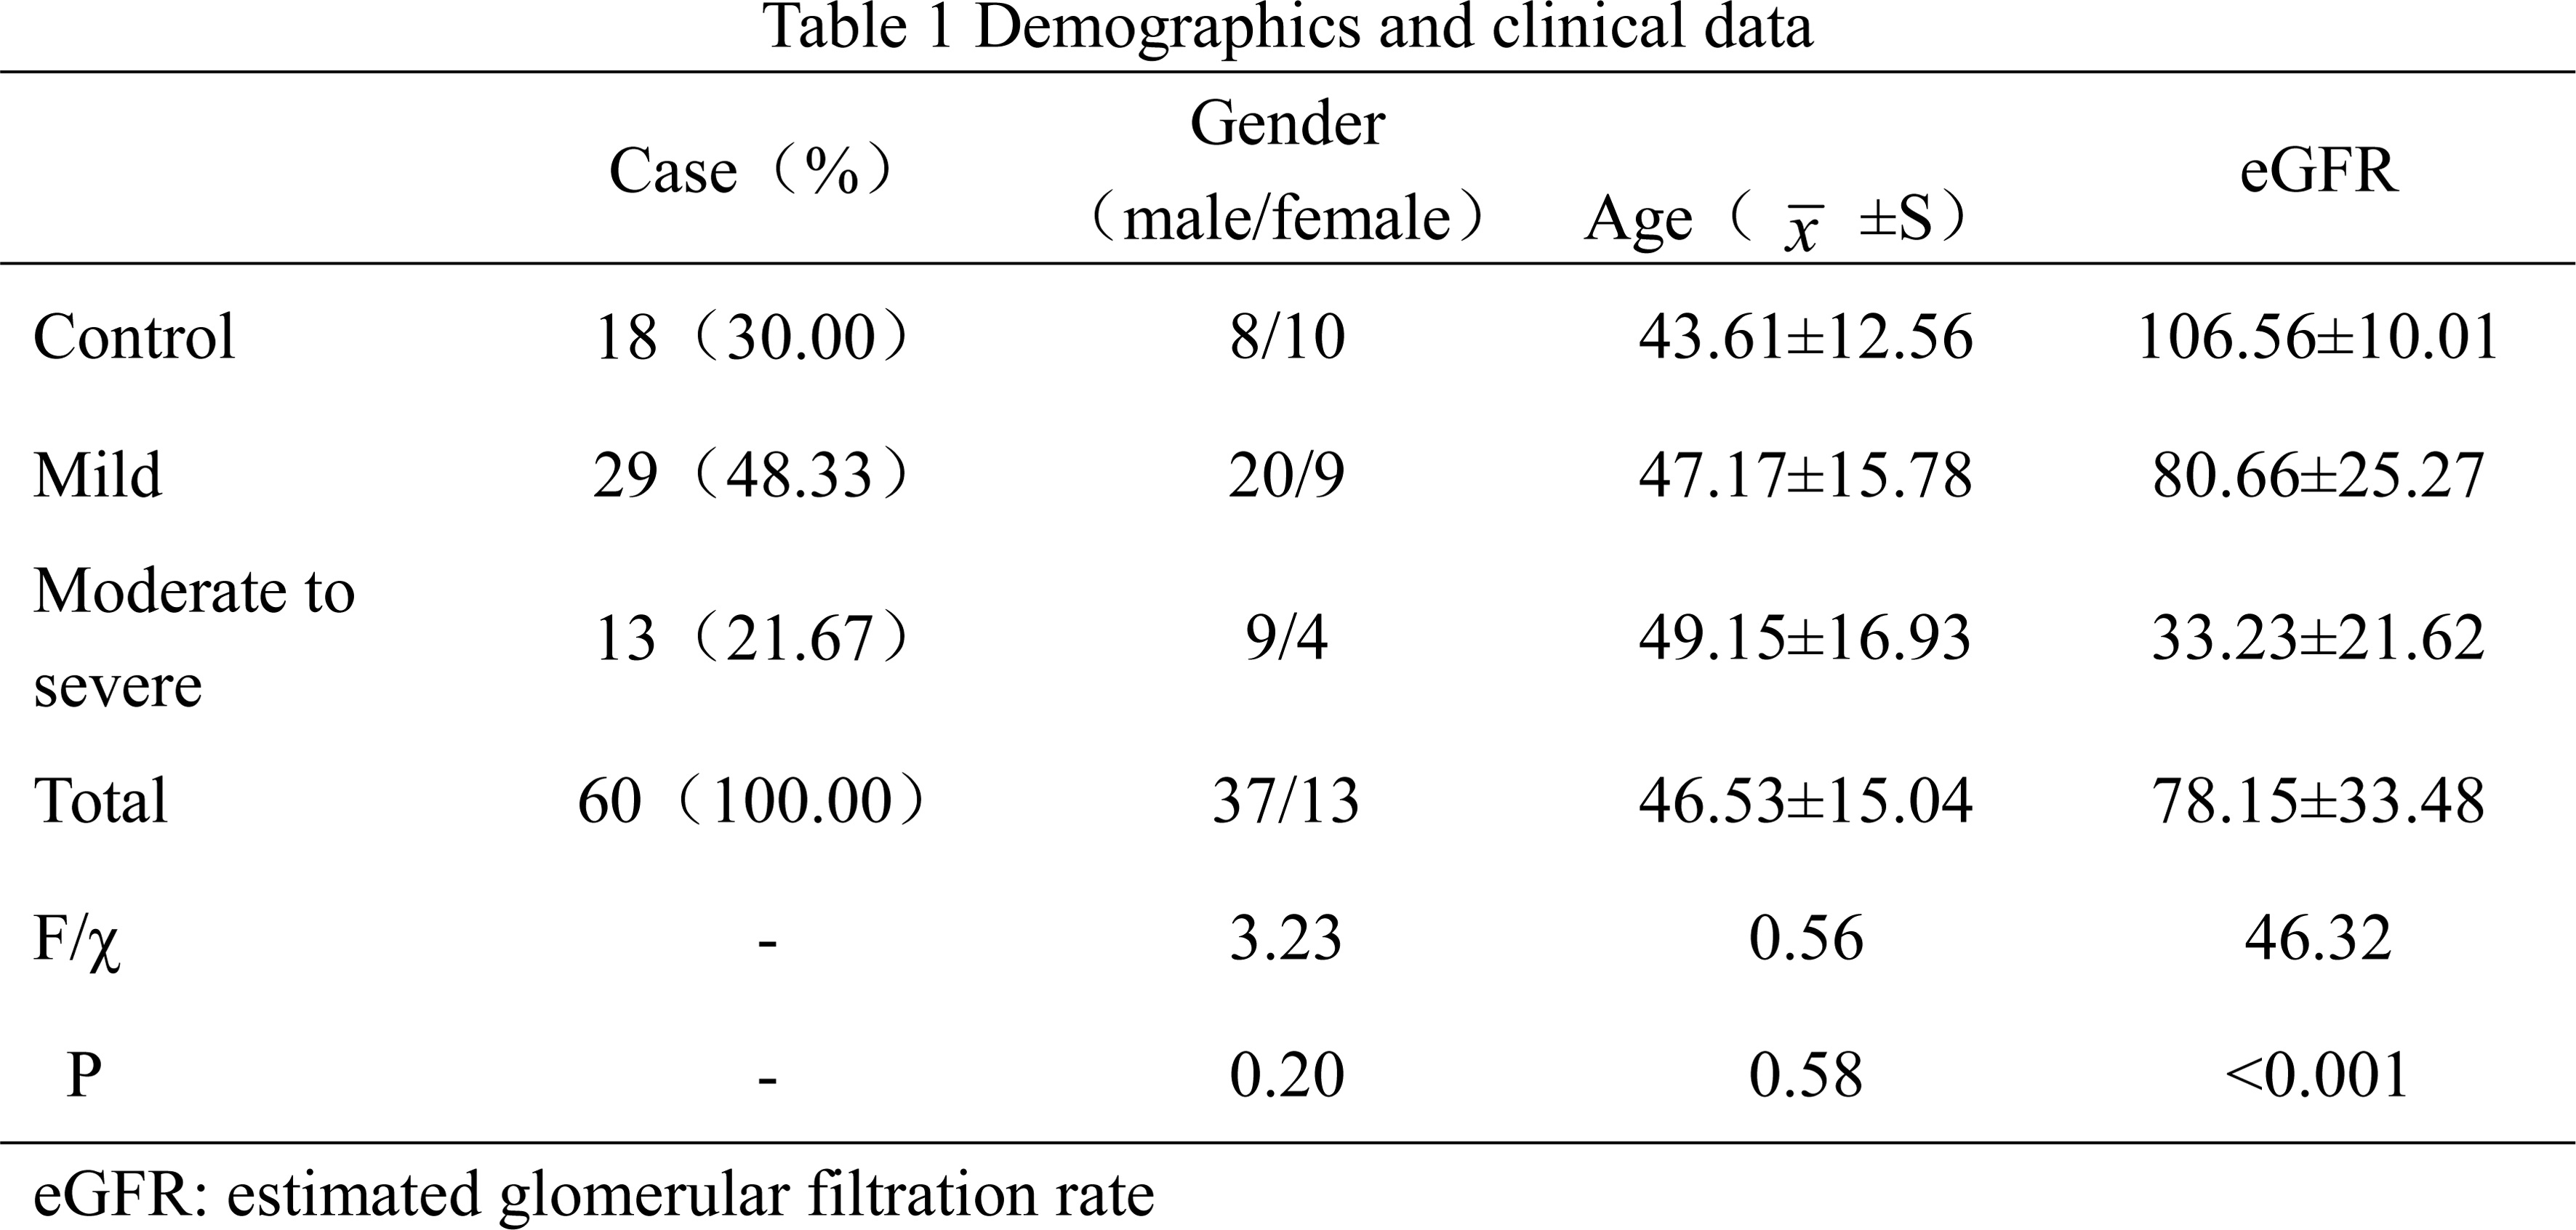
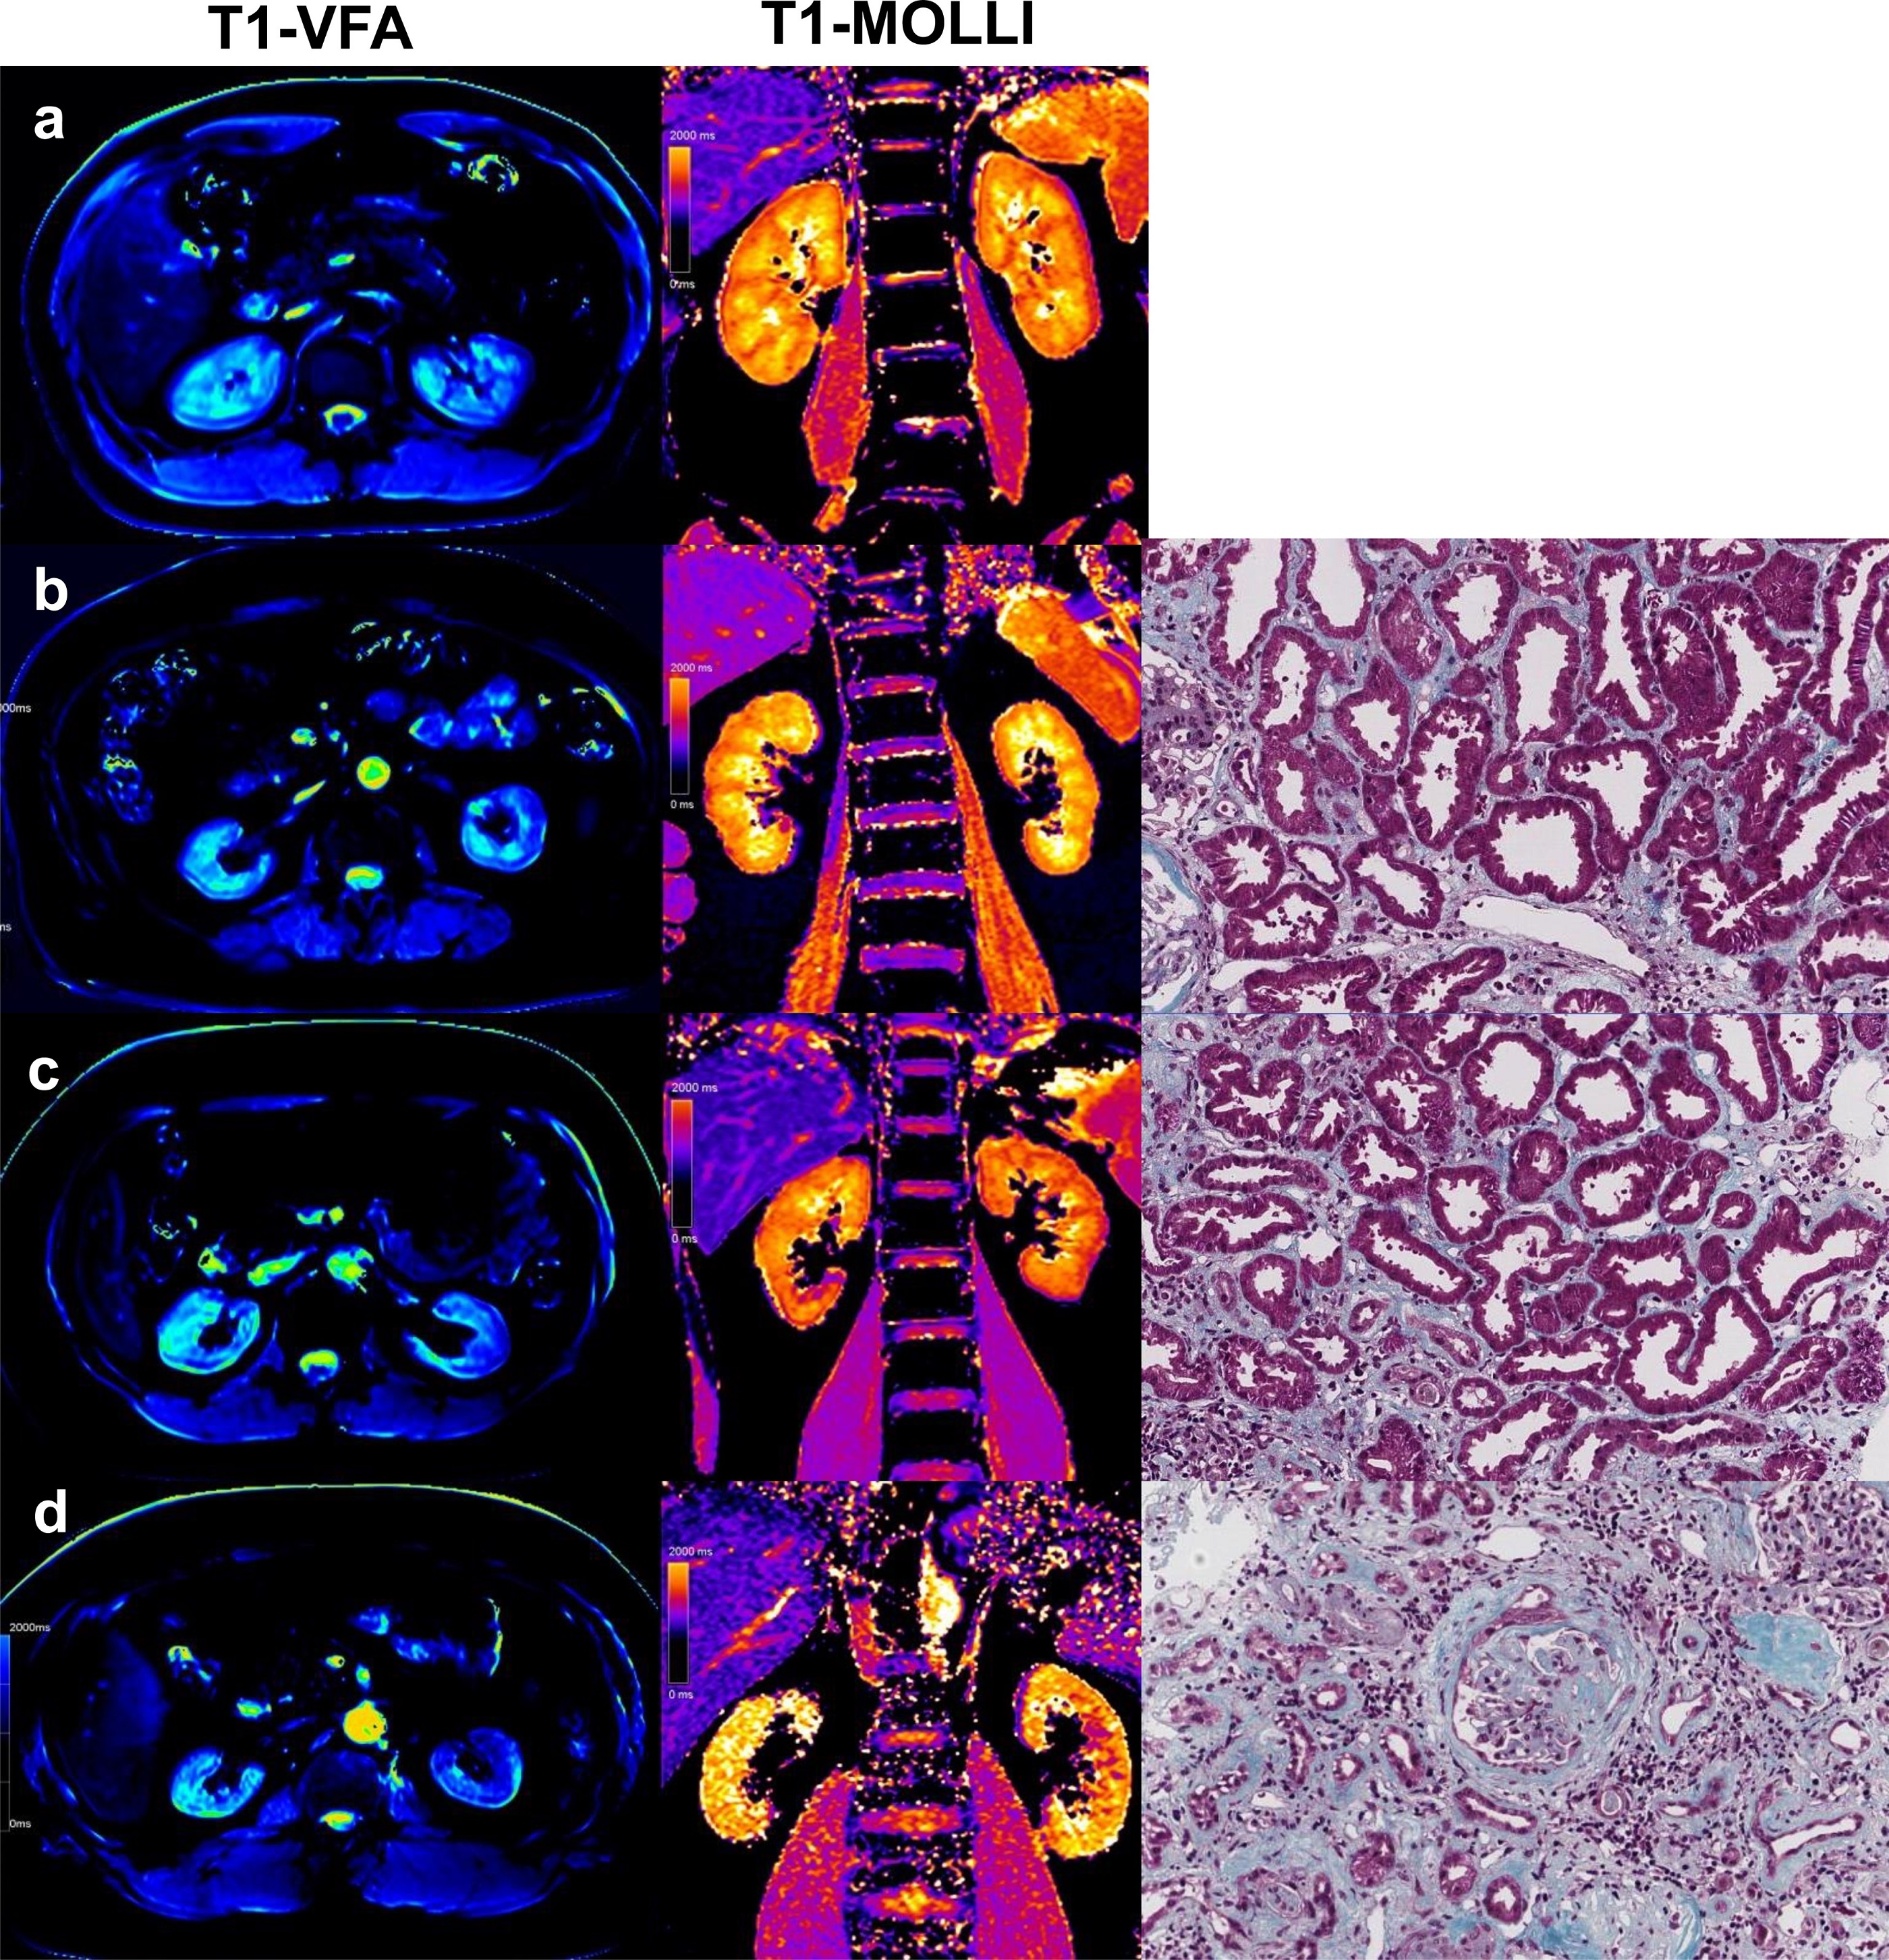
We prospectively recruited 42 CKD patients who were willing to accept renal biopsy and 18 healthy volunteers (Fig.1). All subjects underwent MRI examination at Siemens PRISMA 3.0T. Protocol sequence includes T1 (repetition time [TR]/echo time [TE]: 3.97 ms/2.52 ms; voxel size: 1.2×1.2×3.0 mm; matrix: 260×320; slice-thickness: 3 mm; field-of-view [FOV]: 308×380 mm, T2 (TR/TE: 3255 ms/78 ms; voxel size: 1.2×1.2×6.0 mm; matrix: 320×320; slice-thickness: 6 mm; FOV: 380×380 mm), B1 (TR/TE: 5050 ms/1.83 ms; voxel size: 6.0×6.0×8.0mm; matrix: 52×64; slice-thickness:8mm; FOV:310×380 mm), VFA for T1 mapping(TR/TE: 5.01ms/2.3ms; voxel size:0.8×0.8×4.0mm; matrix: 135×224; slice-thickness:4mm; FOV:305×380 mm; flip angle:3°and 15°) and MOLLI for T1mapping (TR/TE:471.5ms/1.2ms; TI:307ms;Voxel size:1.2 ×1.2×8.0mm; matrix:135×224; slice-thickness:8mm; FOV:256×300mm; flip angle: 35°). Two experienced radiologists used the sygno.via workstation of Siemens and measured the T1 value of the renal cortex and medulla, and corticomedullary difference in T1(ΔT1) was calculated. All patients obtained the pathological results of kidney biopsy within 2 days after MRI and were divided into IF mild group and IF moderate-severe group in reference to the study by Mariani et al (Fig.2) [4]. The estimated glomerular rate filtration (eGFR) value were recorded. T-test was used to evaluate the differences between groups in the T1 values measured by the two imaging methods. Bland-Altman was used to check the consistency of the two methods. Pearson correlation analysis was used to analyze the correlation between T1 values and eGFR. Receiver operating characteristic (ROC) curves was used to evaluate the diagnostic efficacy of T1 values for renal IF. Statistical analysis was performed using SPSS 17.0, and P<0.05 was considered statistically significant.Results
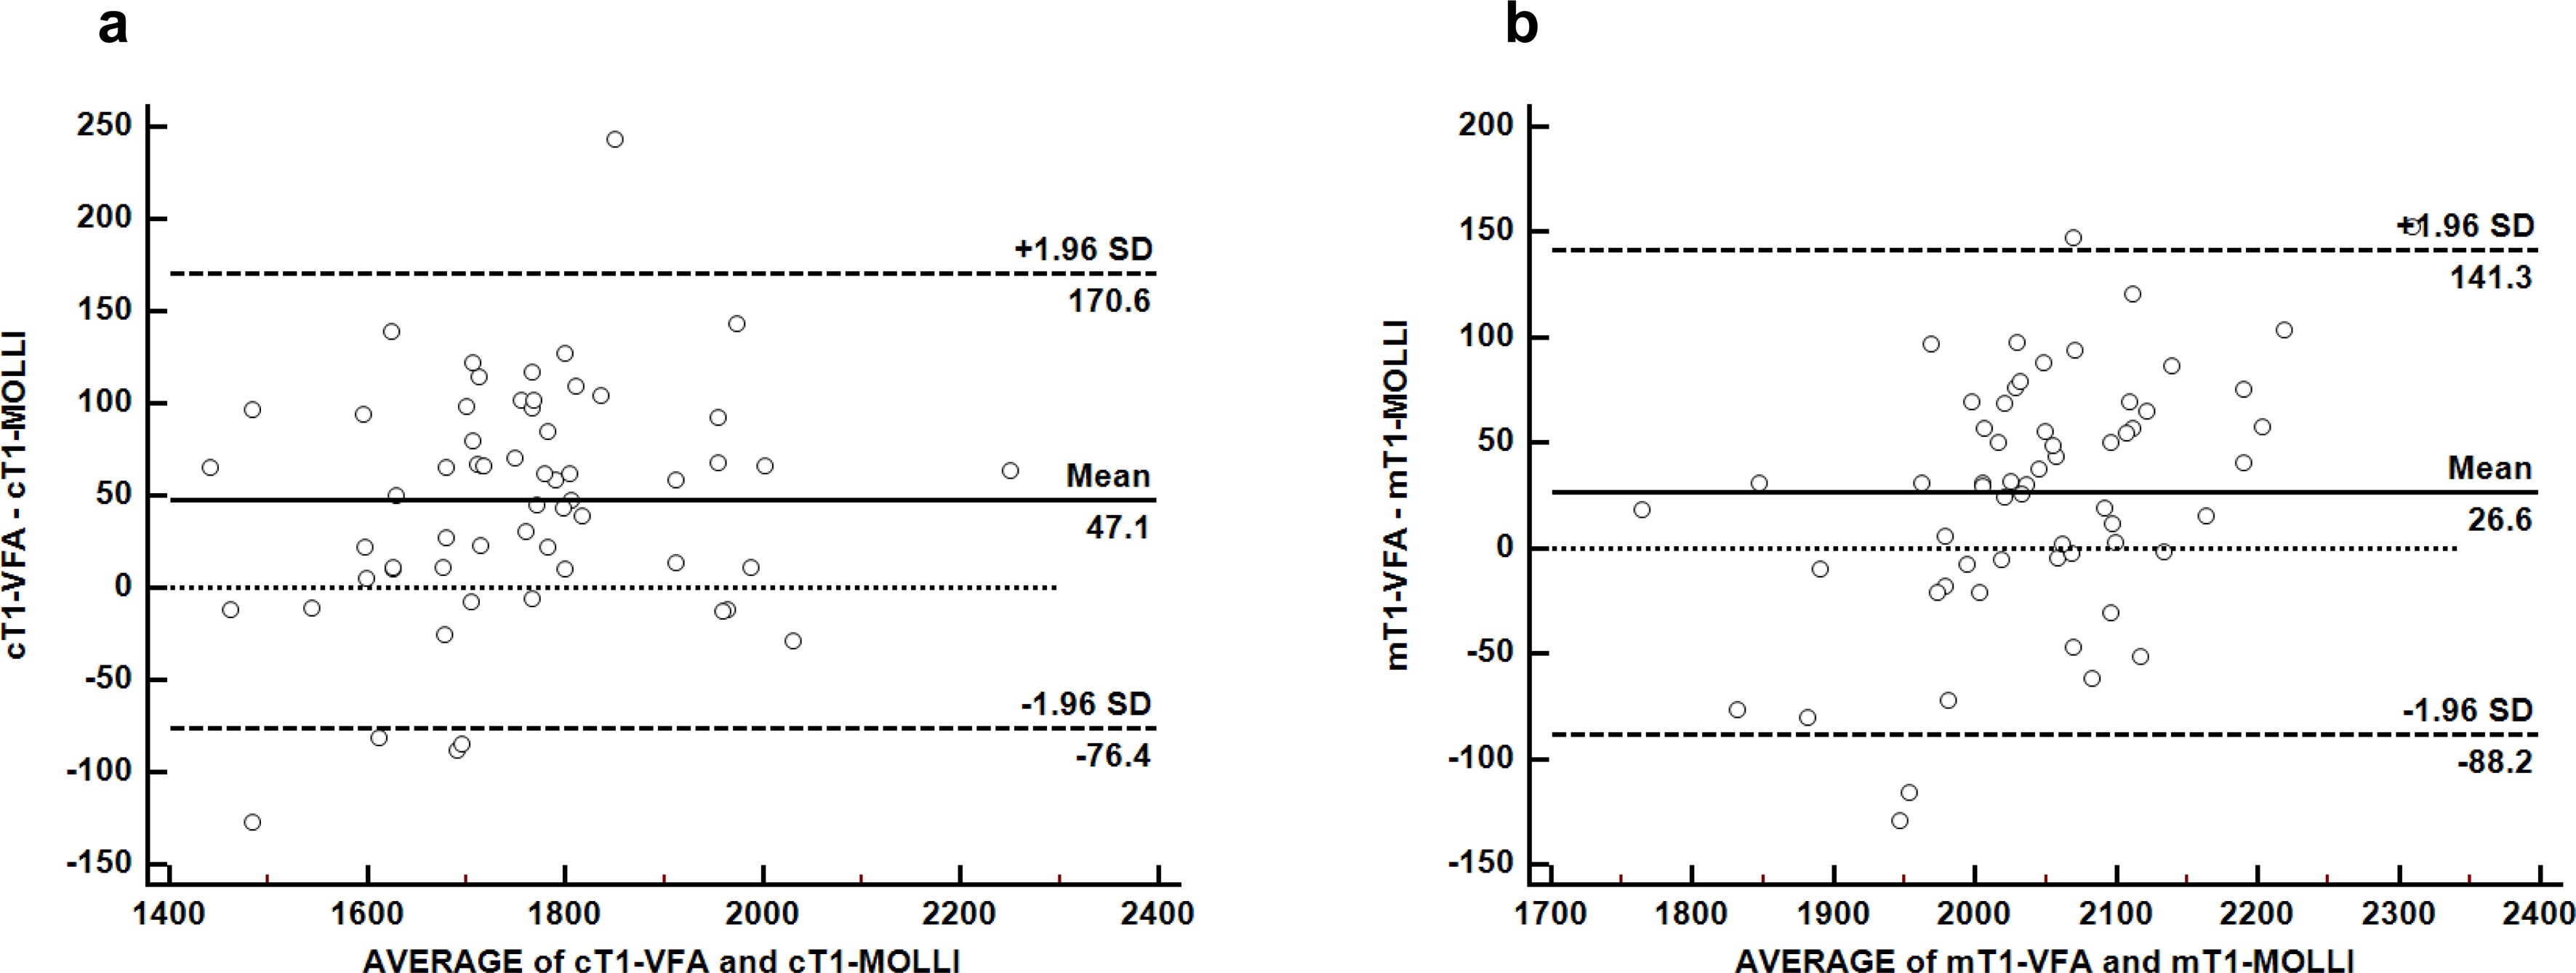
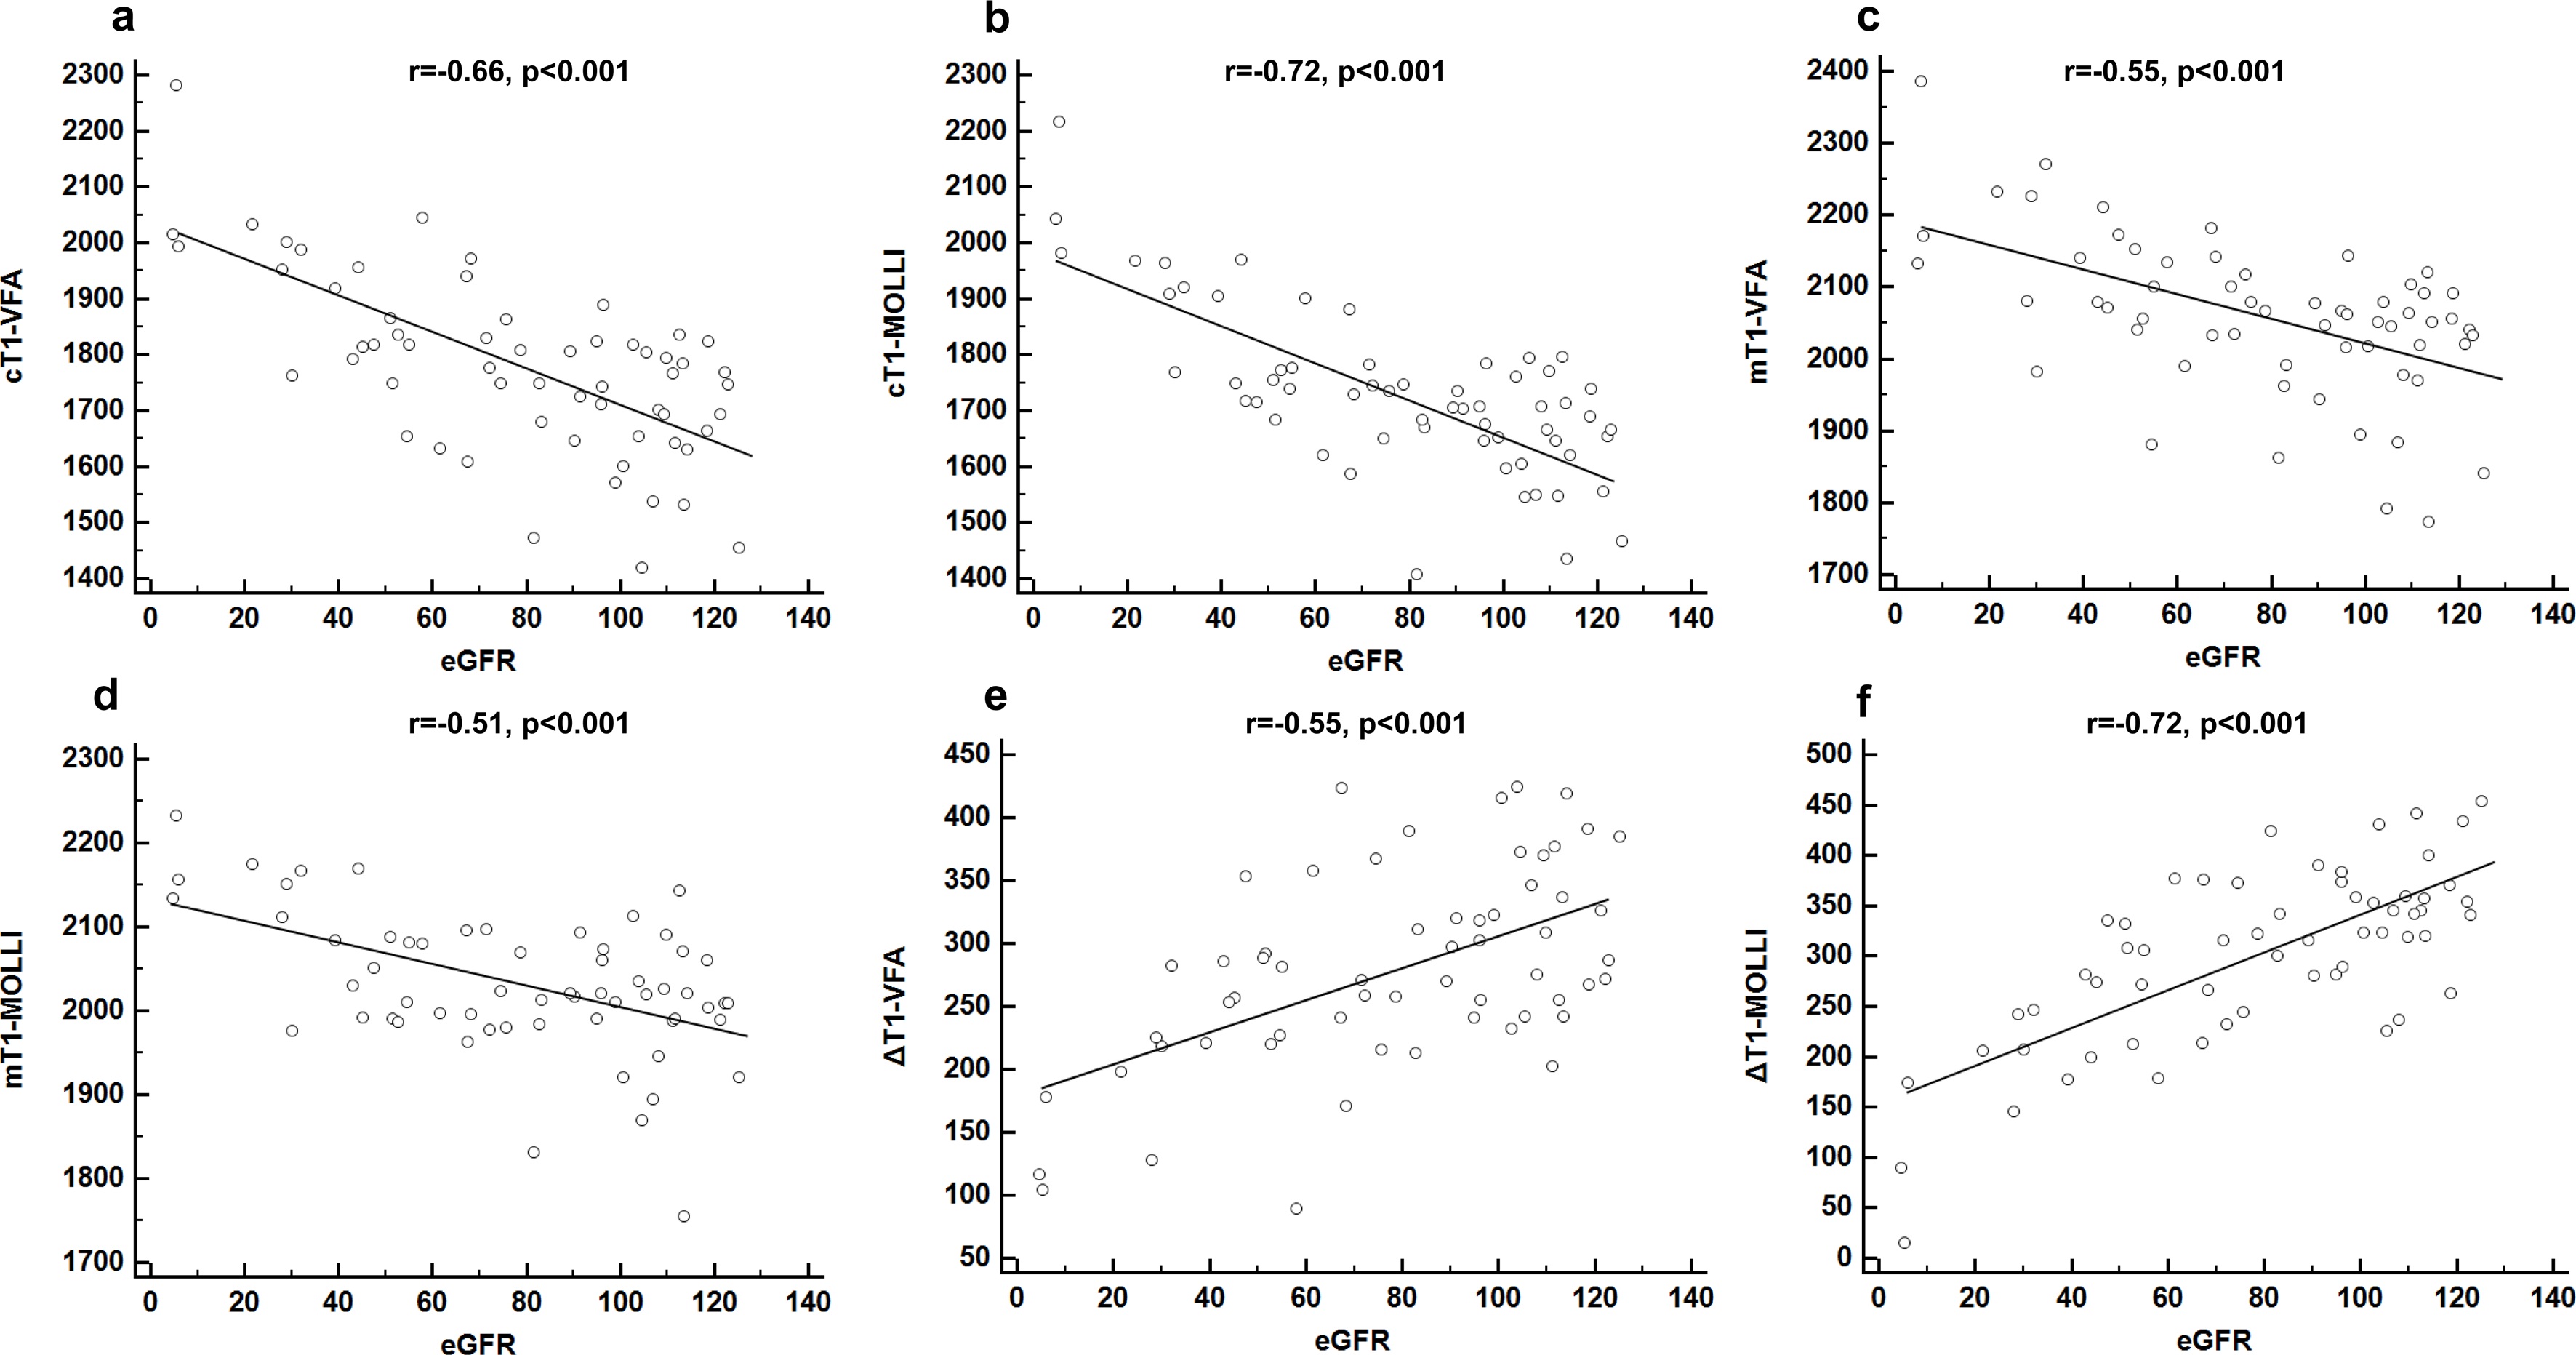
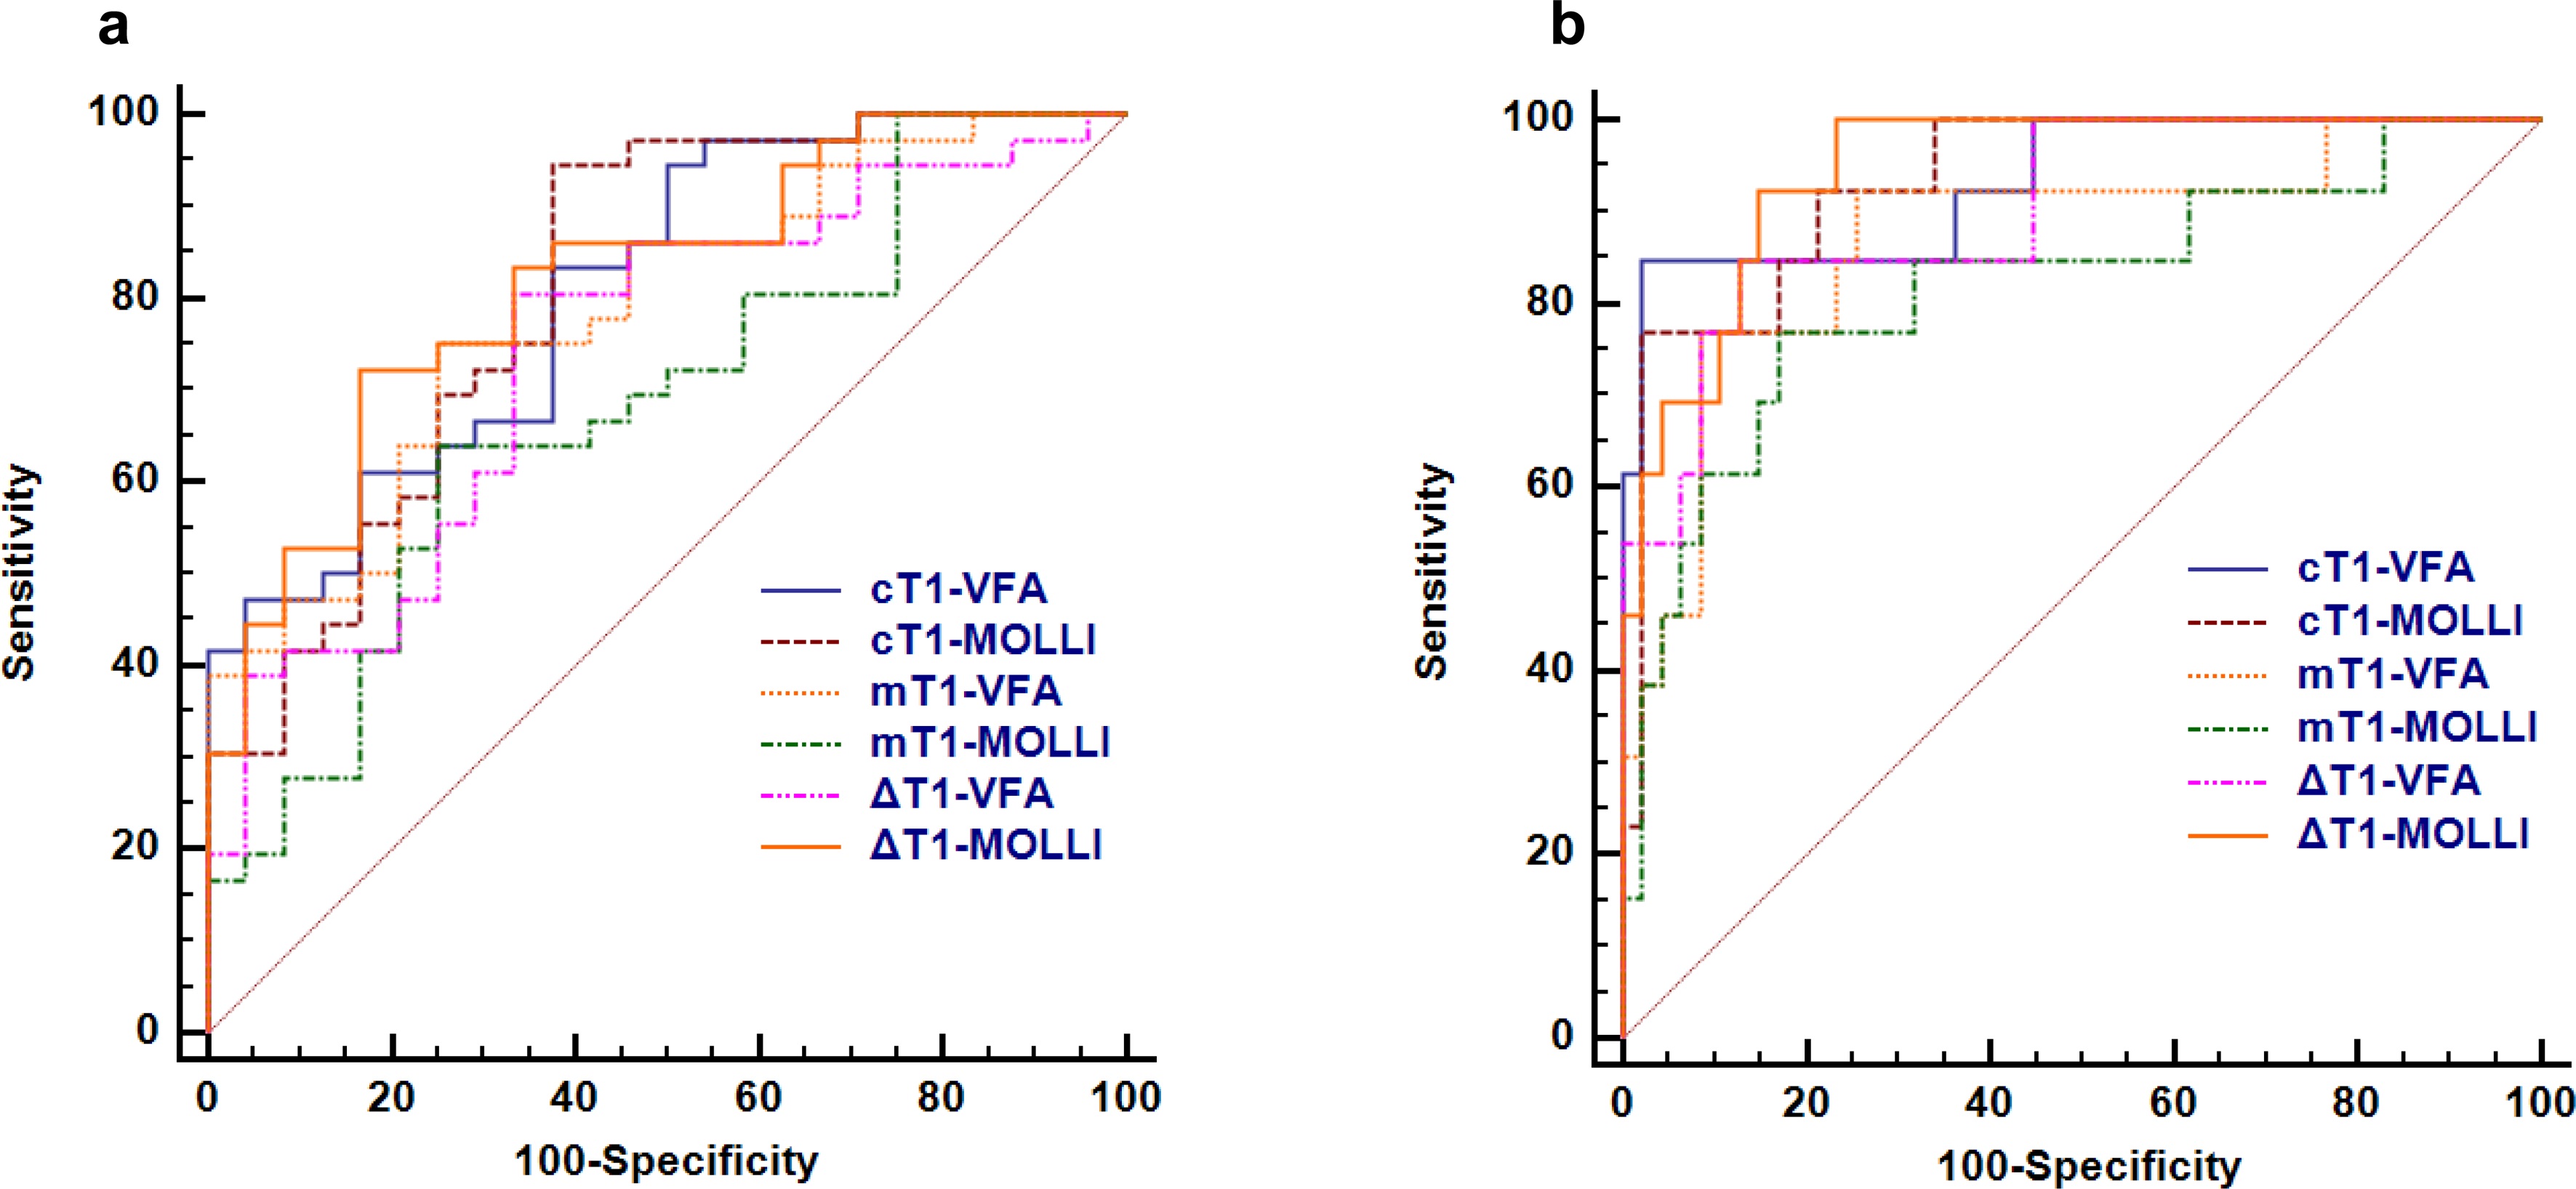
Cortical and medullary T1 values measured by VFA (cT1-VFA and mT1-VFA) showed no significant difference between those measured by MOLLI (cT1-MOLLI and mT1-MOLLI) (p>0.05). The two imaging methods show good consistency (Fig.3). The values of cT1-VFA, mT1-VFA, cT1-MOLLI, and mT1-MOLLI were negatively correlated with eGFR (p<0.001), and the r values were -0.66, -0.55,-0.72 and -0.51, respectively. The values of ΔT1-VFA and ΔT1-MOLLI were positively correlated with eGFR (p<0.001), and r values were 0.55 and 0.72, respectively(Fig.4). The AUC values of cT1-VFA, mT1-VFA, cT1-MOLLI, mT1-MOLLI, ΔT1-VFA and ΔT1-MOLLI for distinguishing IF0 group from IF(1-3) group were 0.80, 0.78, 0.81, 0.69, 0.74 and 0.82, respectively. The AUC values for distinguishing IF(0-1) group from IF(2-3) group were 0.93, 0.87, 0.93, 0.82, 0.90 and 0.95, respectively(Fig.5).Discussion
In this study, cT1-MOLLI and ΔT1-MOLLI exhibited the highest correlation with eGFR, although there was no difference between groups of the cortical and medullary T1 values measured by VFA and MOLLI. Although both methods were effective in assessing the degree of renal IF, ΔT1-MOLLI exhibited the highest effectiveness. We speculate that the data measured by MOLLI has less variability and better stability, and an significant increase of T1 relaxation times in the cortex rather than in the medulla, resulting in a significant decrease in ΔT1 values, thus ΔT1-MOLLI can further improve the diagnostic efficiency. Increased T1 reflects increased extracellular fluid resulting from fibrosis, inflammation, interstitial oedema or cellular swelling [5].Conclusion
Both VFA and MOLLI for T1mapping can be used in the non-invasive assessment of renal IF. The diagnostic efficiency of ΔT1-MOLLI is the highest, which can effectively distinguish the degree of renal interstitial fibrosis.Acknowledgements
This work was supported by National Natural Science Foundation of China (grant no. 81900698); Natural Science Foundation of Jiangsu Province (grant no. BK20210067); Precision medicine key Project of Wuxi Health Commission (grant no.J202107).References
1.Friedli I, Crowe L A, Berchtold L, et al. New magnetic resonance imaging index for renal fibrosis assessment: a comparison between diffusion-weighted imaging and T1 mapping with histological validation. Scientific reports, 2016, 6(1): 1-15.
2.Hueper K, Hensen B, Gutberlet M, et al. Kidney transplantation: multiparametric functional magnetic resonance imaging for assessment of renal allograft pathophysiology in mice. Investigative radiology, 2016, 51(1): 58-65.
3. Dekkers I A, de Boer A, Sharma K, et al. Consensus-based technical recommendations for clinical translation of renal T1 and T2 mapping MRI. Magnetic Resonance Materials in Physics, Biology and Medicine, 2020, 33(1): 163-176.
4.Mariani L H , Sebastian M , Laura B , et al. Interstitial fibrosis scored on whole-slide digital imaging of kidney biopsies is a predictor of outcome in proteinuric glomerulopathies. Nephrol Dial Transplant, 2017(2):2.
5. Buchanan C E , Huda M , Cox E F , et al. Quantitative assessment of renal structural and functional changes in chronic kidney disease using multi-parametric magnetic resonance imaging. Nephrology Dialysis Transplantation, 2019(6):6.
Figures