1286
Magnetization-Prepared Golden-angle RAdial Sparse Parallel (MP-GRASP) MRI for Rapid Free-Breathing 3D T1 Mapping of Renal Allografts1Department of Diagnostic, Molecular and Interventional Radiology, Icahn School of Medicine at Mount Sinai, New York, NY, United States, 2BioMedical Engineering and Imaging Institute, Icahn School of Medicine at Mount Sinai, New York, NY, United States, 3Nephrology, Weill Cornell Medical College, New York, NY, United States, 4Citigroup Biomedical Imaging Center, Weill Cornell Medical College, New York, NY, United States, 5Nephrology, Yale School of Medicine, New Haven, CT, United States, 6Department of Medicine, Division of Nephrology, Icahn School of Medicine at Mount Sinai, New York, NY, United States
Synopsis
Keywords: Kidney, Quantitative Imaging, T1 mapping, cortex, medulla, transplantation
This work demonstrates rapid free-breathing 3D T1 mapping of the kidney using Magnetization-Prepared Golden-angle RAdial Sparse Parallel imaging (GraspT1). The accuracy and performance of GraspT1was prospectively compared with B1-corrected variable flip angle (VFA) T1 mapping in phantom and in 13 patients with renal transplant. In phantom, both GraspT1 and VFA enabled accurate T1 estimation compared to the gold standard. In patients, free-breathing 3D GraspT1 provided better spatial resolution for improved cortico-medullary differentiation compared to the VFA method, while achieving whole-kidney coverage and similar T1 quantification, at the expense of longer acquisition time.Introduction
T1 values in the renal cortex and medulla have been correlated to kidney dysfunction related to fibrosis or inflammation, in native1-3 and transplanted kidneys4, 5. Inversion recovery (IR) T1 mapping methods have been found to have better test-retest repeatability in vitro6, however, their acquisition times are lengthy, which leads to reduced anatomical coverage of the kidney7. IR preparation in combination with a stack-of-stars readout has been shown to provide accurate, whole-organ, free-breathing T1 mapping in the liver8. Here, we aim to extend this approach, called Golden-angle RAdial Sparse Parallel T1 mapping (GraspT1) to the kidney and compare image quality and T1 mapping accuracy with variable flip angles (VFA) methods in both phantom and patients with renal transplant.Methods
Phantom Study: A cylindrical phantom containing 7 vials with MnCl2 and distilled water solutions (Fig. 1) with typical T1 values encountered in abdominal organs (300-1500 ms) was imaged on the same 3T magnet (Skyra, Siemens) where the human studies were conducted. The phantom was imaged with an inversion recovery spin-echo (IR-SE) acquisition that provided the reference T1 values, as well as two (2FA) and three flip angles (3FA) VFA, and 3D GraspT1 acquisitions with similar protocols as used in human studies (Table 1). In both phantom and human studies, a B1 mapping sequence (TR/TE/FA: 6510ms/1.91ms/8º, FOV 360x360 mm2,10 6-mm slices, 128x128 matrix) was also acquired before the VFA acquisitions, for B1 correction. An MR physicist delineated ROIs for each of the 7 vials, in the central slice of the phantom, on all acquired T1 maps, while avoiding artifacts. The T1 values measured by the GraspT1 and VFA sequences were compared to reference IR-SE T1 values by Lin’s Concordance Correlation Coefficient (CCC).Patient Study: In this IRB-approved, bi-center, prospective ongoing study, thirteen patients [M/F: 11/2, age 49.2±9 (30-65) y] with renal transplant had multiparametric MRI on a 3T magnet (Skyra, Siemens). The patients were scanned in fasting conditions with VFA and GraspT1 mapping acquisitions, in coronal orientation, centered on the hilum of the renal allograft (Table 1). Number of slices and spatial resolution was matched between the 3 acquisitions as much as possible (Table 1). Patients were instructed to suspend respiration at end-expiration during the VFA and B1 mapping acquisitions, while they could breathe freely during the 3D GraspT1 acquisition.
B1 corrected VFA T1 maps were calculated inline on the scanner, while the GraspT1 T1 maps were reconstructed offline on a Yarra server, using an in-house MATLAB R2021 algorithm. The T1 maps resulting from each acquisition were evaluated in Horos by an abdominal radiologist, who rated image sharpness, cortico-medullary differentiation, motion artifacts, streak artifacts, and image noise on a 5-point Likert scale (Figure 2, Table 2). The radiologist also selected 6 circular ROIs in the renal allograft cortex and medulla (2 each in the upper, mid- and lower pole) at the allograft hilum slice4, which were then copied onto the T1 map; average T1 for cortical and medullary ROIs was reported.
The T1 map image quality scores and T1 values were compared between sequences using paired Wilcoxon tests. Cortical and medullary T1 was then compared between sequences using Bland-Altman analysis.
Results
Phantom Study: 3D GraspT1 and VFA acquisitions achieved comparable T1 measurements to the IR-SE reference measurements (Fig.1, CCC>0.99), although the B1-corrected VFA T1 maps had subjectively lower image quality in vials within the T1 value range (1000-1500 ms; V1-3) of the kidney.Patient Study: 3D GraspT1 had higher cortico-medullary differentiation than both VFA sequences (Table 2), but higher image noise compared to 2FA VFA. 3FA VFA had higher image noise than 2FA VFA. There were slight discrepancies between the 3D GRASP T1 and the VFA measurements (Table 3; bias 4%-10%, BALA of 20-30%), with significantly higher cortical and medullary 2FA VFA T1 (Table 3).
Discussion
VFA and 3D GraspT1 achieve similar T1 mapping accuracy in phantoms. In patients, 3D GraspT1 showed improved cortico-medullary differentiation compared to VFA methods, although T1 values were similar (<10% Bland-Altman bias). Previous T1 mapping studies in renal allografts were performed at 1.5T4, or with a modified Look-Locker method5 known to systematically under-estimate T16, which prevents a direct comparison. Cortical T1 values measured in our study with VFA and GraspT1 methods were equivalent to those measured in patients with chronic kidney disease at 3T (range: 1600-2200 ms)3 with an IR method in a recent study. However, they were higher than cortical and medullary T1 in patients with chronic and acute kidney disease, measured at 3T with a respiratory-triggered IR-SE EPI method in two other studies1, 2. The differences in T1 could be due to biological differences between transplanted and dysfunctional native kidneys.Conclusions
Free-breathing 3D GraspT1 provides improved cortico-medullary differentiation, whole-kidney coverage, and equivalent kidney T1 measurements in vivo compared to the VFA method, although image acquisition time is longer. Future work will address the longer acquisition time of GraspT1 compared to VFA by exploring the stability of T1 values calculated from fewer radial trajectories per inversion time and/or fewer inversion times. We will also correlate T1 measurements with renal allograft histopathology, given its potential to serve as an imaging marker of fibrosis and inflammation.Acknowledgements
This work was supported by the NIH grants R01DK129888, R01EB030549 and R21EB032917.References
1. Buchanan C, Mahmoud H, Cox E, et al. Multiparametric MRI assessment of renal structure and function in acute kidney injury and renal recovery. Clin Kidney J. Aug 2021;14(8):1969-1976. doi:10.1093/ckj/sfaa221
2. Cox EF, Buchanan CE, Bradley CR, et al. Multiparametric Renal Magnetic Resonance Imaging: Validation, Interventions, and Alterations in Chronic Kidney Disease. Front Physiol. 2017;8:696. doi:10.3389/fphys.2017.00696
3. Wu J, Shi Z, Zhang Y, et al. Native T1 Mapping in Assessing Kidney Fibrosis for Patients With Chronic Glomerulonephritis. Front Med (Lausanne). 2021;8:772326. doi:10.3389/fmed.2021.772326
4. Bane O, Hectors SJ, Gordic S, et al. Multiparametric magnetic resonance imaging shows promising results to assess renal transplant dysfunction with fibrosis. Kidney Int. Feb 2020;97(2):414-420. doi:10.1016/j.kint.2019.09.030
5. Friedli I, Crowe LA, Berchtold L, et al. New Magnetic Resonance Imaging Index for Renal Fibrosis Assessment: A Comparison between Diffusion-Weighted Imaging and T1 Mapping with Histological Validation. Sci Rep. Jul 21 2016;6:30088. doi:10.1038/srep30088
6. Bane O, Hectors SJ, Wagner M, et al. Accuracy, repeatability, and interplatform reproducibility of T1 quantification methods used for DCE-MRI: Results from a multicenter phantom study. Magnetic resonance in medicine. May 2018;79(5):2564-2575. doi:10.1002/mrm.26903
7. Dekkers IA, de Boer A, Sharma K, et al. Consensus-based technical recommendations for clinical translation of renal T1 and T2 mapping MRI. Magma. Feb 2020;33(1):163-176. doi:10.1007/s10334-019-00797-5
8. Feng L, Liu F, Soultanidis G, et al. Magnetization-prepared GRASP MRI for rapid 3D T1 mapping and fat/water-separated T1 mapping. Magnetic resonance in medicine. Jul 2021;86(1):97-114. doi:10.1002/mrm.28679
Figures
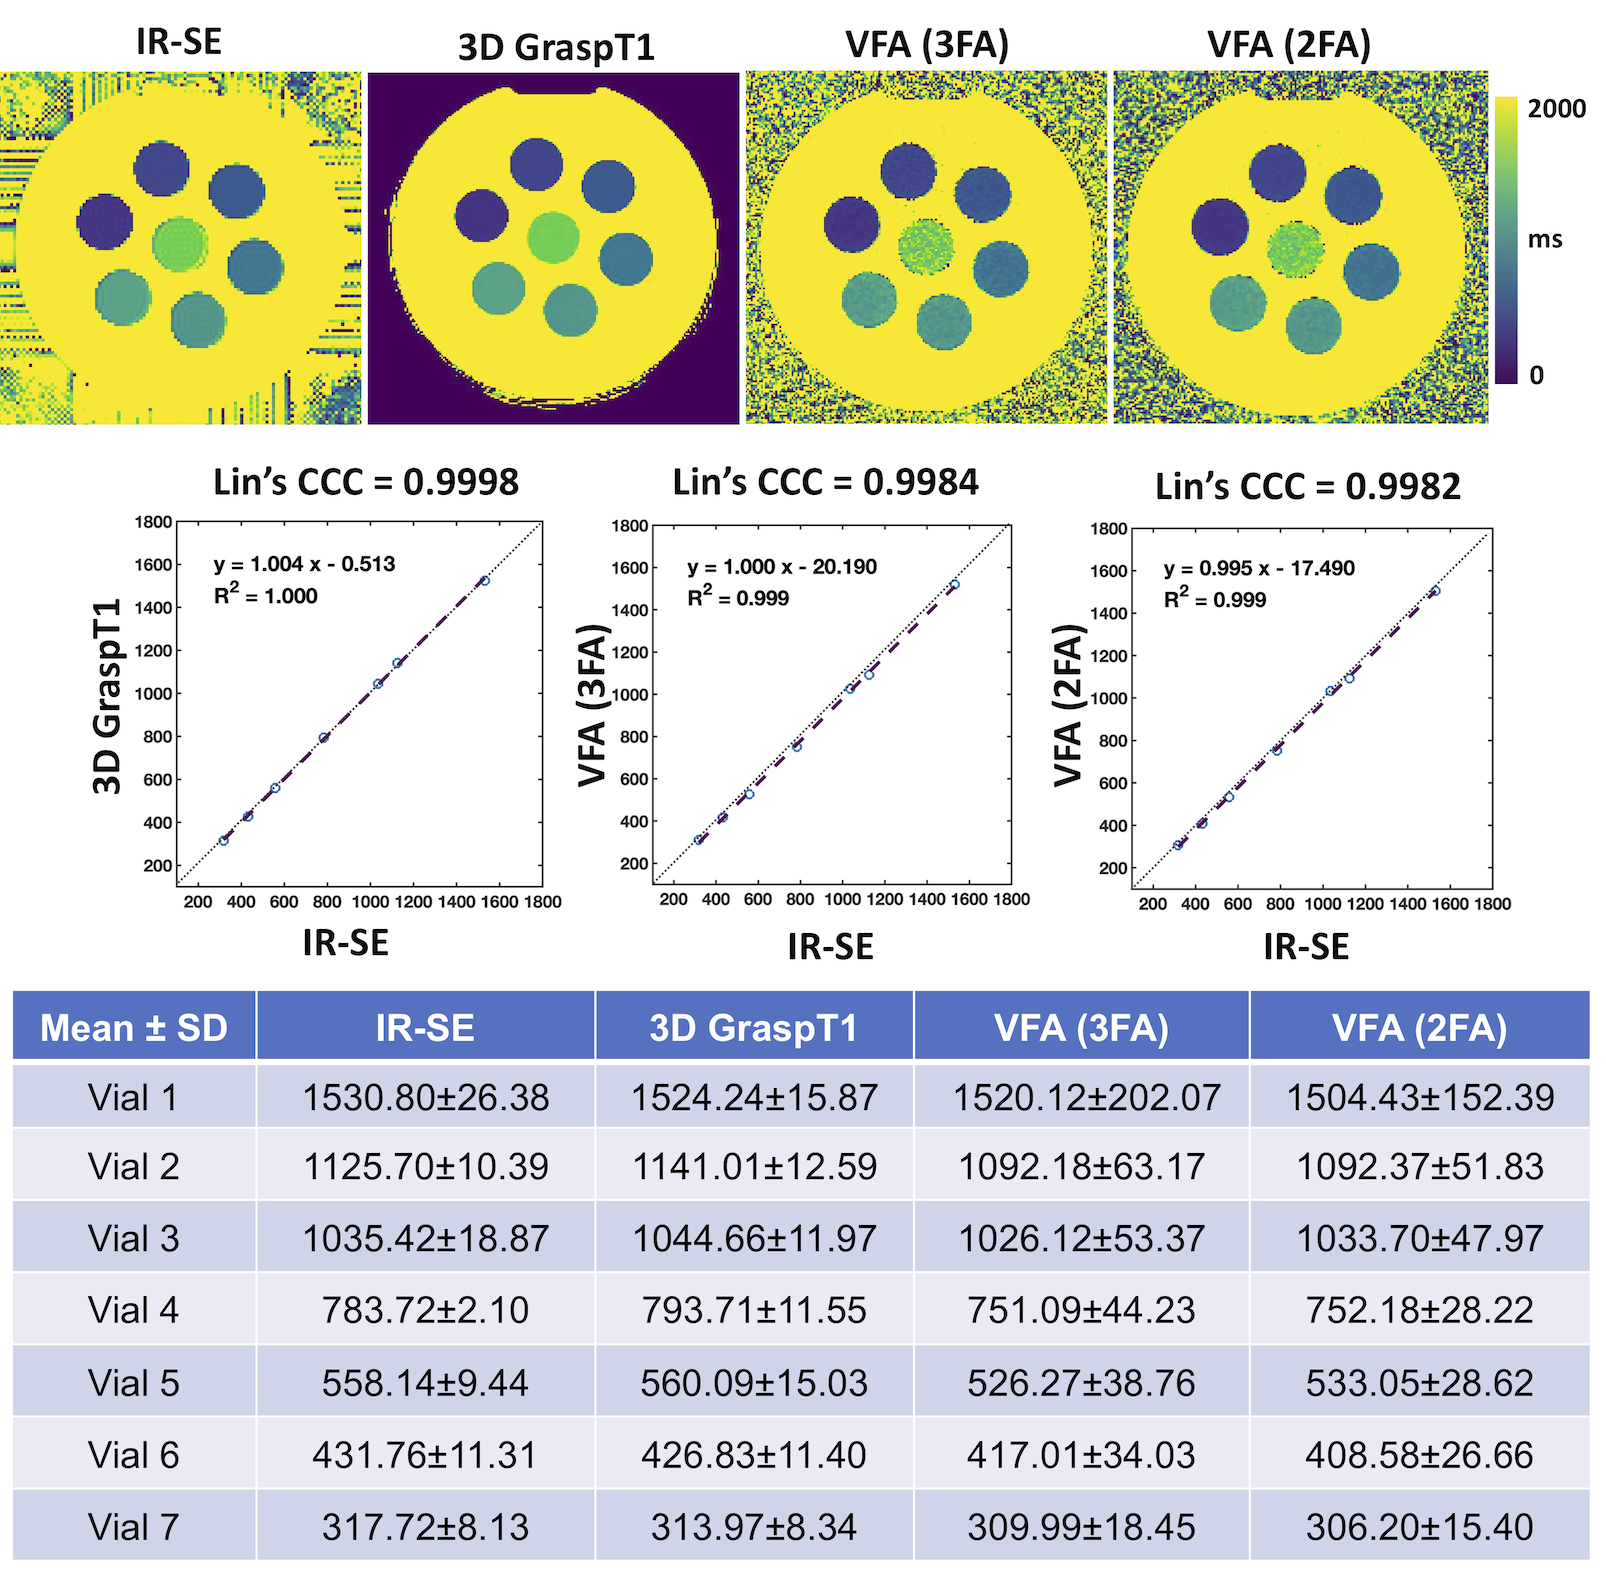
Figure 1. T1 maps and measurements with an IR-SE reference sequence, 3D GraspT1 as well as the 2 and 3 FA VFA sequences in a spherical phantom. Vials containing T1 shortening solutions are ordered clockwise in order of increasing T1 (vials 2-7), with the longest T1 in the central vial 1. Mean ± standard deviation of T1values in each vial are shown, as well as Lin’s Concordance Correlation Coefficient (CCC). For the same spatial resolution, the VFA T1 maps are notably noisier than the 3D GraspT1 maps.
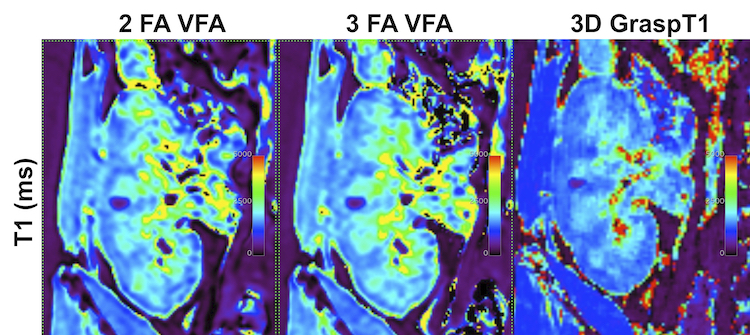
Figure 2. Examples of T1 maps (ms) acquired in a 41 year-old male patient with right-sided renal allograft and no pathologically confirmed renal transplant dysfunction, showing improved cortico-medullary differentiation on the 3D and 2D GRASPT1 acquisitions (scores of 5 out of 5), compared to the VFA 2 and 3 FA acquisitions (scores of 4 out of 5).
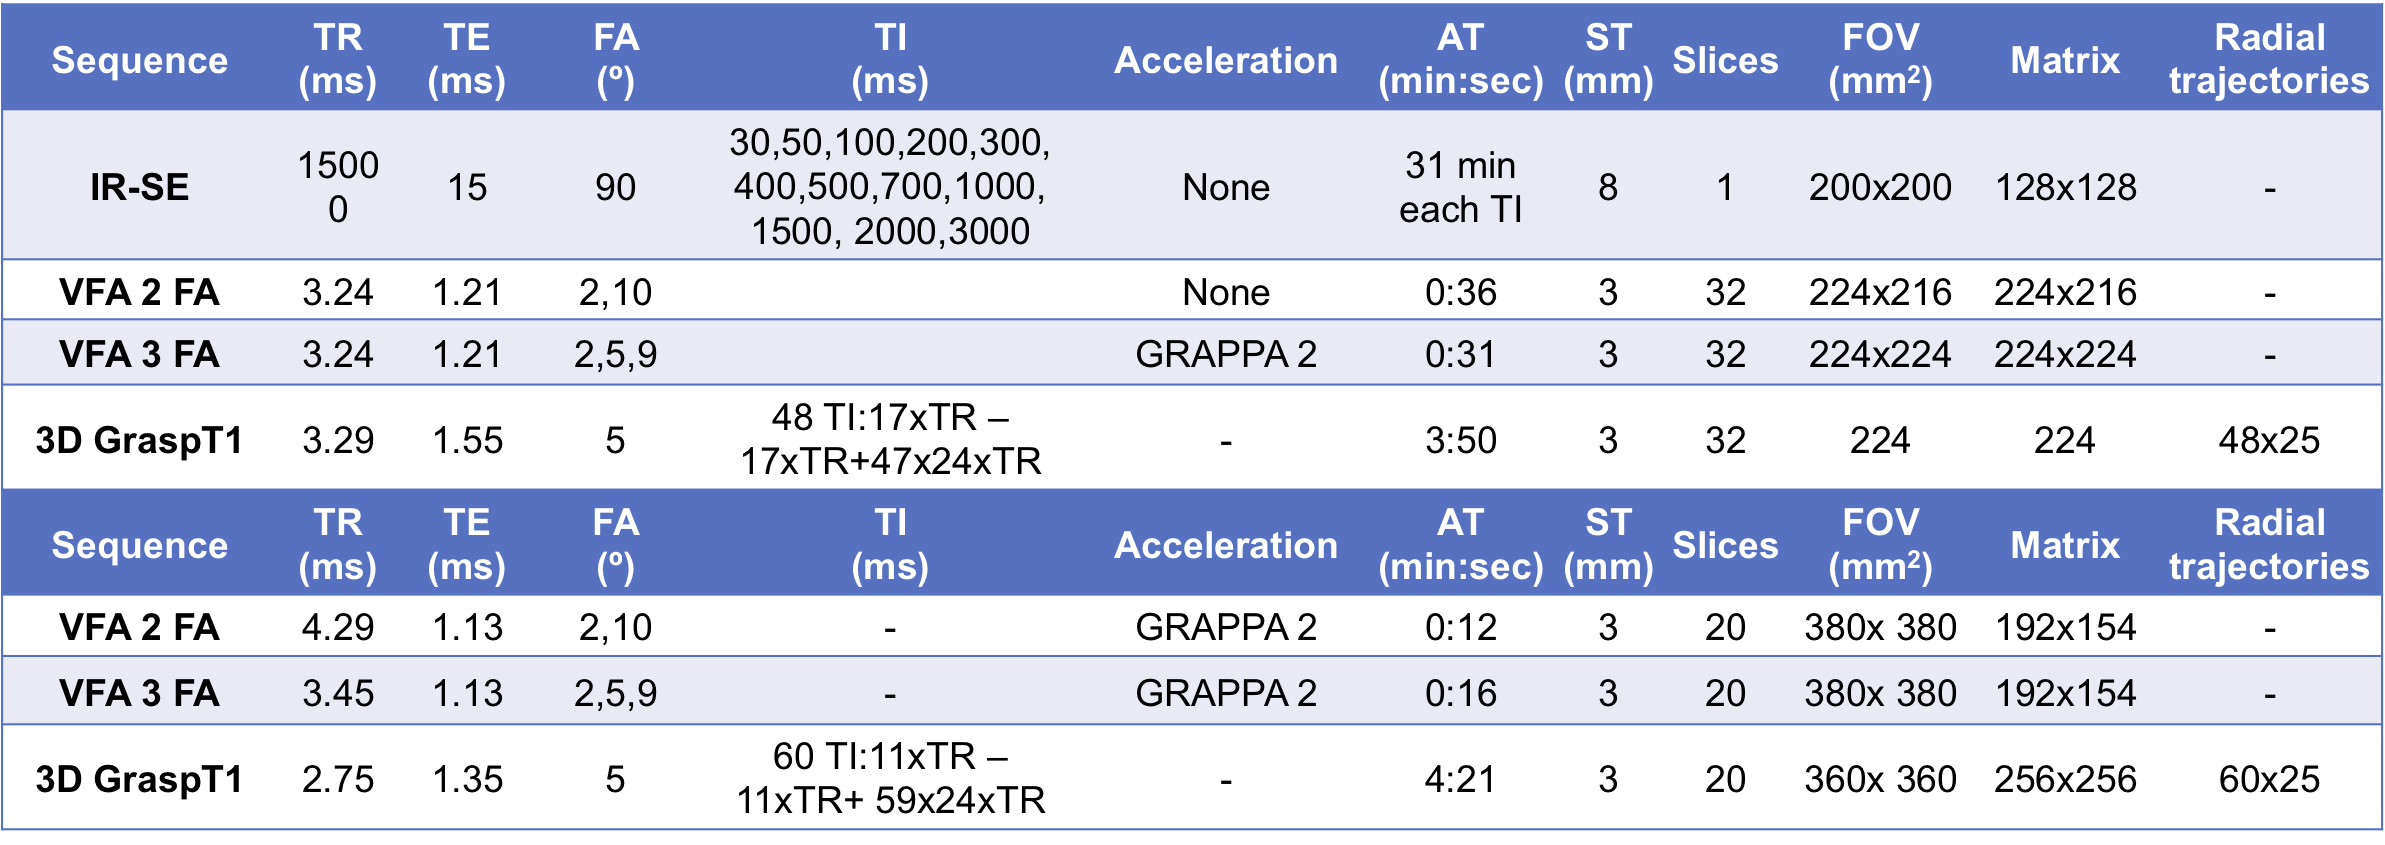
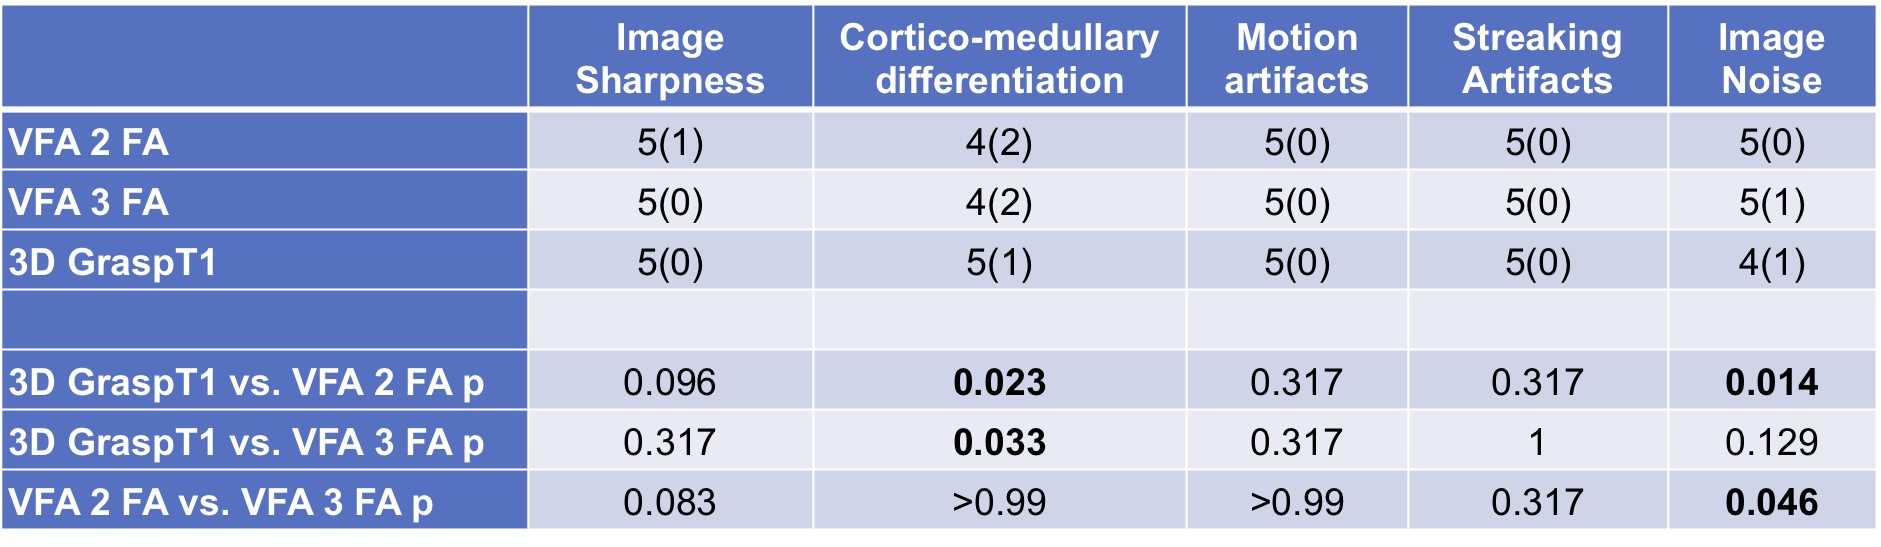
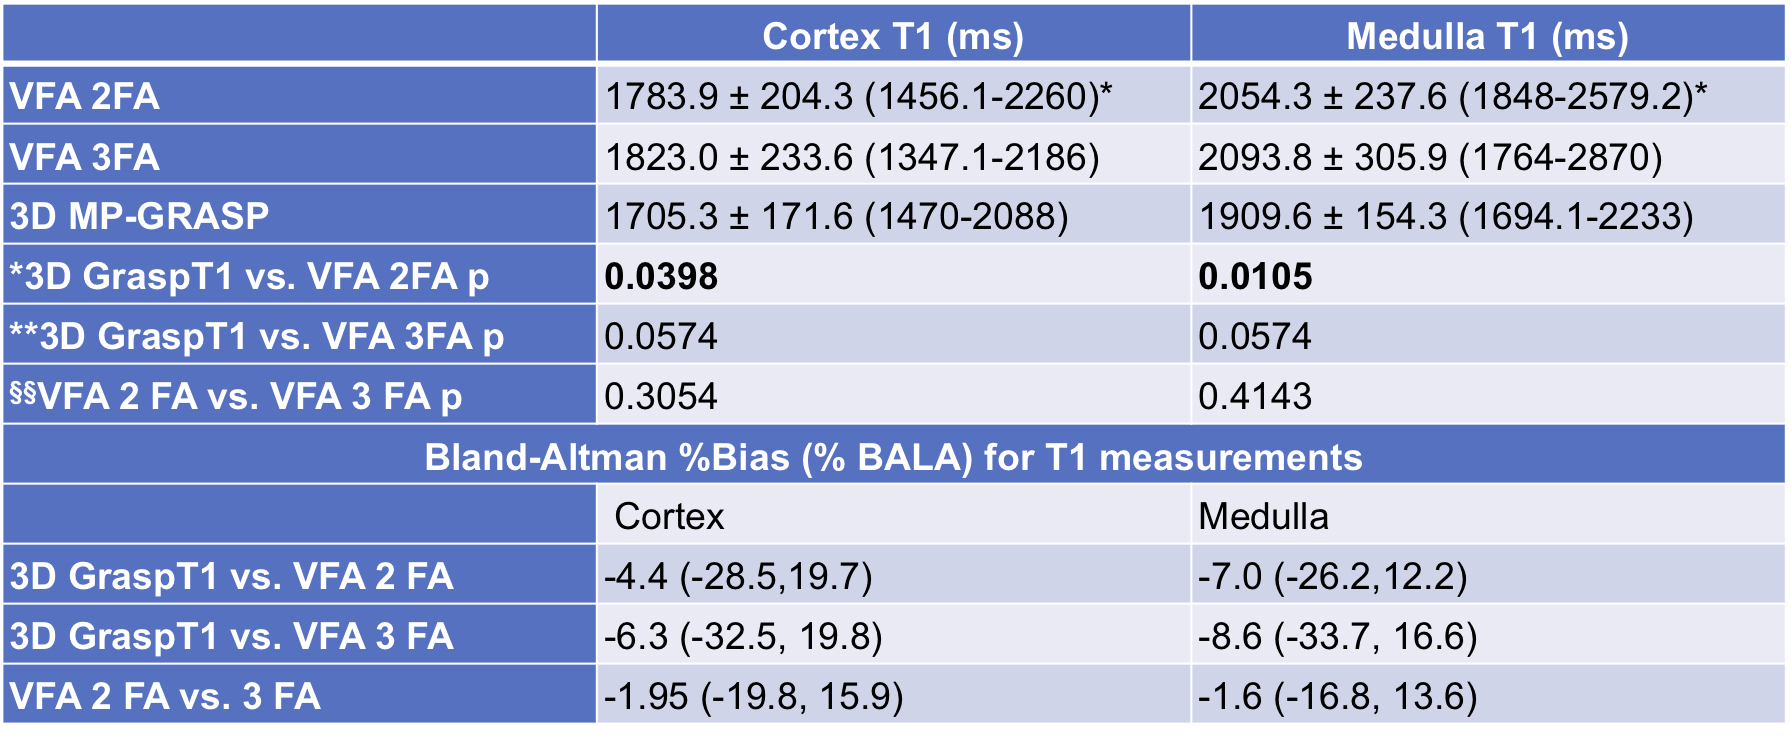
Table 3. T1 (ms) values in the patient cohort, for each T1 mapping method are given as mean ± standard deviation (range). Paired Wilcoxon p-values for inter-sequence comparison of T1 values for each patient are shown. The Bland-Altman bias and limits of agreement (BALA) are given as percentages of the mean of two measurements, for each sequence comparison.