1285
Diffusion weighted, intravoxel incoherent motion, diffusion kurtosis tensor MR imaging in chronic kidney disease: correlations with histology
Jie Zhu1, Jia-Yin Gao1, Pu-Yeh Wu2, and Yan Song1
1Beijing Hospital, Beijing, China, 2GE Healthcare, Beijing, China
1Beijing Hospital, Beijing, China, 2GE Healthcare, Beijing, China
Synopsis
Keywords: Data Analysis, Diffusion/other diffusion imaging techniques
Noninvasive, repeatable and accurate biomarkers to identify renal histological changes for tailoring treatment and evaluating renal prognosis are demanded. In this study, we aimed to compare and probe correlations of parameters derived from standard DWI and its extending models including IVIM, DTI, and DKTI with the pathological and functional alterations in CKD. We found that the corrected diffusion-related indices, including cortical and medullary D and MD, as well as medullary FA were superior to ADC, perfusion-related and kurtosis indices for evaluating alterations of renal pathology and function in CKD patients, and these metrics were also correlated with eGFR and Scr.Background
The prevalence of chronic kidney disease (CKD), a continuous reduction in renal function leading to renal failure, is steadily increasing and being recognized as major public health problems worldwide (1). In clinical practice, percutaneous renal biopsy is the reference standard to confirm pathological changes in CKD. However, it is time-consuming and invasive with the risk of complications (1). Therefore, it is essential to develop a noninvasive, repeatable and accurate modality to identify renal histological changes for tailoring treatment and evaluating renal prognosis. DWI has shown promise for assessing renal function and tissue microstructures in various kidney diseases (2)(3). However, there are concerns that ADC obtained from conventional mono-exponential model may not accurately reflect the diffusivity, because of the complexity of renal structure. Thus, advanced DWI methods have been applied in CKD. IVIM imaging can distinguish both pure molecular diffusion and capillary perfusion. DTI allows characterization of the orientation and magnitude of the anisotropic diffusion. DKI and DKTI have been developed to capture the non-Gaussian diffusion with reflecting the complexity of renal structure (4)(5)(6). Previous studies have compared these techniques with renal function and biopsy results in patients with CKD (7)(8)(9)(10)(11). However, existing findings are still controversial, potentially due to various acquisition parameters and measuring methods (7)(10)(11). To the best of our knowledge, this study is the first attempt to investigate the application of conventional DWI and its extended models including IVIM, DTI and DKTI in CKD patients, by comparing the quantitative diffusion metrics of both cortex and medulla with histopathological results.Methods
79 patients (Table 1) and 10 healthy controls were involved in the study. Scr, 24h-UPRO levels and eGFR were measured. Renal pathologic scores included glomerulosclerosis index (GSI) and tubulointerstitial fibrosis index (TBI). CKD patients were divided into: group 1, mildly impaired renal injury (GSI and TBI < 2, 60 cases); group 2, moderate-severely (m-s) impaired renal injury (GSI and TBI ≥ 2, 16 cases). MRI examinations were performed on a 3.0-T MRI scanner (Discovery MR750; GE Healthcare, Milwaukee, WI). DWI, IVIM and DKTI were acquired using respiratory-triggered EPI sequences. Quantitative maps for DWI-derived parameters (ADC), IVIM-derived parameters (D, D* and f) and DKTI-derived parameters (MD, FA and MK) were obtained using FuncTool Software implemented in GE Advantage Workstation 4.4. Three circular ROIs were respectively drawn in anterior, middle and posterior part of medulla on the central slice of each kidney, and mean value was recorded. At the same slice, ROI of cortex was delineated using free curve. Paired sample t-test was applied to compare MRI metrics between right and left kidneys. Inter-observer agreements were evaluated by ICCs. Statistical comparisons of MRI metrics among group 1, 2 and healthy controls were performed with one-way ANOVA and post hoc Scheffe test. Spearman correlation was used to analyze the correlation of MRI metrics with pathological results and clinical indexes. ROC analysis was applied to determine the performance of MRI metrics in differentiating mild and m-s glomerulosclerosis / tubulointerstitial fibrosis, and AUC, sensitivity, and specificity were recorded. SPSS 22.0 (IBM Corp, Armonk, NY) and MedCalc 19.0.4 (MedCalc, Mariakerke, Belgium) were used for statistical analyses. P < 0.05 was considered statistically significant.Results
Pathological results of all patients are listed in Table 1. In all subjects, all MR metrics showed no significant differences between right and left kidneys. Thus, average metrics of left and right kidneys were calculated for further analysis. As cortical and medullary D* showed high standard deviation with moderate inter-observer agreements, they were not used in following results. There were significant differences of cortical and medullary MD, cortical D, medullary FA among 3 groups ( Figure 1). Cortical and medullary MD, and cortical D showed significant difference between group 1 and 2. There were negative correlations of cortical and medullary MD, cortical D, and medullary FA with GSI score. There were also negative correlations of cortical and medullary MD and D, and medullary FA with TBI score(Figure 2). The above mentioned metrics were positively correlated with eGFR and negatively correlated with Scr, but not correlated with 24h-UPRO (data not shown). Table 2 and Figure 3a shows the ROC analysis results of MRI metrics in discriminating mild and m-s glomerulosclerosis. Excellent discriminative performance was obtained for cortical MD. It had the highest AUC of 0.790, where optimal cut-off value was 2.555 mm2/s with specificity of 84.13% and sensitivity of 68.75%. Table 2 and Figure 3b shows the ROC analysis results of MRI metrics in discriminating mild and m-s tubular interstitial fibrosis. Cortical D had the highest AUC of 0.745, where optimal cut-off value was 2.227 mm2/s with specificity of 84.37% and sensitivity of 53.33%.Conclusion
In conclusion, this study demonstrated that cortical and medullary D and MD, and medullary FA were feasible for evaluating the alterations of renal pathology and function in CKD patients, by comparing the conventional monoexponential DWI model and advanced diffusion models including IVIM, DTI and DKI. Our results indicated that the corrected diffusion-related indices were superior to ADC, perfusion-related and kurtosis indices, in assessing the degree of renal pathological injury.Acknowledgements
No acknowledgement found.References
1. Whittier WL, Korbet SM. Timing of complications in percutaneous renal biopsy. J Am Soc Nephrol. 2004;15(1):142–147. 2. Zhao J, Wang ZJ, Liu M, et al. Assessment of renal fibrosis in chronic kidney disease using diffusion-weighted MRI. Clin Radiol. 2014;69(11):1117–1122. 3. Wang H, Cheng L, Zhang X, et al. Renal Cell Carcinoma : Diffusion- weighted MR Imaging for Subtype Differentiation at 3.0T. Radiology.2010;257(1):135- 143. 4. Jensen JH, Helpern JA, Ramani A, Lu H, Kaczynski K. Diffusional kurtosis imaging: The quantification of non-Gaussian water diffusion by means of magnetic resonance imaging. Magn Reson Med. 2005;53(6):1432–1440. 5. Jensen JH, Helpern JA. MRI quantification of non-Gaussian water diffusion by kurtosis analysis. NMR Biomed. 2010;23(7):698–710. 6. Rosenkrantz AB, Padhani AR, Chenevert TL, et al. Body diffusion kurtosis imaging: Basic principles, applications, and considerations for clinical practice. J Magn Reson Imaging. 2015;42(5):1190–1202. 7. Mao W, Zhou J, Zeng M, et al. Chronic kidney disease: Pathological and functional evaluation with intravoxel incoherent motion diffusion-weighted imaging. J Magn Reson Imaging. 2018;47(5):1251–1259. 8. Nassar MK, Khedr D, Abu-Elfadl HG, et al. Diffusion Tensor Imaging in early prediction of renal fibrosis in patients with renal disease: Functional and histopathological correlations. Int J Clin Pract. 2021;75(4). 9. Liu Z, Xu Y, Zhang J, et al. Chronic kidney disease: pathological and functional assessment with diffusion tensor imaging at 3T MR. Eur Radiol. 2015;25(3):652–660. 10. Sułkowska K, Palczewski P, Furmańczyk-Zawiska A, et al. Diffusion Weighted Magnetic Resonance Imaging in the Assessment of Renal Function and Parenchymal Changes in Chronic Kidney Disease: A Preliminary Study. Ann Transplant. 2020;25(e920232):1–9. 11. Liu Y, Zhang GMY, Peng X, et al. Diffusional kurtosis imaging in assessing renal function and pathology of IgA nephropathy: a preliminary clinical study. Clin Radiol. 2018;73(9):818–826.Figures
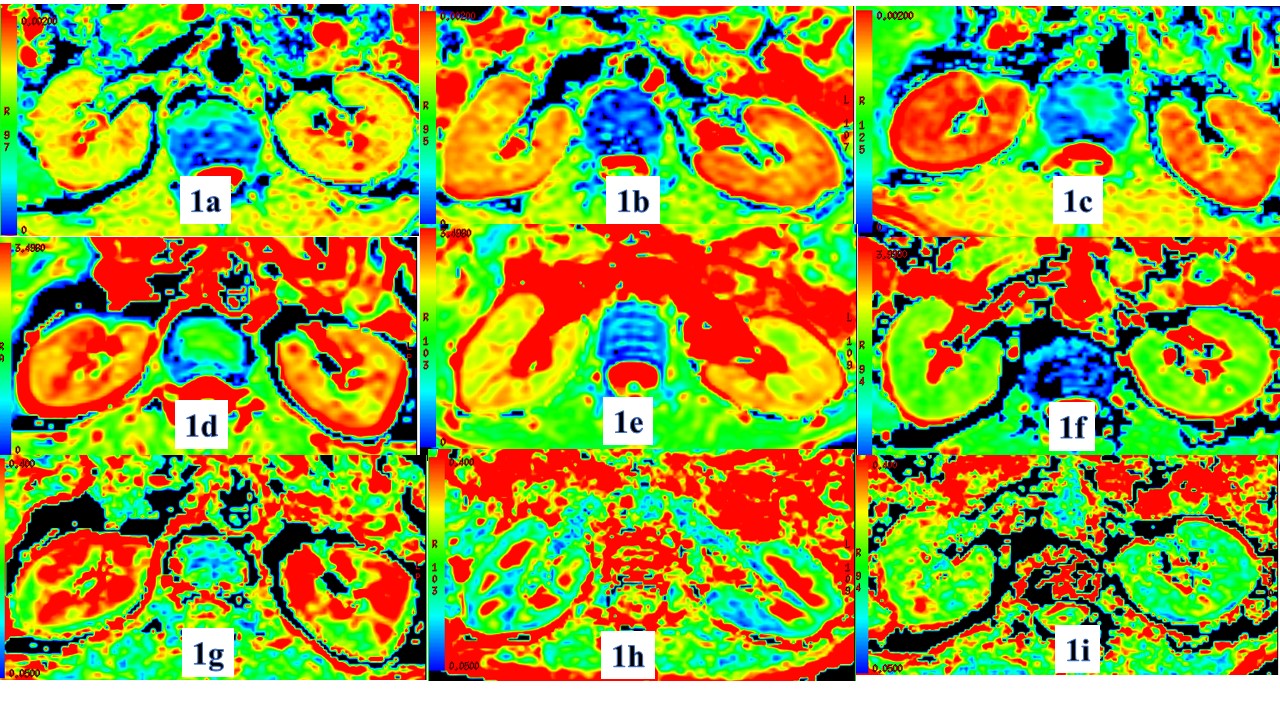
Figure
1. Diffusion
properties of kidneys of control group (1a, 1d, 1g), group1
(1b, 1e, 1h) and group 2 (1c, 1f, 1i). D map (1a-1c), MD map (1d-1f) and FA map
(1g-1i) show that the D, MD (mm2/s) and FA value of kidneys were difference
among three groups.
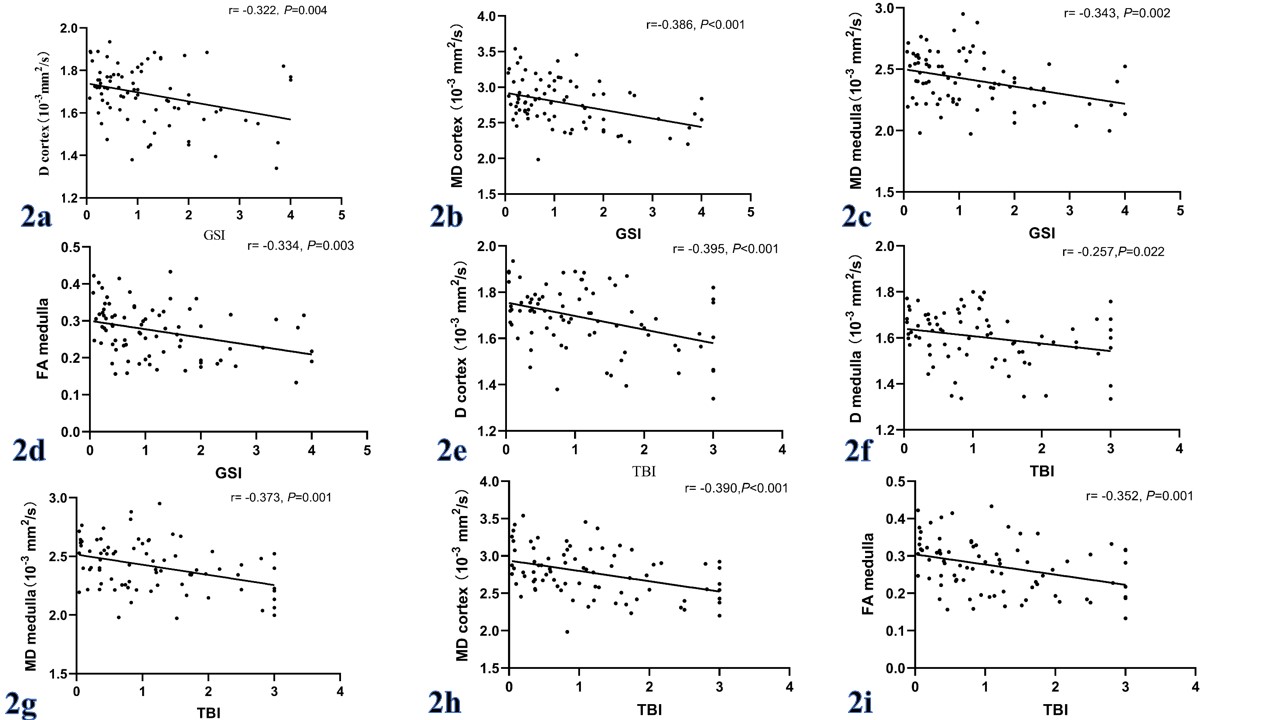
Figure 2. Correlations
between glomerulosclerosis index (GSI) and D cortex (2a), MD cortex (2b), MD
medulla (2c) and FA medulla (2d). Correlations between tubulointerstitial
fibrosis index (TBI) and D cortex (2e), D medulla (2f), MD cortex (2g), MD
medulla (2h) and FA medulla (2i). Scatterplots indicate significantly negative
correlations between renal pathologic changes and MR metrics. The solid lines
indicate regression lines.
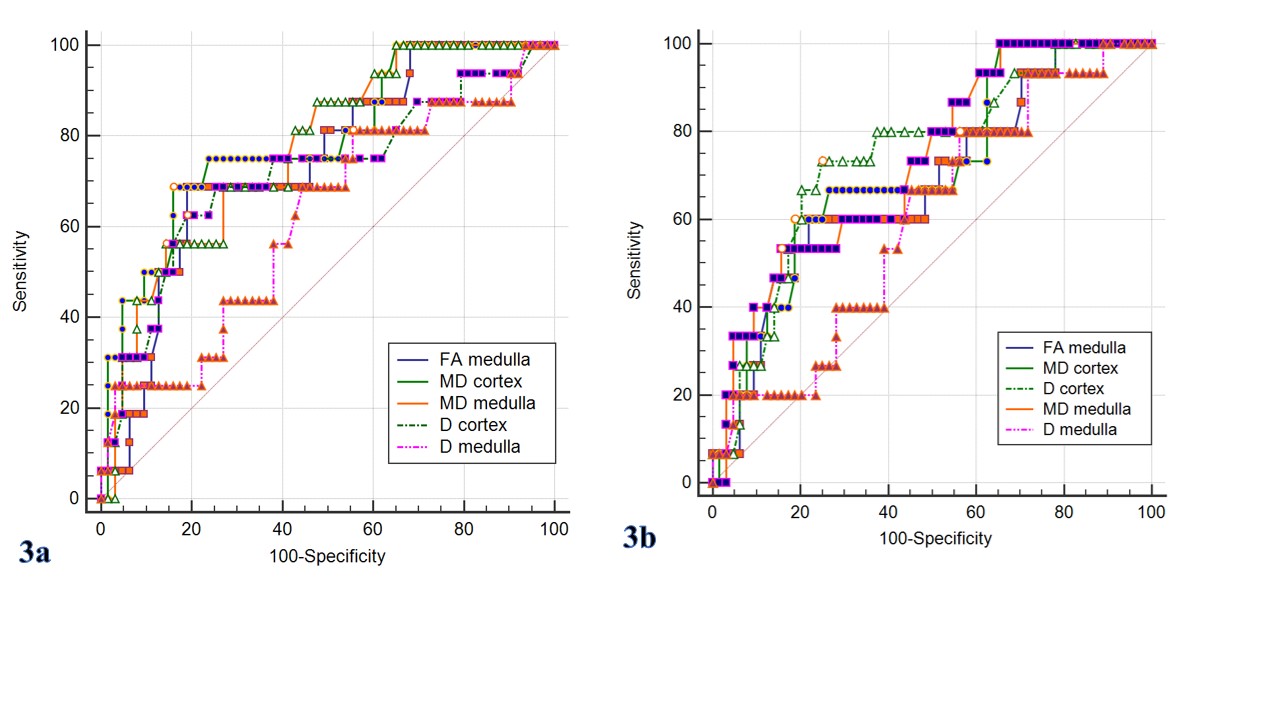
Figure 3. The ROC curve analysis of cortical and medullary diffusion-derivedparameters
to distinguish between mild and m-s renal injury. (3a)mild (GSI< 2 points)
and m-s (GSI≥ 2
points) glomerulosclerosis. Cortical MD shows the highest AUC of 0.790 for
discrimination.(3b) mild (TBI< 2
points) and m-s (TBI≥ 2 points) tubular interstitial fibrosis. Cortical D
showes the highest AUC of 0.745 for discrimination. GSI: glomerulosclerosis
index; TBI: tubularinterstitial fibrosis
index; m-s: moderate to severe
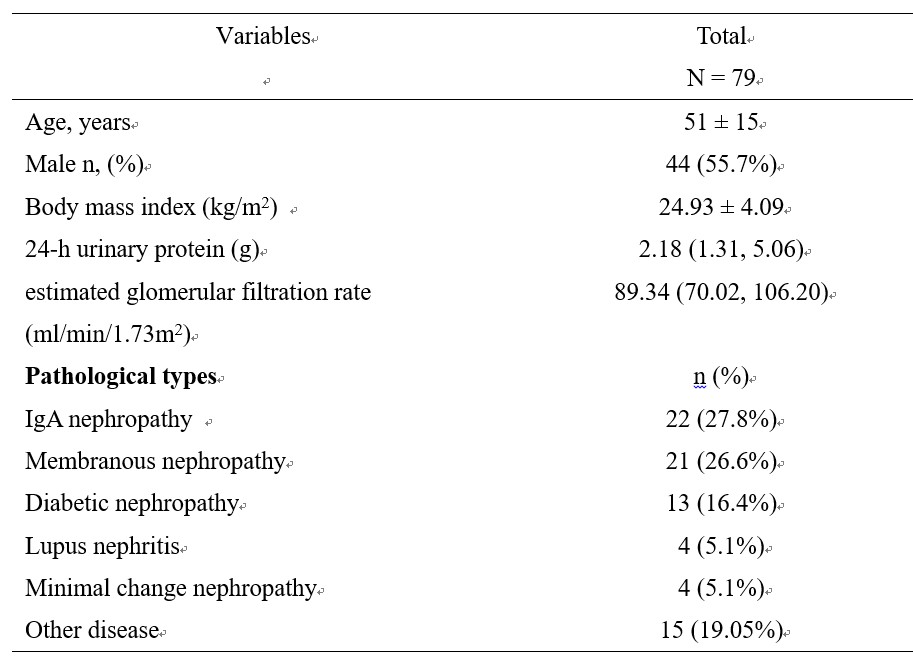
The basic data,
laboratory indexes and pathological types of the patients
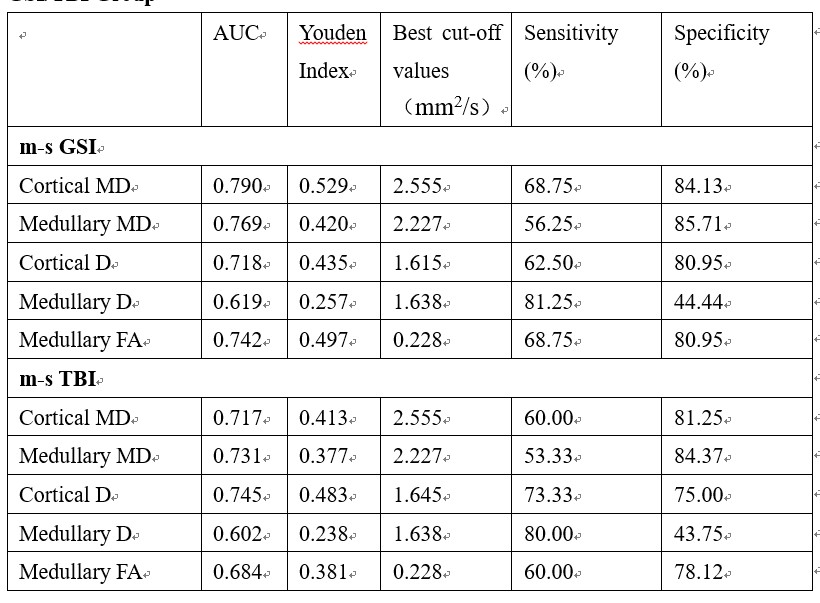
Optimal Cutoff, Area
Under the Receiver-Operating Characteristic Curve, Sensitivity, and Specificity
of MR Parameters to Discriminate Patients in mild GSI/TBI group from m-s GSI/TBI
Group
DOI: https://doi.org/10.58530/2023/1285