1284
Quality Control of MRI-based Kidney Volume Estimation in ADPKD patient in clinical practice
Chenglin Zhu1, Arman Sharbatdaran1, Hreedi Dev1, Xinzi He1, Jon D. Blumenfeld2, James M. Chevalier2, Daniil Shimonov2, and Martin R. Prince1,3
1Radiology, Weill Cornell Medicine, New York, NY, United States, 2Rogosin Institute, New York, NY, United States, 3Radiology, Columbia University Vagelos College of Physicians and Surgeons, New York, NY, United States
1Radiology, Weill Cornell Medicine, New York, NY, United States, 2Rogosin Institute, New York, NY, United States, 3Radiology, Columbia University Vagelos College of Physicians and Surgeons, New York, NY, United States
Synopsis
Keywords: Kidney, Data Acquisition
Total kidney volume (TKV) is a critical biomarker for monitoring disease severity in autosomal dominant polycystic kidney disease (ADPKD). TKV is typically measured by manually contouring kidneys on one sequence from abdominal MRI without any quality control. Here we show that by using a deep learning model to measure kidney volume on 5 routinely acquired abdominal MRI sequences, it is possible to apply outlier analysis to find images with acquisition artifacts and to correct or exclude them from TKV estimation. This improves volume measurement consistency among the 5 sequences from 4.3% to 1.3% after quality control.Introduction
Total kidney volume (TKV) and annual kidney growth rate are validated prognostic biomarkers for autosomal dominant polycystic kidney disease (ADPKD), which help predict when a patient is likely to need renal replacement therapy and determine eligibility for tolvaptan therapy1,2. Manual kidney segmentation on abdominal magnetic resonance images (MRI) is regarded as the gold standard for TKV estimation. Yet, due to the enlarged kidneys, sometimes substantially filling the abdomen and extending down into the pelvis, multiple breath-hold acquisitions are required on MRI covering a large field-of-view making the images susceptible to composing artifacts, misregistration, and motion artifacts which can all, lead to inaccurate TKV estimation that is not consistent from one exam to the next. As abdominal MRI has multiple sequences depicting kidneys, it is unclear which sequence is optimal for kidney volume measurements. Here we develop a quality control system in which kidney volumes are measured using deep learning on five routinely acquired abdominal MRI pulse sequences, and images are examined for acquisition artifacts so they can be corrected or excluded from determining organ volume.Methods
This single-center retrospective study included 95 abdominal MRI exams of ADPKD patients that included five MRI sequences: axial and coronal single-shot fast spin echo (SSFSE), axial 3D spoiled gradient echo Dixon T1, axial and coronal steady-state free precession (SSFP). Model-assisted segmentation (using an in-house 3D nnU-Net trained/validated with radiologist-labeled kidneys from 397 ADPKD patients) was performed on the images from each pulse sequence (n=475), and all images were reviewed independently by 3 observers for acquisition issue identification (Figure 1) as follows: 1) composing artifacts: extra slices present from combining two overlapping acquisitions; 2) misregistration: kidney boundary discontinuities from different kidney breath holding positions during multiple breath-hold acquisitions; 3) breathing motion artifacts: non-uniform samplings of kidneys as they move up and down during scanning. The effect of acquisition artifacts on TKV estimation was quantified by the percent difference of TKV estimated from images with artifacts relative to the average TKV from artifact-free images in one exam. The agreement of TKV estimations was assessed by percent coefficient of variation (CV) and Bland-Altman plots between MR sequences, and the inter-reader agreement of TKV (3 independent readers) was compared for each MR sequence.Results
95 ADPKD patients were included with a mean age of 47±14 years and mean TKV of 1324[700-2370] mL. Acquisition artifacts were identified in 201 (42%) of 475 images, and 108 acquisition artifacts were causing a significant measurement deviation (> than the 1-year kidney volume growth rate) from the mean volume measurement on artifact-free sequences. Images with significant artifacts overestimated TKV relative to artifact-free images in the same exam by a median [lower quartile - upper quartile] of 3% [0% - 6%] by misregistration, 5% [2% - 8%] by motion artifacts, and 6% [5% -11%] by composing issues) (Figure 2, Table 1). Misregistration was present in axial SSFSE (19/45), axial SSFP (11/45), and coronal SSFSE (10/45). Motion artifacts were predominantly in axial or coronal SSFSE (30/32); and composing issues were uniformly distributed across axial sequences: axial SSFP (10/31), axial SSFSE (10/31), and axial T1(11/31). Coronal SSFP presented the least number of significant acquisition artifacts (3/108). After excluding images with artifacts, the TKV coefficient of variation among the remaining sequences in the same exam dropped from 4.0% to 1.4%. All sequences exhibited high inter-rater agreement (percent CV: 1.3~3.0%). Bias between every two sequences was small, ≤±1.5%, and decreased substantially after correcting or eliminating measurements affected by acquisition issues.Discussion
Although total kidney volume (TKV) measured by MRI is a critical biomarker for ADPKD disease severity, it is commonly measured and reported without rigorous quality control. These data from 95 ADPKD patients show that acquisition artifacts were common, resulting in a 3% to 6% overestimation of TKV compared to the measurements from sequences without artifacts, which is comparable to the annual kidney growth rate. Sequence-wise, despite achieving high inter-reader agreement, axial SSFSE was more susceptible to all three acquisition artifacts, possibly due to a longer scanning time than axial 3D T1 and SSFP acquisitions and more scans than coronal acquisitions. Quality control reduced systemic bias of specific pulse sequences in TKV estimation, especially ameliorating the overestimation of TKV by axial SSFSE and the underestimation by coronal SSFP compared to other pulse sequences. This suggested that the observed sequence-specific bias in TKV estimation can be explained by the sequence-specific vulnerability to acquisition artifacts, and the low inter-sequence variability after quality control supported the use of different pulse sequences in follow-up TKV estimation when quality control is enforced.Conclusions
Total kidney volume estimation in autosomal dominant polycystic kidney disease by MRI is prone to acquisition artifacts that limit accurate volume and annual kidney growth rate estimation. However, using AI to measure kidney volumes on multiple MRI pulse sequences and performing quality control that identifies acquisition artifacts can improve measurement consistency.Acknowledgements
No acknowledgement found.References
- Grantham JJ, Torres VE, Chapman AB, et al. Volume Progression in Polycystic Kidney Disease. New England Journal of Medicine 2006;354(20):2122-2130. Torres VE, Chapman AB, Devuyst O, et al.
- Tolvaptan in Later-Stage Autosomal Dominant Polycystic Kidney Disease. New England Journal of Medicine 2017;377(20):1930-1942.
Figures
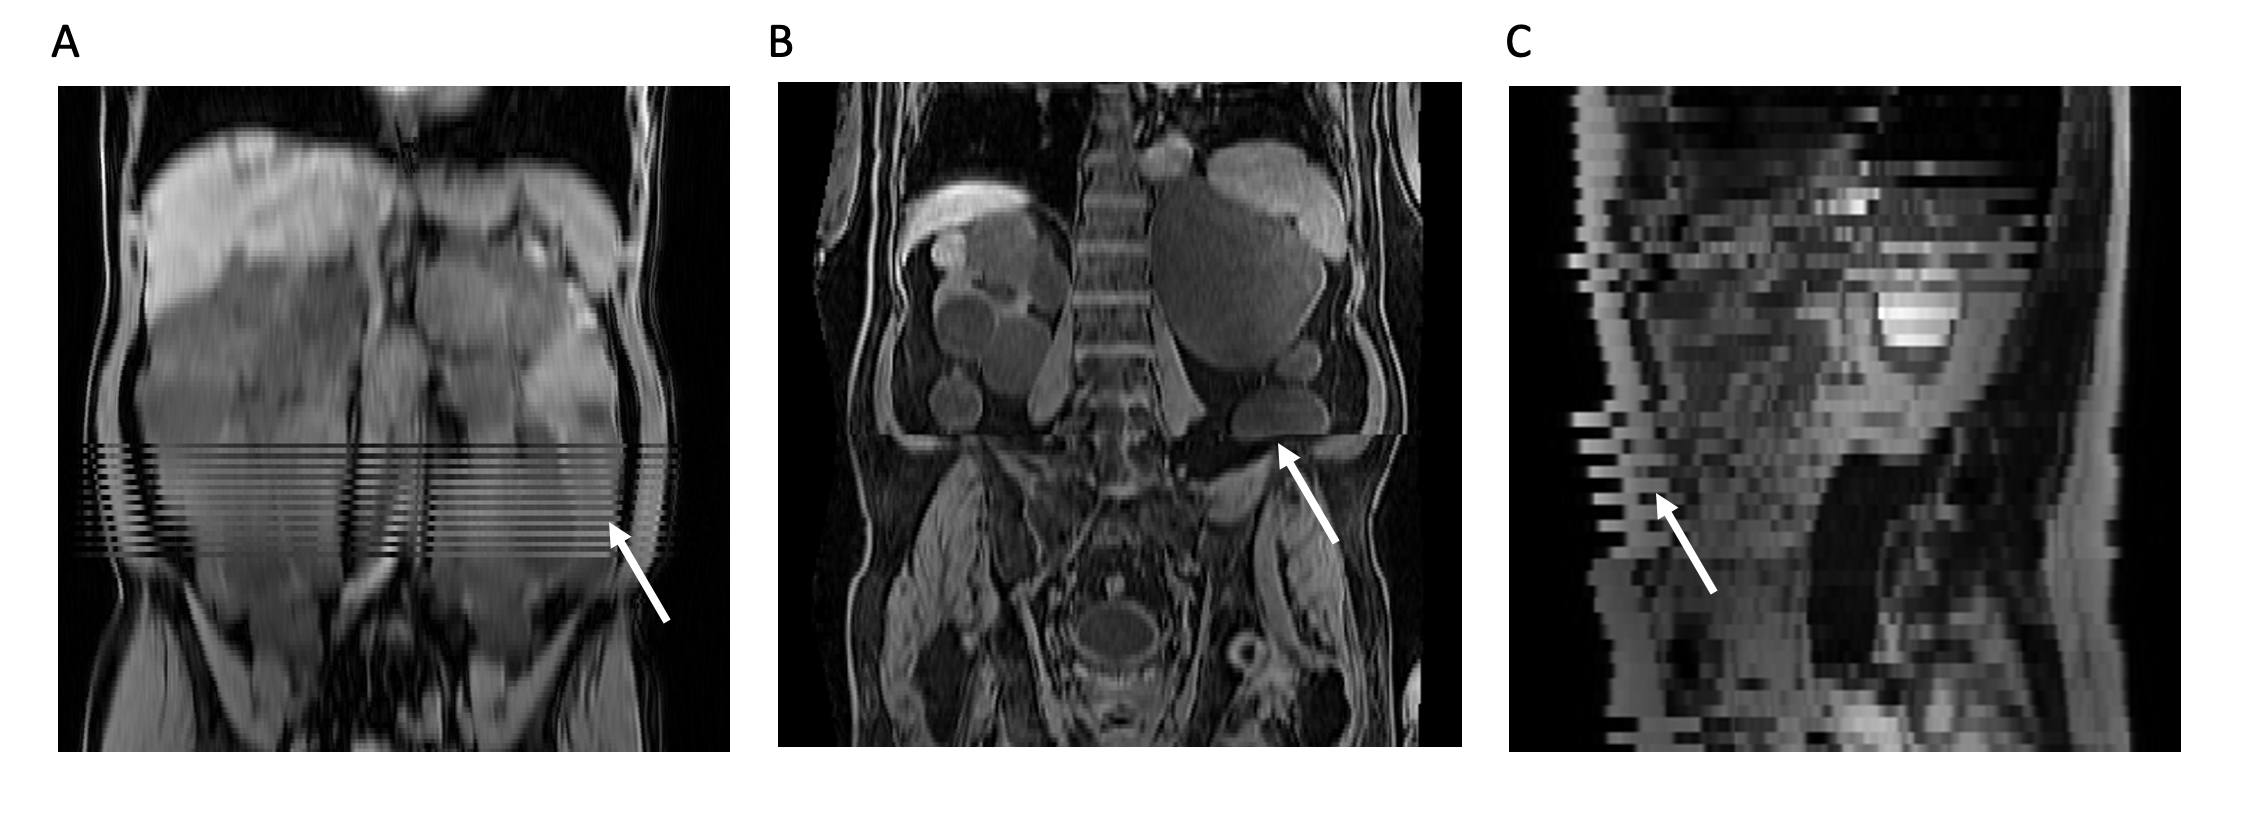
Figure 1. Acquisition artifacts. A) composing artifacts in axial T1 (reconstructed in coronal view); B) misregistration in axial T1 (reconstructed in coronal view); C) breath motion artifacts in axial SSFSE (reconstructed in sagittal view).
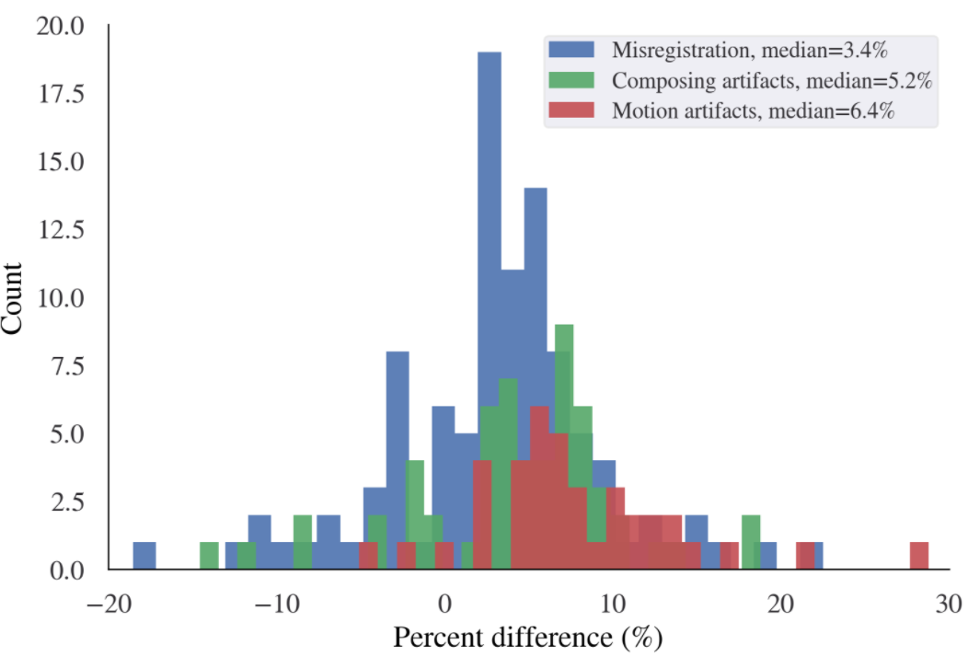
Figure 2. Histogram of the percent TKV difference caused by sequences with acquisition artifacts relative to the artifact-free images in the same exam. Artifacts tend to cause overestimation of TKV with a median of 3.4%, 5.3%, and 6.4% for misregistration, composing artifacts, and motion artifacts, although in individual cases, underestimation may occur, and the range of percent overestimation or underestimation was big, ranging from –20% to 30%.
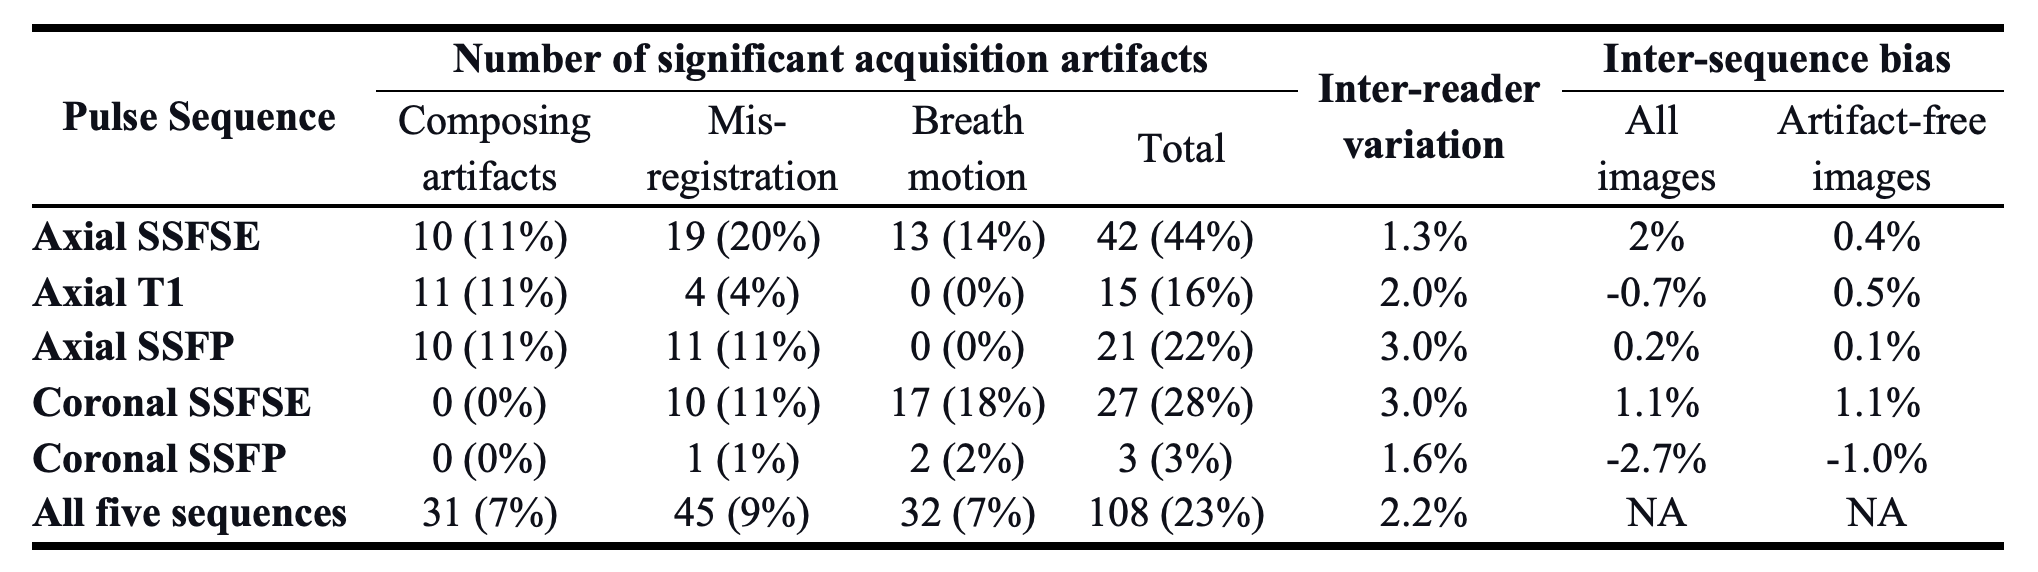
Table 1. The number (frequency) of acquisition artifacts causing a significant measurement deviation (> than the 1-year kidney volume growth rate), inter-reader percent coefficient of variation, and average inter-sequence bias of TKV estimated by each pulse sequence (n=95) and all five sequences in total (n=495).
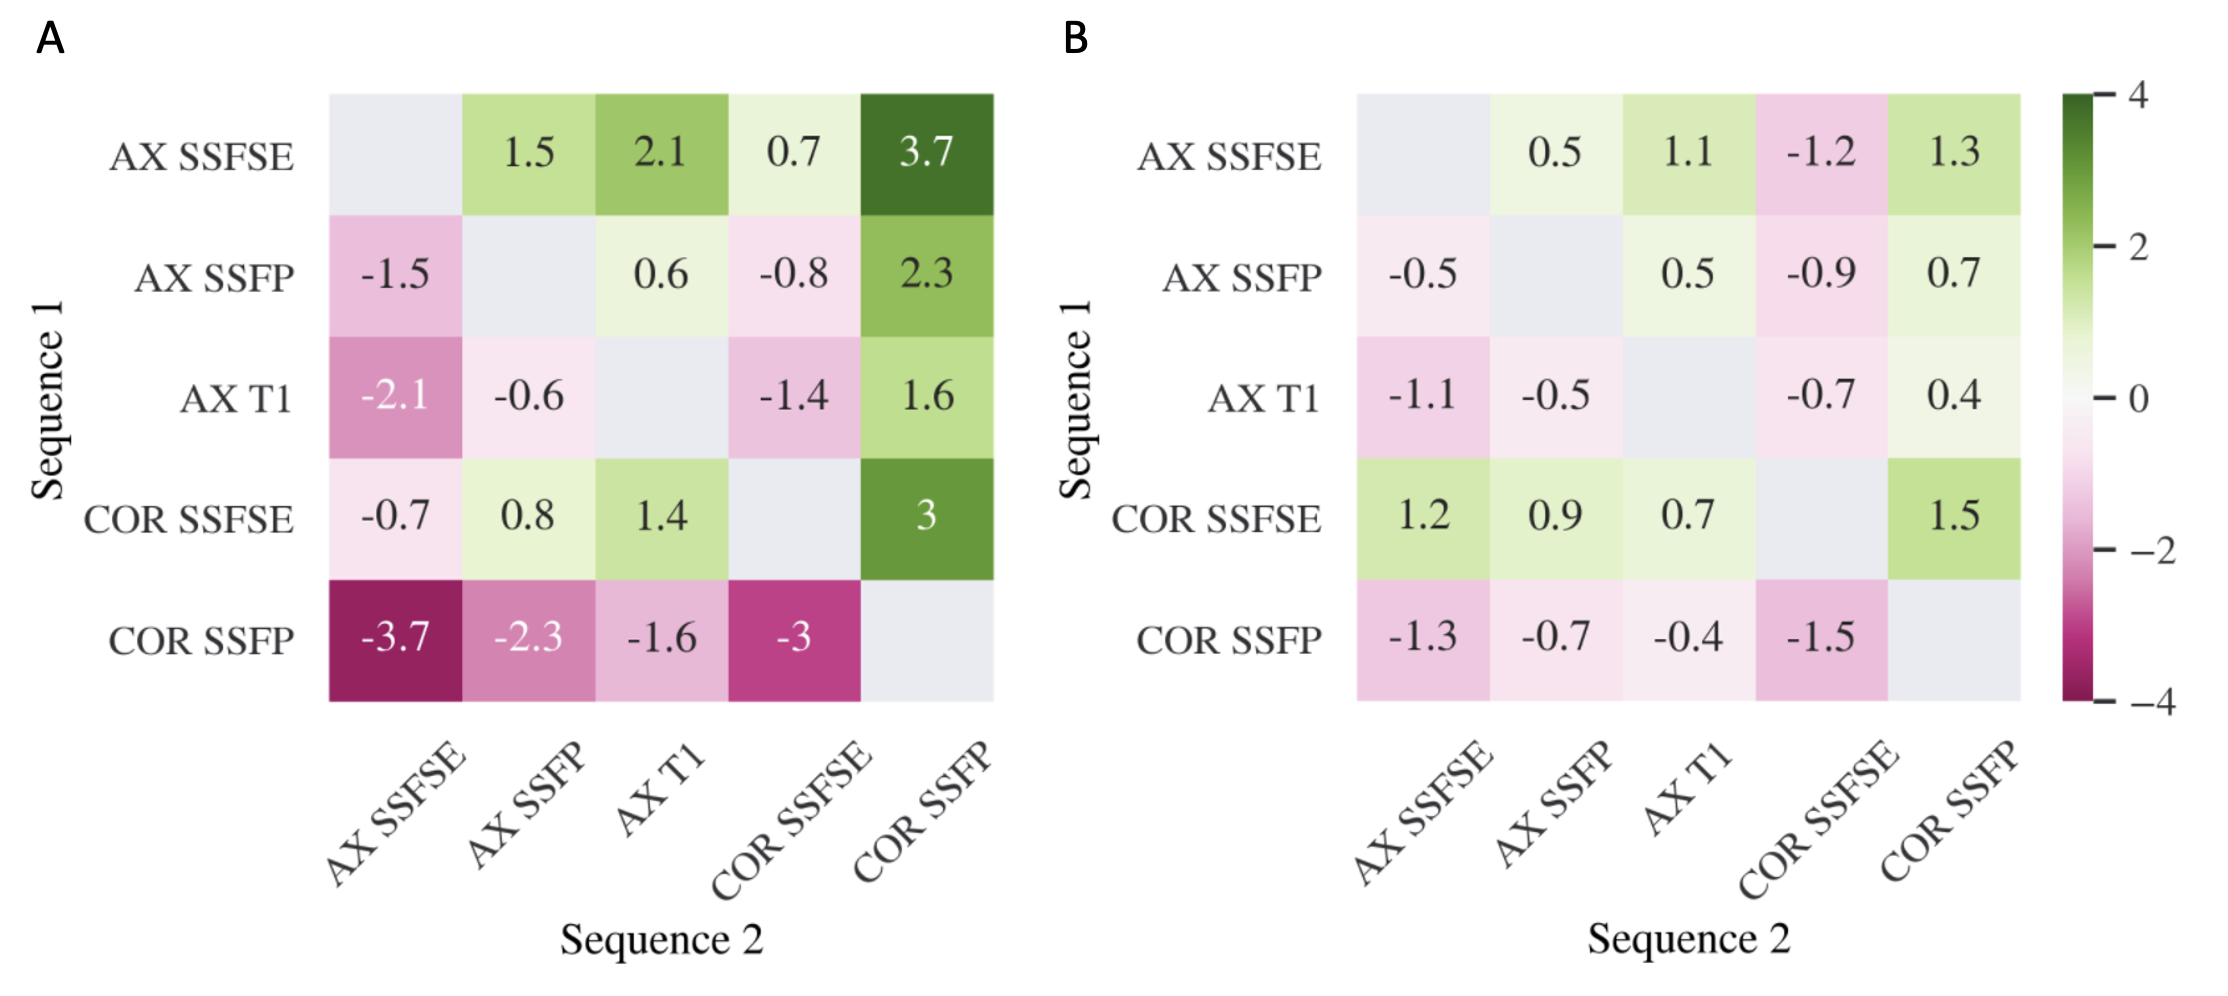
Figure 3. Heatmap of the bias (average percent differences of TKV from sequence 1 compared to sequence 2) between TKV estimated from two sequences. A) All images; B) All Artifacts-free images. Before quality control, axial SSFSE exhibited positive bias, and coronal SSFP exhibited negative bias relative to all other sequences. After excluding images with artifacts, the sequence-to-sequence bias dropped, and coronal SSFSE and SSFP exhibited positive and negative bias relative to all sequences, respectively. AX: axial; COR: coronal
DOI: https://doi.org/10.58530/2023/1284