1283
Three-Dimensional Kidney Shape Analysis: Associations with Anthropometric and Disease Factors
Marjola Thanaj1, Nicolas Basty1, Madeleine Cule2, Elena Sorokin2, Jimmy Bell1, Elizabeth Louise Thomas1, and Brandon Witcher1
1Life Sciences, University of Westminster, London, United Kingdom, 2Calico Life Sciences LLC, South San Francisco, CA, United States
1Life Sciences, University of Westminster, London, United Kingdom, 2Calico Life Sciences LLC, South San Francisco, CA, United States
Synopsis
Keywords: Kidney, Kidney, Mass Univariate Regression Analysis
Organ MRI measurements have the potential to enhance our understanding of the precise phenotypic changes underlying many clinical conditions. Using kidney mesh-based shape analysis we were able to detect variation in specific anatomical regions of the kidney, and associate this with anthropometric traits as well as disease states including chronic kidney disease (CKD), type-2 diabetes (T2D), and hypertension. We show that CKD is associated with smaller kidneys. We also show that T2D and hypertension are associated with larger kidneys.Introduction
Magnetic resonance imaging (MRI) is the benchmark for clinical research in the study of body composition. The incidence of conditions such as chronic kidney disease (CKD), type-2 diabetes (T2D), and hypertension are rising and are a leading cause of death globally¹. Image-derived phenotypes (IDPs) of the kidneys from MRI are gaining traction as a means of representing detailed anatomical information. While these methods enhance our understanding of the kidneys at a population level, they are limited when it comes to providing additional knowledge regarding morphological and regional variation in response to a particular condition. Three-dimensional (3D) mesh-derived phenotypes capture additional information related to morphological and regional organ variation, and may be used to model differences between a healthy and diseased state.Methods
Three-dimensional kidney segmentations derived from Dixon MRI acquisitions were obtained using a previously-validated algorithm². We used 44,416 kidney segmentations from the UK Biobank to create 3D kidney meshes. We constructed templates for both the left and right kidneys across a gender-balanced population of 200 participants using image registration³. We then registered the templates, separately for the left and right kidneys, to the subject’s segmentations via affine and non-rigid registration, and propagated the template-based mesh to each subject mesh using deformation fields obtained from the non-rigid registration⁴. Hence, all surface meshes have the same number of vertices (approximately 4,000 for each kidney) and correspondent vertices across all subjects. We computed the surface-to-surface (S2S) phenotype, the signed distances between the template and subjects-specific meshes, at every vertex for both left and right kidney meshes⁸. We applied a mass univariate regression (MUR) model, threshold-free cluster enhancement, and permutation testing to derive p-values associated with each regression coefficient between the S2S distances and anthropometric variables⁵. We identified participants with mild CKD based on hospital records, self-reported information, and estimated glomerular filtration rate below 60 ml/min/1.73m².⁶ Participants with T2D we identified using ICD10 codes⁷ and participants with hypertension identified from hospital records, self-reported information, self-reported use of hypertensive medication, or mean blood pressure ≥ 140/90 mmHg⁸.We calculated the associations between local shape variations of the kidney with traits including ethnicity, body mass index (BMI), waist-to-hip ratio (WHR), urinary creatinine, sodium, and urea. Alcohol drinking status, smoking, and use of ibuprofen was considered in relation to diseases including CKD, T2D, and hypertension
Results
We identified 1,342 participants with CKD (674F/609M), aged 47 to 81 years, BMI 16.2 to 51 kg/m2; 2,371 participants with T2D, 66% male, aged 66.6 ± 7.3 years, and BMI 29.7 ± 5.3 kg/m2. 16,112 participants had hypertension 58% male, aged 45 to 82 years, and BMI 15.6 to 55.2 kg/m2.We found that lower S2S distances were associated with increasing age at a rate of -0.04 mm/year in the left kidney and -0.03mm/year in the right kidney (Table 1, Table 2 and Figure 1). BMI and WHR were positively associated with S2S distances, covering 85.02% and 54.02% of the left kidney and 87.42% and 64.61% of the right kidney, respectively. Creatinine in urine was mostly statistically significant positive associated with S2S distances (significance area = 45.59% in the left kidney and significance area = 55.99% in the right kidney) whereas urea showed a median inward shape in S2S distances of -0.13 mm in both kidneys. Lifestyle factors including alcohol intake and smoking were positively associated with S2S distances, showing median outward shape variations of 0.37 mm and 0.20 mm in the left kidney and 0.39 mm and 0.22 mm in the right kidney, respectively. Use of Ibuprofen medication showed an overall median outward shape change in S2S distances.
CKD was associated with a median S2S of -1.12 mm (significance area = 89.63%) in the left kidney and -0.96 mm (significance area = 94.08%) in the right kidney. T2D was overall positively associated with S2S distances, with a median of 0.38 mm in the left kidney and a median of 0.46 mm in the right kidney. Finally, hypertension showed a median outward shape change in S2S distances of 0.17 mm covering 67.49% of the left kidney and 0.21 mm covering 79.37% of the right kidney.
Discussion and Conclusion
This study demonstrates the value of morphometric image analysis to enrich MRI-derived IDPs. We present the morphometric variations of both left and right kidney surface mesh and were able to quantify the anatomical relationships with age, body composition, and disease. The presence of CKD was associated with reduced S2S in both kidneys whereas T2D and hypertension were associated with outward shape variations in both kidneys. Our findings highlight the potential clinical and scientific significance of this technique. Future research will help identify genetic and environmental drivers associated with accelerated ageing and disease.Acknowledgements
This research has been conducted using the UK Biobank Resource under Application Number 44584 and was funded by Calico Life Sciences LLC.References
- Global Burden of Disease 2016 Causes of Death Collaborators. Global, regional, and national age-sex specific mortality for 264 causes of death, 1980-2016: a systematic analysis for the global burden of disease study 2016. Lancet 2017, 390;1151-1210.
- Liu Y. et al. Genetic architecture of 11 abdominal organ traits derived from abdominal MRI using deep learning. eLife 2021; 10:e65554.
- Avants BB. et al. The optimal template effect in hippocampus studies of diseased populations. Neuroimage 2010; 49: 2457-2466.
- Duan J. et al. Automatic 3D Bi-Ventricular Segmentation of Cardiac Images by a Shape-Refined Multi-Task Deep Learning Approach. IEEE Trans on Med Im 2019; 38: 2151-2164.
- Thanaj M. et al. Mass Univariate Regression Analysis for Three-Dimensional Liver Image-Derived Phenotypes. MIUA 2021; p 165-176.
- Lin BM. et al. Genetics of Chronic Kidney Disease Stages Across Ancestries: The PAGE Study. Frontiers in Genetics 2019, vol. 10 494.
- Whitcher B. et al. Precision MRI phenotyping enables detection of small changes in body composition for longitudinal cohorts. Scientific Reports 2022; 12:3748.
- Tapela N. et al. Prevalence and determinants of hypertension control among almost 100 000 treated adults in the UK. Open Heart 2021, 8:e001461.
Figures
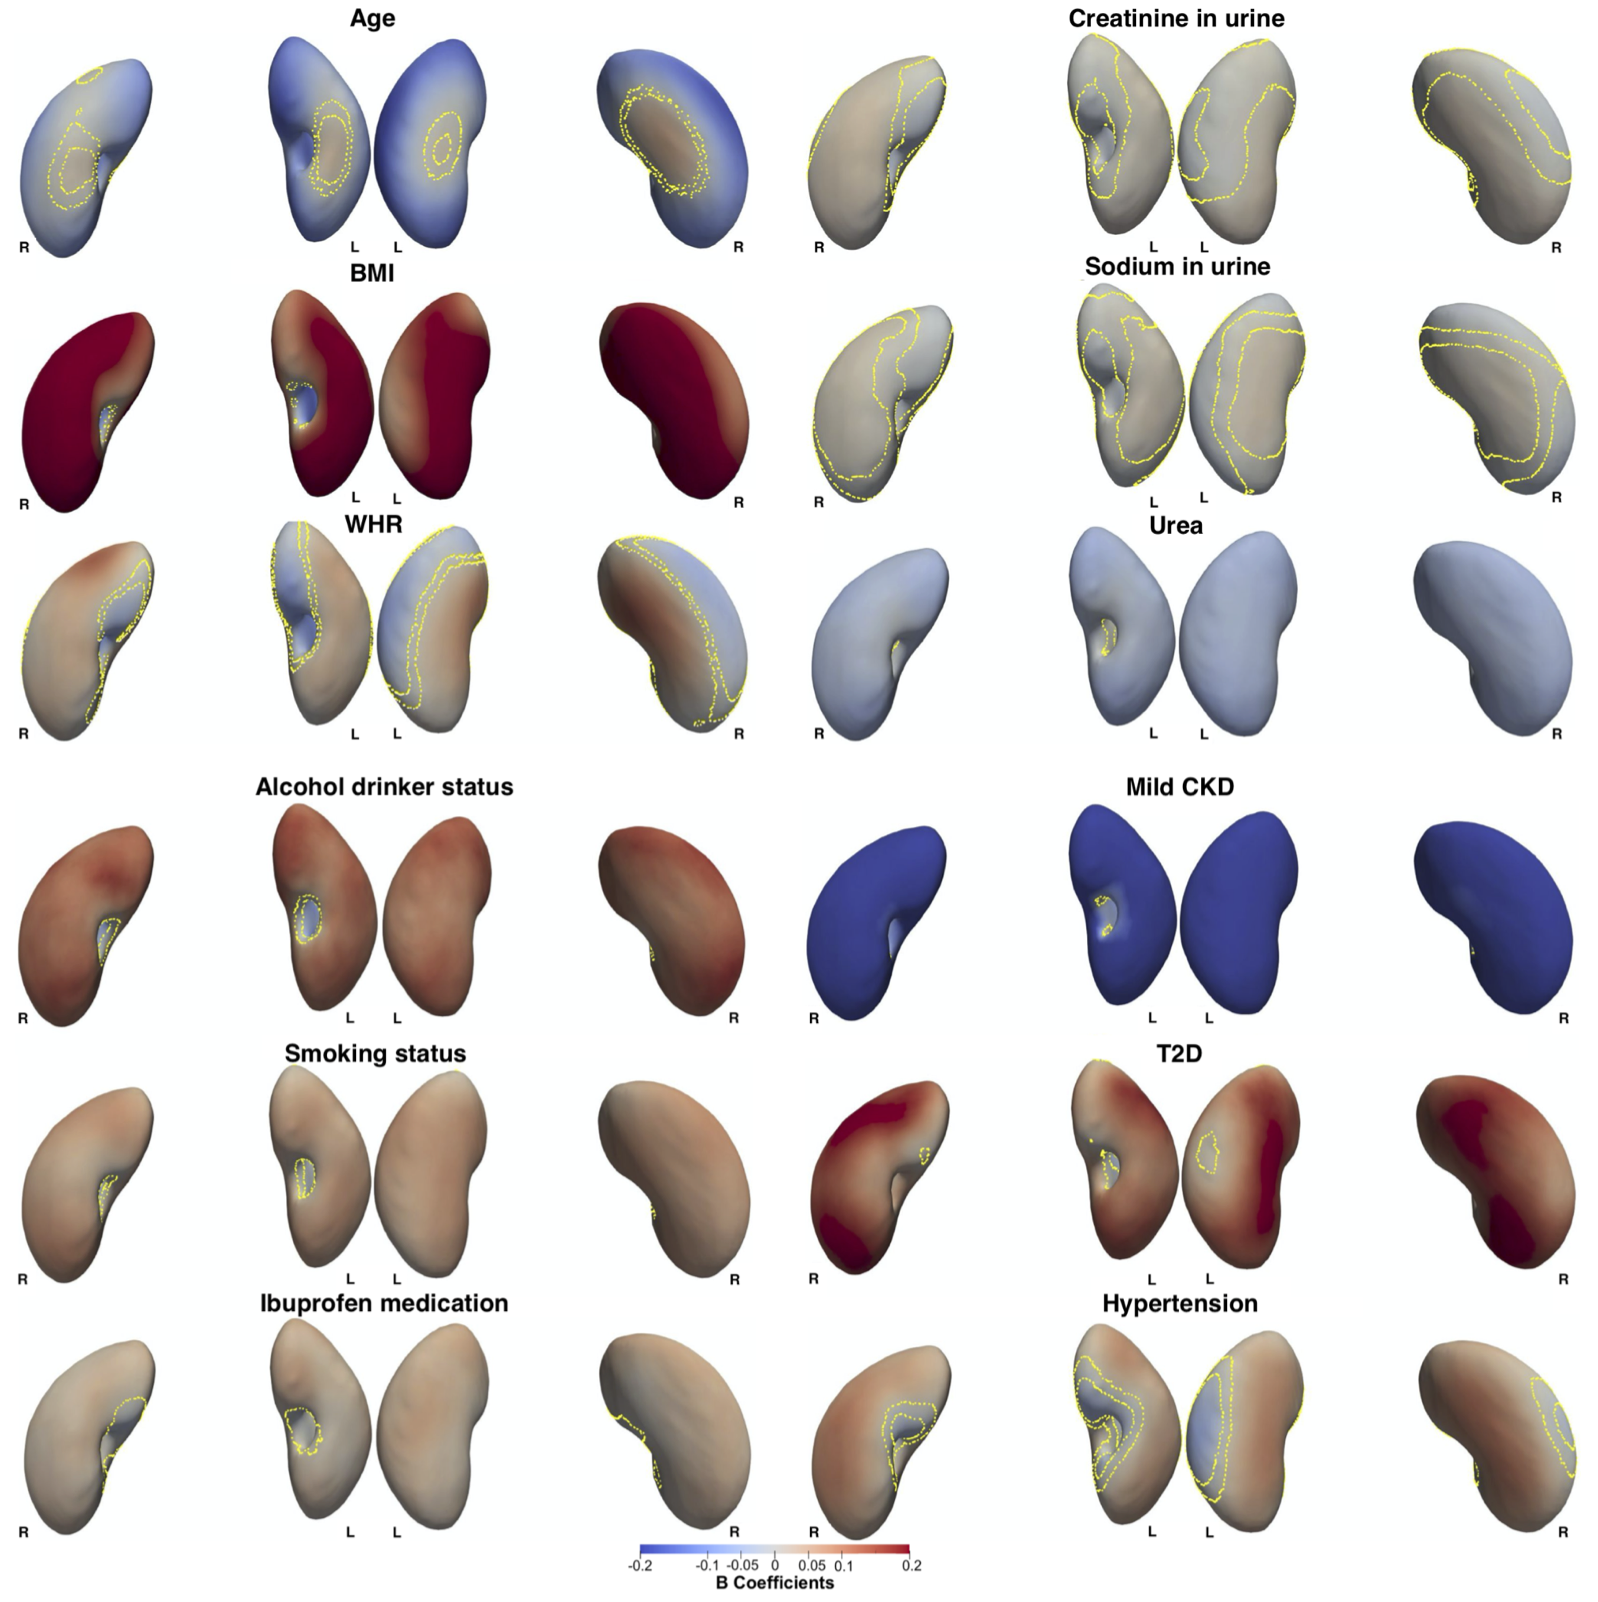
Figure 1. Three-dimensional statistical parametric maps (SPMs) of kidney morphology, projections are anterior and posterior views for both left (L) and right (R) kidneys in both anterior (left) and posterior (right) views. The SPMs show the local strength of association for each covariate in the model with S2S distances on the full cohort (N=44,416). Yellow contour lines indicate the boundary between statistically significant regions (p<0.05) after correction for multiple testing, with positive associations in bright red and negative associations in bright blue.
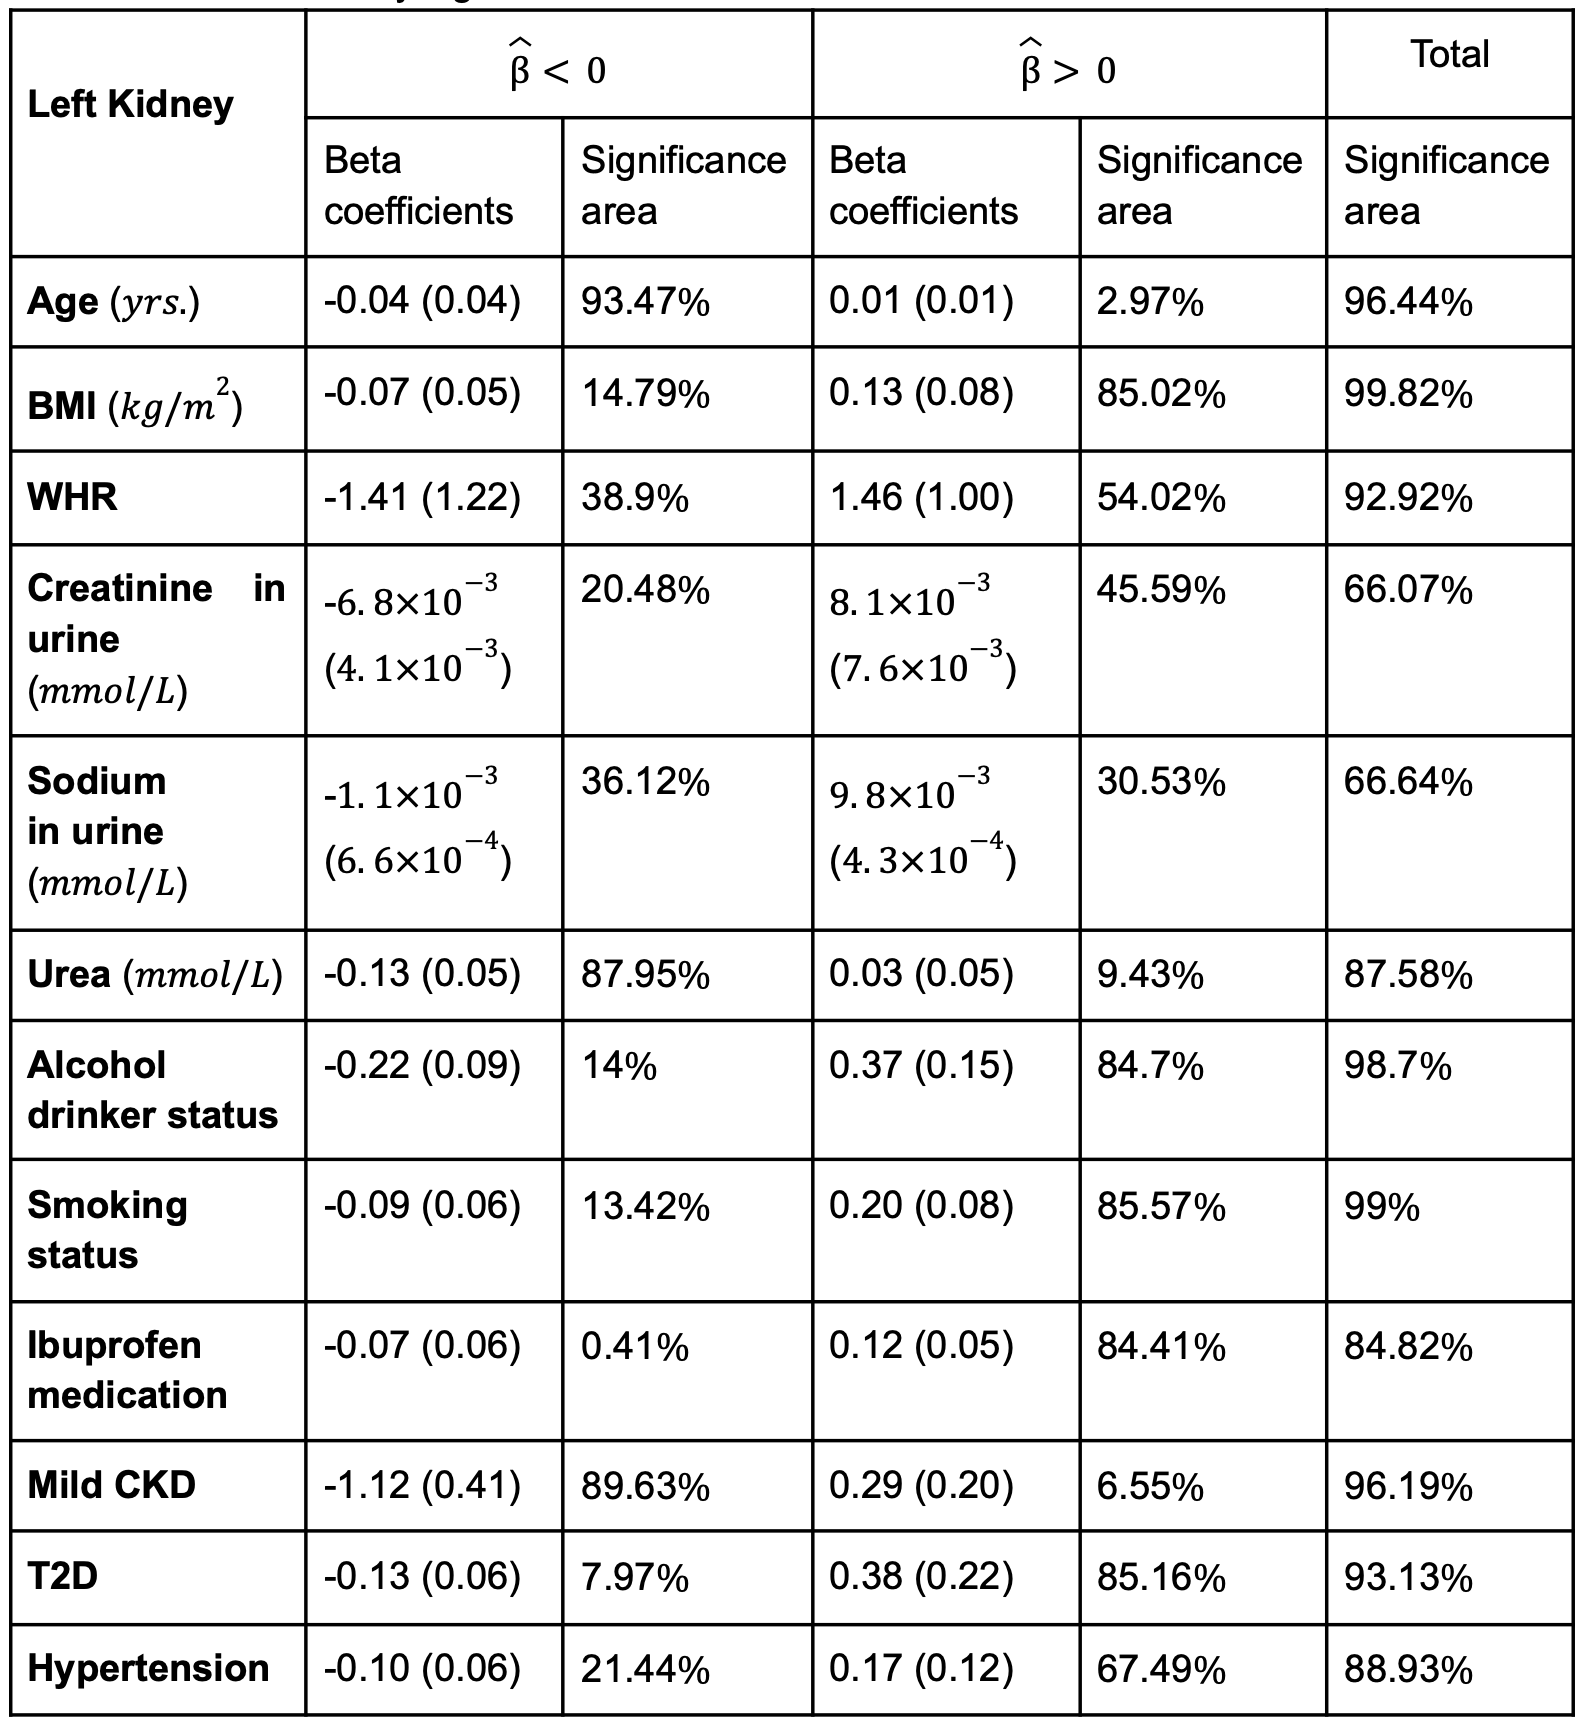
Table 1. Significance areas for covariates in the MUR model between the anthropometric covariates (N=44,416) in the model for the left kidney. The total area has been split into areas of positive and negative associations. The regression coefficients are presented as median (interquartile range - IQR) and the significance areas as a percentage (%) of the vertices with statistically significant associations.
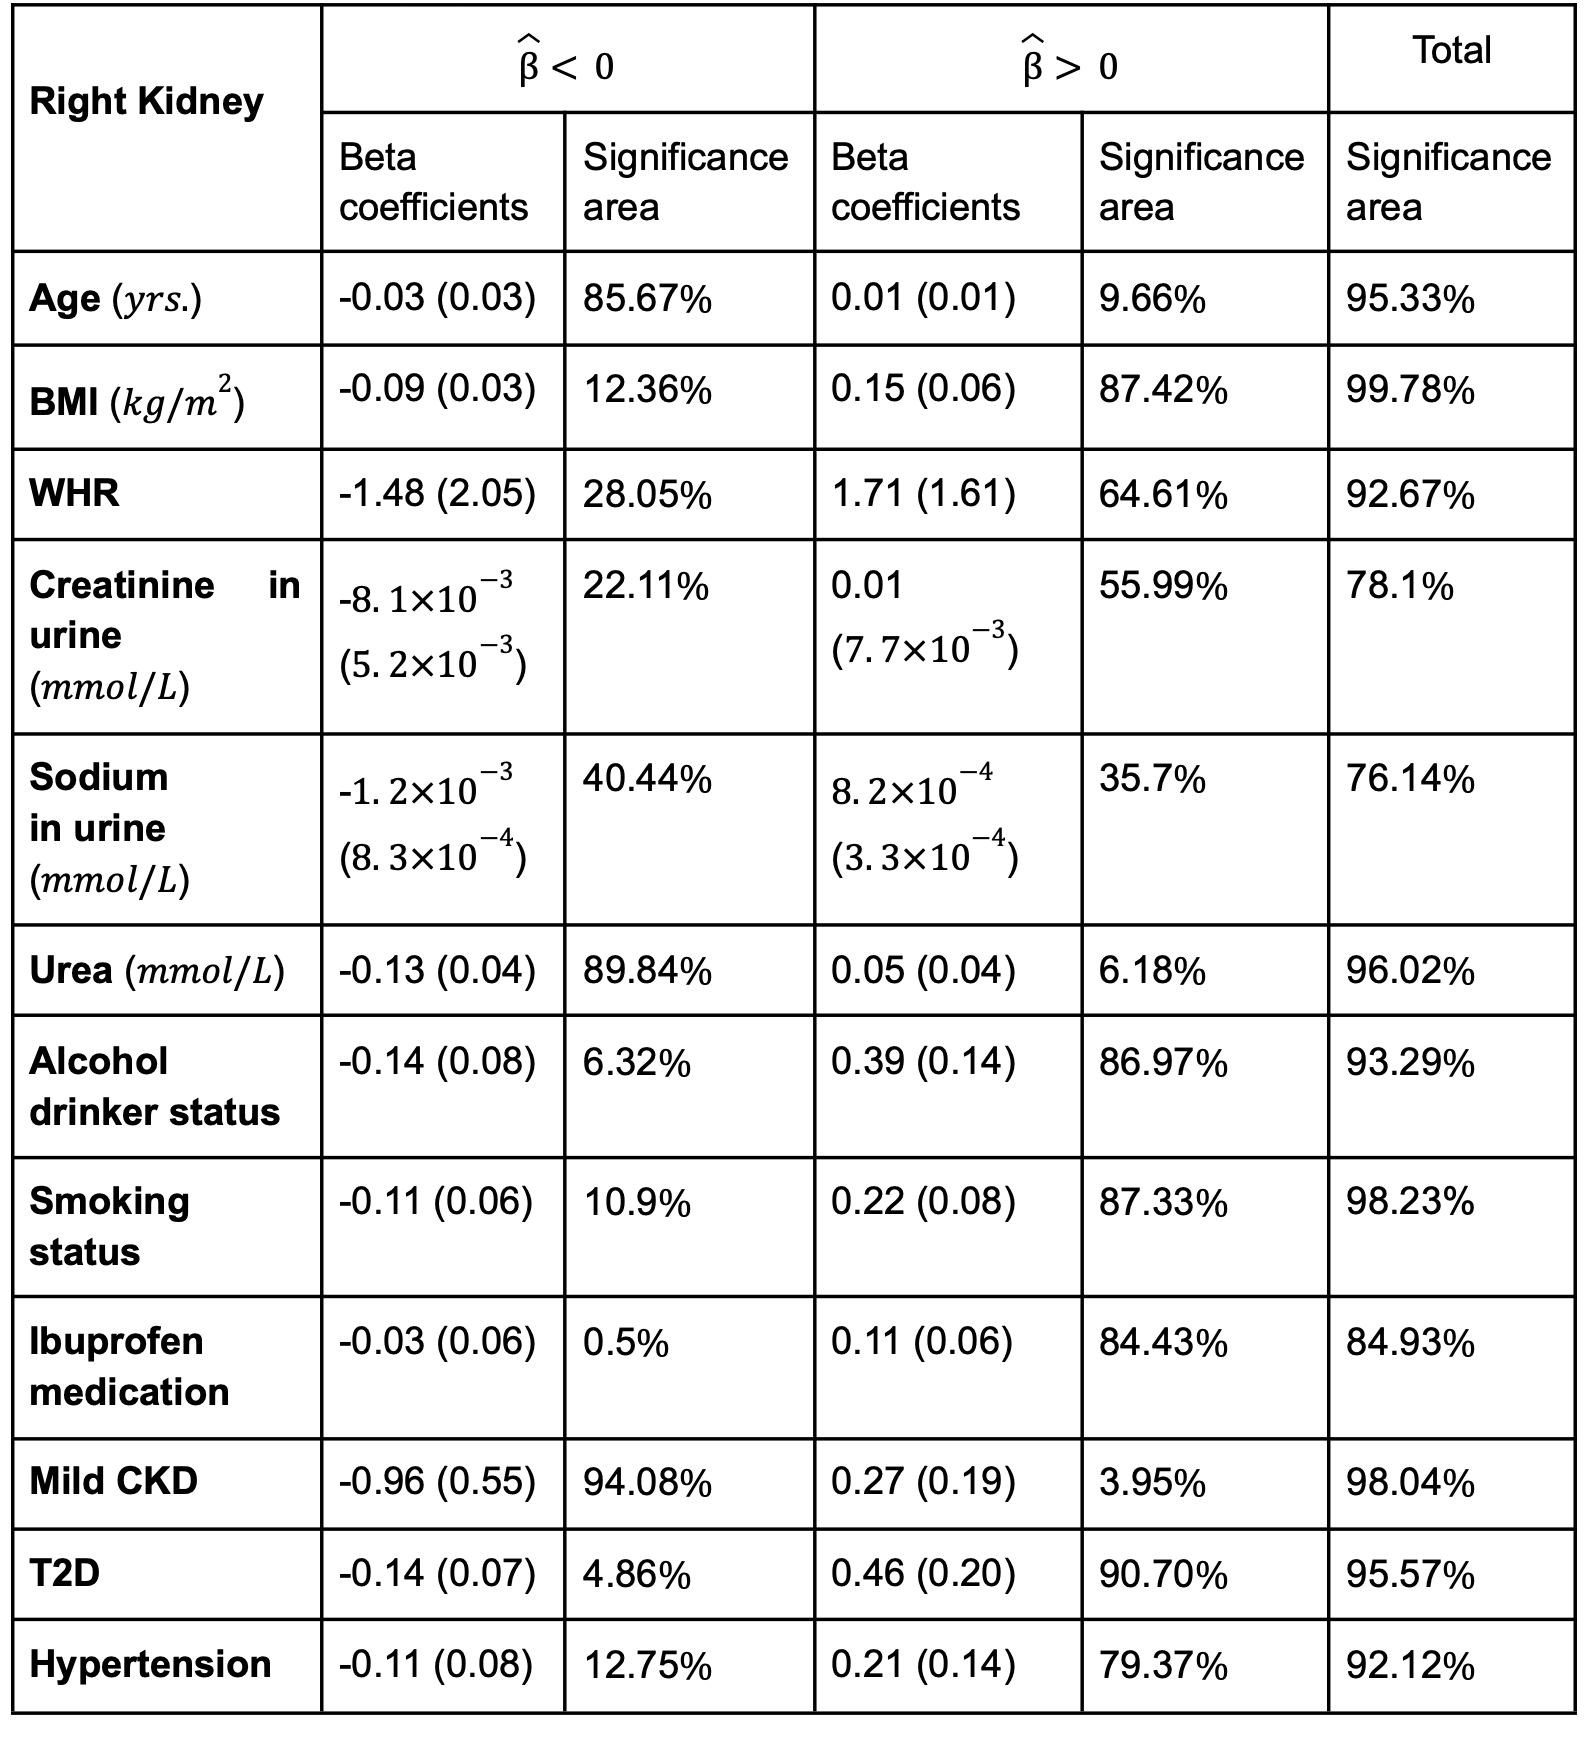
Table 2. Significance areas for covariates in the MUR model between the anthropometric covariates (N=44,416) in the model for the right kidney. The total area has been split into areas of positive and negative associations. The regression coefficients are presented as median (interquartile range - IQR) and the significance areas as a percentage (%) of the vertices with statistically significant associations.
DOI: https://doi.org/10.58530/2023/1283