1282
A complete cerebellar mean-field model ready to be integrated into whole-brain dynamic simulators1Department of Brain and Behavioral Sciences, Università di Pavia, Pavia, Italy, 2Institut du Cerveau - Paris Brain Institute, ICM, Inserm, CNRS, APHP, Hôpital de la Pitié Salpêtrière, Paris, France, 3CNRS, Paris-Saclay University, Saclay, France, 4Department of Neuroinflammation, UCL Queen Square Institute of Neurology, NMR Research Unit, Queen Square Multiple Sclerosis Centre, London, United Kingdom, 5Brain Connectivity Center, IRCCS Mondino Foundation, Pavia, Italy
Synopsis
Keywords: In Silico, New Devices, Mean field
Whole-brain dynamics can be reproduced in silico by simulating Blood Oxygen Level Dependent (BOLD) signals, typically recorded with fMRI, using cortical and subcortical mean-field models, which provide a population-level description of the underlying neuronal dynamics. Notably, a mean-field model specific for the cerebellum is missing given its structural and functional specific properties. We present the first biologically-grounded cerebellar mean-field model optimized on experimental data. Our model reproduces cerebellar activity and synaptic mechanisms characterizing physiological and pathological conditions. The cerebellar mean-field model is a new device ready to be integrated in whole-brain dynamic simulator, improving understanding of brain function and dysfunction.Introduction
Brain modeling is opening new frontiers for experimental and clinical research toward personalized medicine1,2. Mean-field models (MFs) approximate complex neuronal system dynamics replacing its inter-neuron interactions with the interaction of one overall neuron with the mean-field generated by others, linking the microscale effects (i.e., between-neuron interactions) to the macroscale activity (i.e., Blood Oxygen Level Dependent (BOLD) signals) recorded with functional Magnetic Resonance Imaging (fMRI)3–6. MFs for cortical and subcortical structures have been developed and integrated in simulators such as The Virtual Brain (TVB)7 and Dynamic Causal Modeling (DCM)8,9 to investigate both resting state and task-based dynamics2,10.Within this context a cerebellar MF model is still missing. Notably, the cerebellum has a specific microcircuit structure including Granule Cells (GrC), Golgi Cells (GoC), Molecular Layer Interneurons (MLI), and Purkinje Cells (PC)11. Over the years, the view of the cerebellum as a motor co-processor has been superseded by the evidence of its involvement in cognition and emotional processing, deeply influencing whole-brain dynamics that support function12. Considering together the structural specificity and the multifaceted function of the cerebellum, a specific MF model is essential to improve BOLD simulations.
Here we present the first complete model of the cerebellum, based on its realistic structural and functional specific features. The cerebellar MF was optimized with experimental recordings and tested against validated cerebellar point-neuron networks to assess its functional and predictive validity. The next step is the integration of this MF into brain simulators and its connection with other cortical MFs towards the overarching aim of a personalized brain representation and ultimately personalized medicine.
Methods
The cerebellar MF construction pipeline is reported in Figure1. The cerebellar MF model was developed accounting for the cerebellar microcircuit topological properties, using validated spiking neuron models13(Figure2). The cerebellar MF relies on the Transfer Function (F) formalism that transfers neuronal biological parameters, estimated experimentally, into MF equations14. For each cerebellar neuronal population, a specific F was computed (e.g. FPC, FMLI, FGrC, FGoC) incorporating connection probabilities, synaptic decay times and quantal conductances (K, τ, Q) extracted from validated point-neuron networks, and providing as output the average population activity13,15. The procedure yielded a numerical table containing the firing-frequency of the neuronal population (numerical F). The analytical form of F was then obtained by a fitting procedure based on the numerical F (Figure3).The MF time constant (T), regulating the global dynamics of the system, was optimized with Local Field Potential signals (LFPs) recorded with high-density microelectrode arrays in the granular layer (GrCs and GoCs) of mice cerebellar slices16(Figure4). For the optimal T value , the MF granular layer activity was compared with LFP amplitudes, by calculating the MF-LFP mean absolute error (MAE).
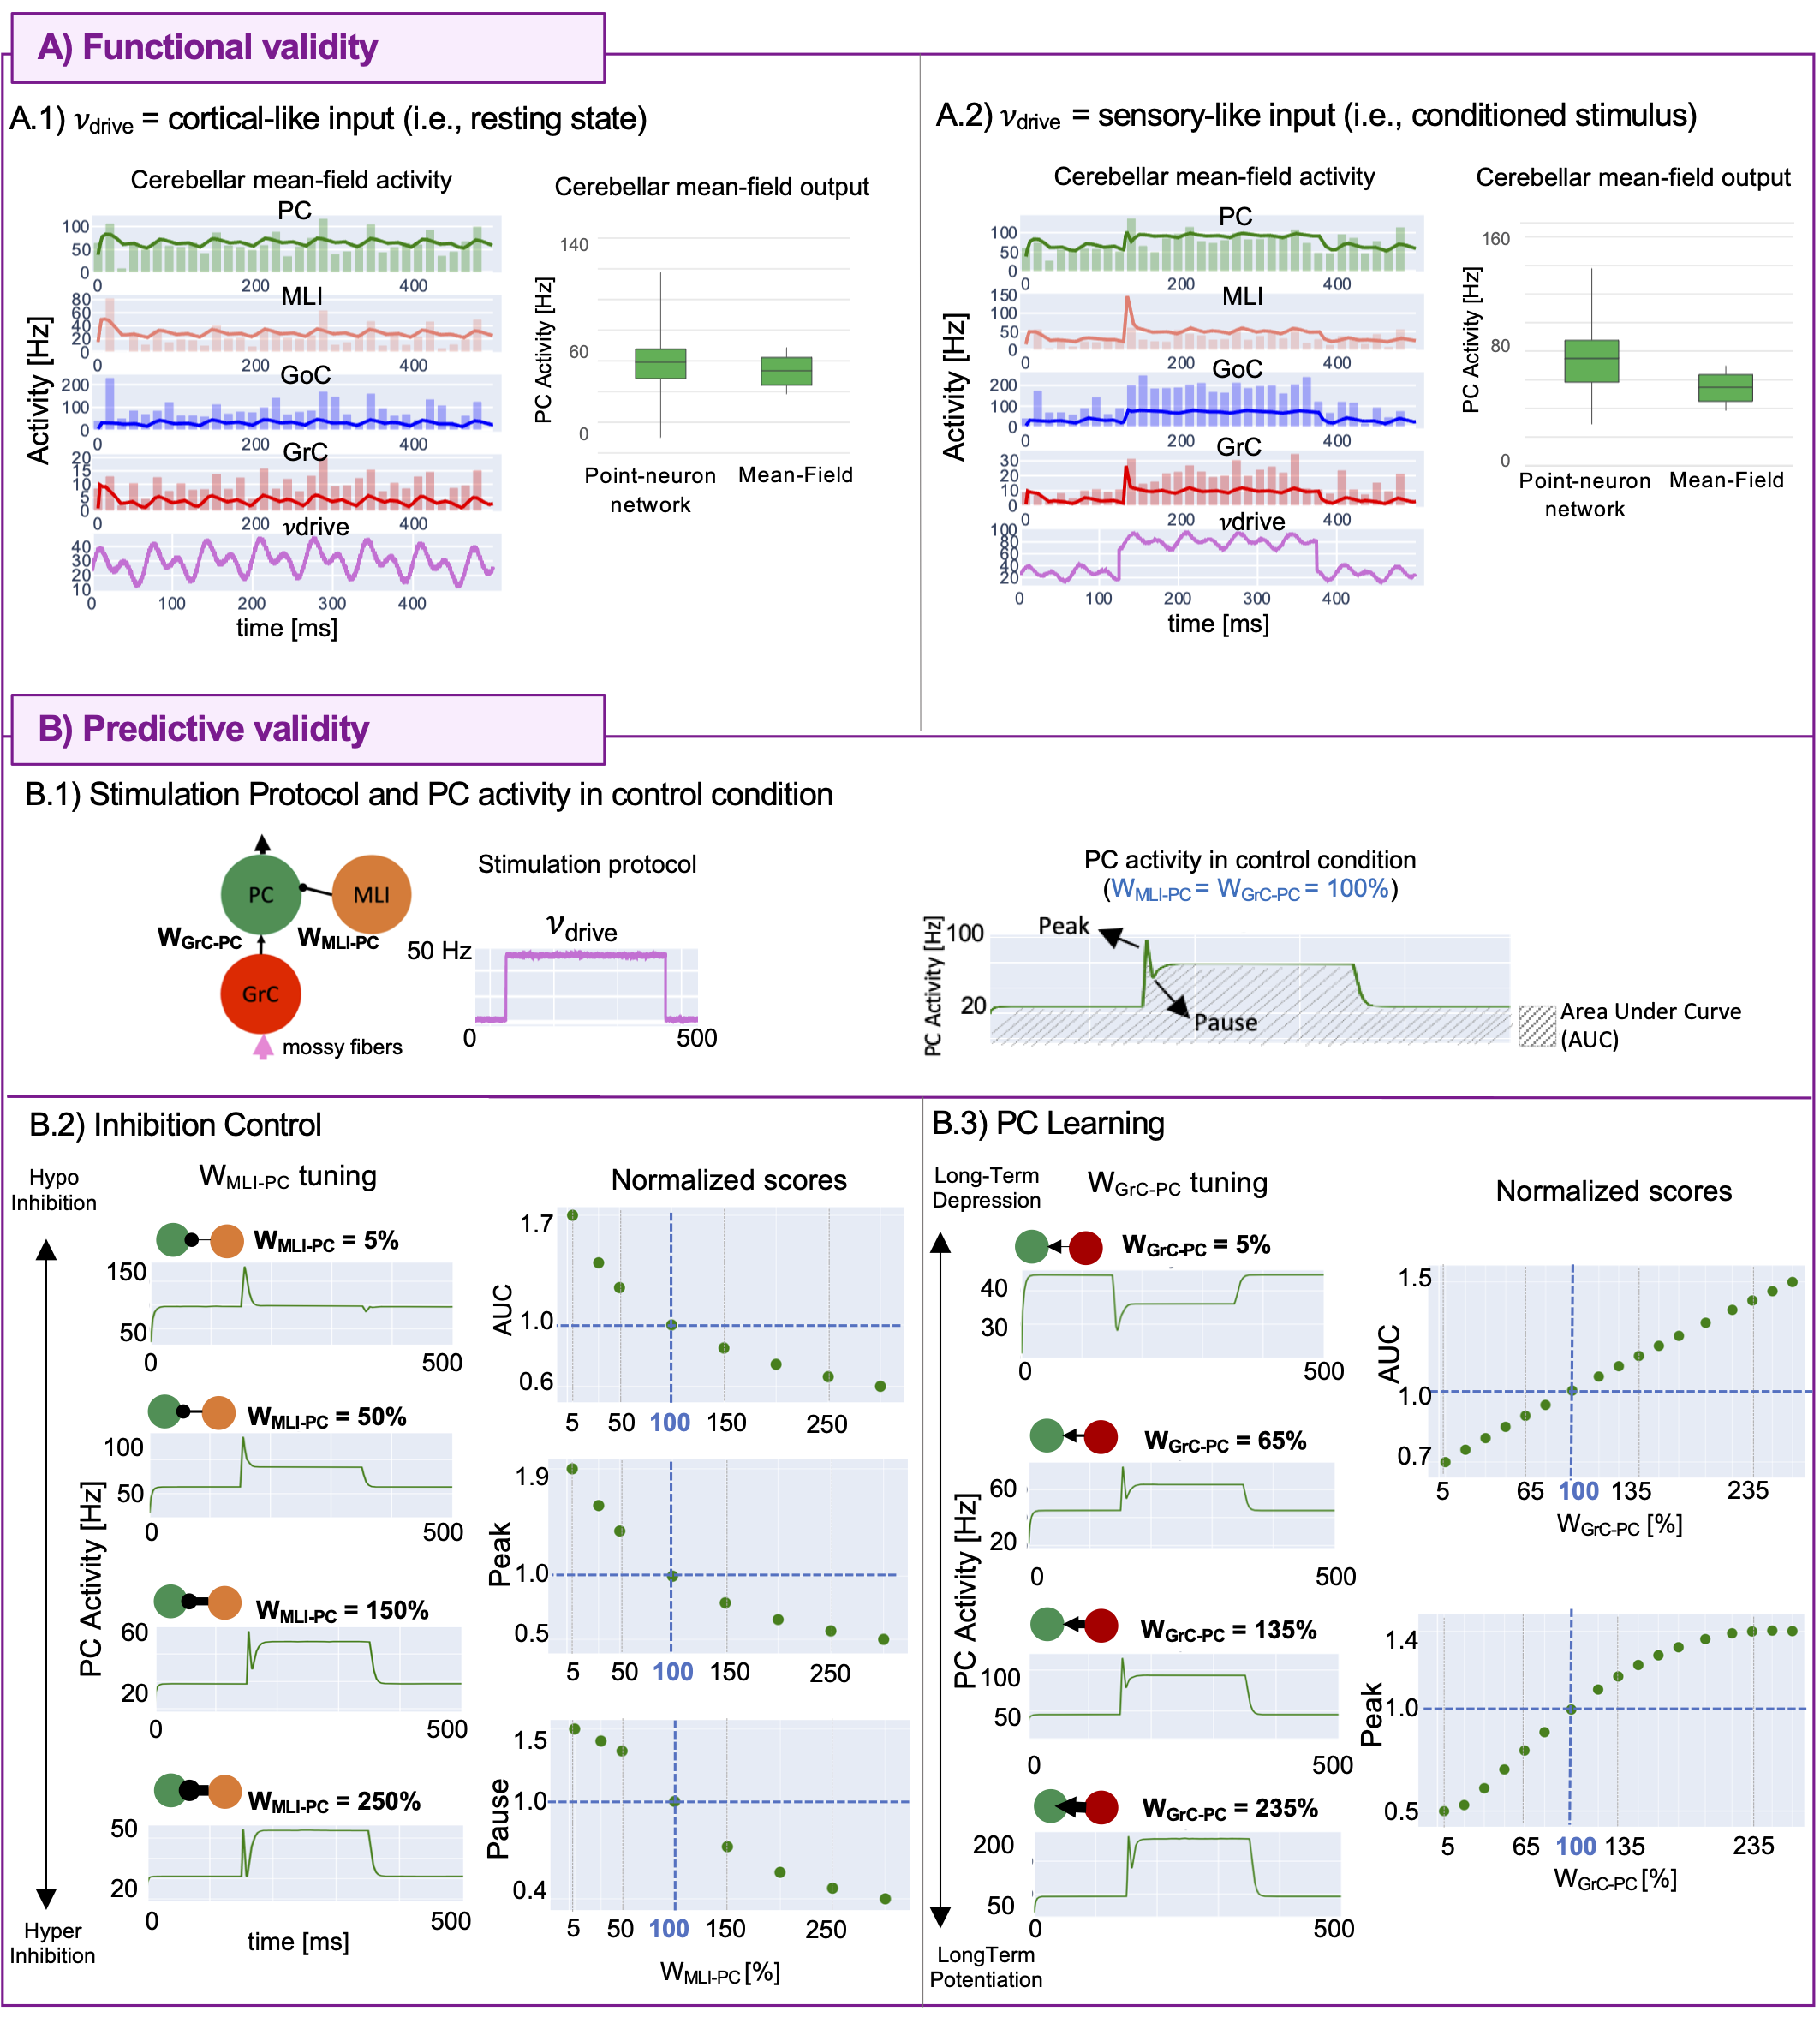
The MF was validated against point-neuron networks, simulating the activity responses to complex stimulation protocols emulating composite inputs from sensory systems and cerebral cortex: a multiband sinusoid (1Hz,15Hz,30Hz) reproducing realistic basal activity17,18 (i.e.,resting state) and a step function reproducing a conditioned stimulus (e.g.,a light in eye-blinking classical conditioning task19).
To investigate MF predictive capability, inhibition control and PC learning were explored by tuning the FPC inputs (MLI-PC and GrC-PC, respectively)19,20. This allows monitoring the modulation of PC specific patterns like burst-and-pause and the impact of different levels of Long-Term Depression/Potentiation at the synapses between GrCs and PCs. Area Under Curve (AUC) and Peak were reported. Additionally, PC pause depth was computed for MLI-PC case.
Results
The optimal T was 3.5ms (MAE=3%). MF activities resulted comparable with validated point-neuron network dynamics, accurately capturing the complex behaviors of all populations (Figure5A). Simulations exploring GrC-PC plasticity showed a linear trend of AUC and a sigmoidal trend of peak with increasing synaptic strength. Simulations exploring the inhibition control on PC activity resulted in AUC and peak exponential decay with increasing MLI-PC synaptic strength and a pause depth sigmoidal trend (Figure5B).Discussion
The first complete cerebellar MF was developed with high fidelity to the real biological network, with optimal T reflecting the speed of cerebellar dynamics compared to the cortical activity21. The MF equations reproduced cerebellar oscillations and signal propagation matching the point-neuron network simulations in response to cortical or sensory-like inputs, assessing its functional accuracy. Considering the specificity of signal processing in different brain regions, once integrated in simulators as TVB or DCM, the cerebellar MF could significantly impact on BOLD simulations, compared to classical approaches that adopt a generic MF equal for all brain regions.The cerebellum is well known for the ability to change its network functioning because of synaptic plasticity in both physiological and pathological conditions such as dystonia22. By tuning FPC parameters, FPC predicted how cerebellar complex synaptic mechanisms impact on the activity underlying motor control and learning processes. The procedure of parameters tuning might pave the way for further manipulation to remap physiological and/or pathological features onto the MF. Future works will identify and extract biophysical meaningful features from subject-specific data, like diffusion weighted imaging or spectroscopy, to tailor the MF to subject-specific characteristics and to combine functional simulations with (micro)structural information.
Conclusion
The cerebellar MF represents the first step toward a new generation of models capable of bearing biological properties into virtual brains that will allow simulating healthy and pathological brains toward personalized medicine.Acknowledgements
This research has received funding from the European Union’s Horizon 2020 Framework Program for Research and Innovation under the Specific Grant Agreement No. 945539 (Human Brain Project SGA3) to ED, CGWK, FP and AD, and under the Marie Sklodowska-Curie grant agreement No. 892175 to YZ. CGWK received funding from BRC (#BRC704/CAP/CGW), MRC (#MR/S026088/1), Ataxia UK, MS Society (#77), Wings for Life (#169111). CGWK is a shareholder in Queen Square Analytics Ltd.This research has also received funding from Centro Fermi project “Local Neuronal Microcircuits” to ED. Special acknowledgement to EBRAINS and FENIX for informatic support and infrastructure.
References
[1] Amunts K, Lepage C, Borgeat L, et al. BigBrain: An ultrahigh-resolution 3D human brain model. Science (80-.) 2013;340(6139):1472–1475. 10.1126/science.1235381
[2] Schirner M, Rothmeier S, Jirsa VK, et al. An automated pipeline for constructing personalized virtual brains from multimodal neuroimaging data. Neuroimage 2015; 117:343–357. https://doi.org/10.1016/j.neuroimage.2015.03.055
[3] El Boustani S, Destexhe A. A master equation formalism for macroscopic modeling of asynchronous irregular activity states. Neural Comput. 2009;21(1):46–100. 10.1162/neco.2009.02-08-710
[4] Moran R, Pinotsis DA, Friston K. Neural masses and fields in dynamic causal modelling. Front. Comput. Neurosci. 2013;7(APR 2013):1–12. https://doi.org/10.3389/fncom.2013.0005
[5] Goldman JS, Tort-Colet N, di Volo M, et al. Bridging Single Neuron Dynamics to Global Brain States. Front. Syst. Neurosci. 2019;13(December):1–9. https://doi.org/10.3389/fnsys.2019.00075
[6] Parr T, Sajid N, Friston KJ. Modules or mean-fields? Entropy 2020;22(5):1–25. https://doi.org/10.3390/e22050552
[7] Sanz Leon P, Knock SA, Woodman MM, et al. The virtual brain: A simulator of primate brain network dynamics. Front. Neuroinform. 2013;7(MAY). https://doi.org/10.3389/fninf.2013.00010
[8] Friston KJ, Harrison L, Penny W. Dynamic causal modelling. Neuroimage 2003;19(4):1273–1302. https://doi.org/10.1016/S1053-8119(03)00202-7
[9] Friston KJ, Preller KH, Mathys C, et al. Dynamic causal modelling revisited. Neuroimage 2019;199(February 2017):730–744. https://doi.org/10.1016/j.neuroimage.2017.02.045
[10] van Wijk BCM, Cagnan H, Litvak V, et al. Generic dynamic causal modelling: An illustrative application to Parkinson’s disease. Neuroimage 2018;181(January):818–830. https://doi.org/10.1016/j.neuroimage.2018.08.039
[11] D’Angelo E. Physiology of the cerebellum. 1st ed. Elsevier B.V.; 2018. https://doi.org/10.1016/B978-0-444-63956-1.00006-0
[12] Palesi F, Lorenzi RM, Casellato C, et al. The Importance of Cerebellar Connectivity on Simulated Brain Dynamics. Front. Cell. Neurosci. 2020;14(July):1–11. https://doi.org/10.3389/fncel.2020.00240
[13] Geminiani A, Casellato C, D’Angelo E, Pedrocchi A. Complex Electroresponsive Dynamics in Olivocerebellar Neurons Represented With Extended-Generalized Leaky Integrate and Fire Models. Front. Comput. Neurosci. 2019;13(June):1–12. https://doi.org/10.3389/fncom.2019.0003
[14] Zerlaut Y, Chemla S, Chavane F, Destexhe A. Modeling mesoscopic cortical dynamics using a mean-field model of conductance-based networks of adaptive exponential integrate-and-fire neurons. J. Comput. Neurosci. 2018;44(1):45–61. 10.1007/s10827-017-0668-2
[15] De Schepper R, Geminiani A, Masoli S, et al. Scaffold modelling captures the structure-function-dynamics relationship in brain microcircuits. bioRxiv 2021;(August):2021.07.30.454314. https://doi.org/10.1101/2021.07.30.454314
[16] Mapelli, J., and D’Angelo, E. (2007). The spatial organization of long-term synaptic plasticity at the input stage of cerebellum. J. Neurosci. 27, 1285–1296. doi:10.1523/JNEUROSCI.4873-06.2007.
[17] Del Percio C, Drinkenburg W, Lopez S, et al. On-going electroencephalographic rhythms related to cortical arousal in wild-type mice: the effect of aging. Neurobiol. Aging 2017;49:20–30. https://doi.org/10.1016/j.neurobiolaging.2016.09.004
[18] Tzvi E, Gajiyeva L, Bindel L, et al. Coherent theta oscillations in the cerebellum and supplementary motor area mediate visuomotor adaptation. Neuroimage 2022;251(February):118985. https://doi.org/10.1016/j.neuroimage.2022.118985
[19] ten Brinke MM, Boele HJ, Spanke JK, et al. Evolving Models of Pavlovian Conditioning: Cerebellar Cortical Dynamics in Awake Behaving Mice. Cell Rep. 2015;13(9):1977–1988. http://dx.doi.org/10.1016/j.celrep.2015.10.057
[20] Wulff P, Schonewille M, Renzi M, et al. Synaptic inhibition of Purkinje cells mediates consolidation of vestibulo-cerebellar motor learning. Nat. Neurosci. 2009;12(8):1042–1049. 10.1038/nn.2348
[21] D’Angelo E. Neural circuits of the cerebellum: hypothesis for function. J. Integr. Neurosci. 2011;10(3):317–352. 10.1142/S0219635211002762
[22] Geminiani A, Mockevičius A, D’Angelo E, Casellato C. Cerebellum Involvement in Dystonia During Associative Motor Learning: Insights From a Data-Driven Spiking Network Model. Front. Syst. Neurosci. 2022;16(June):1–15. https://doi.org/10.3389/fnsys.2022.91976
Figures
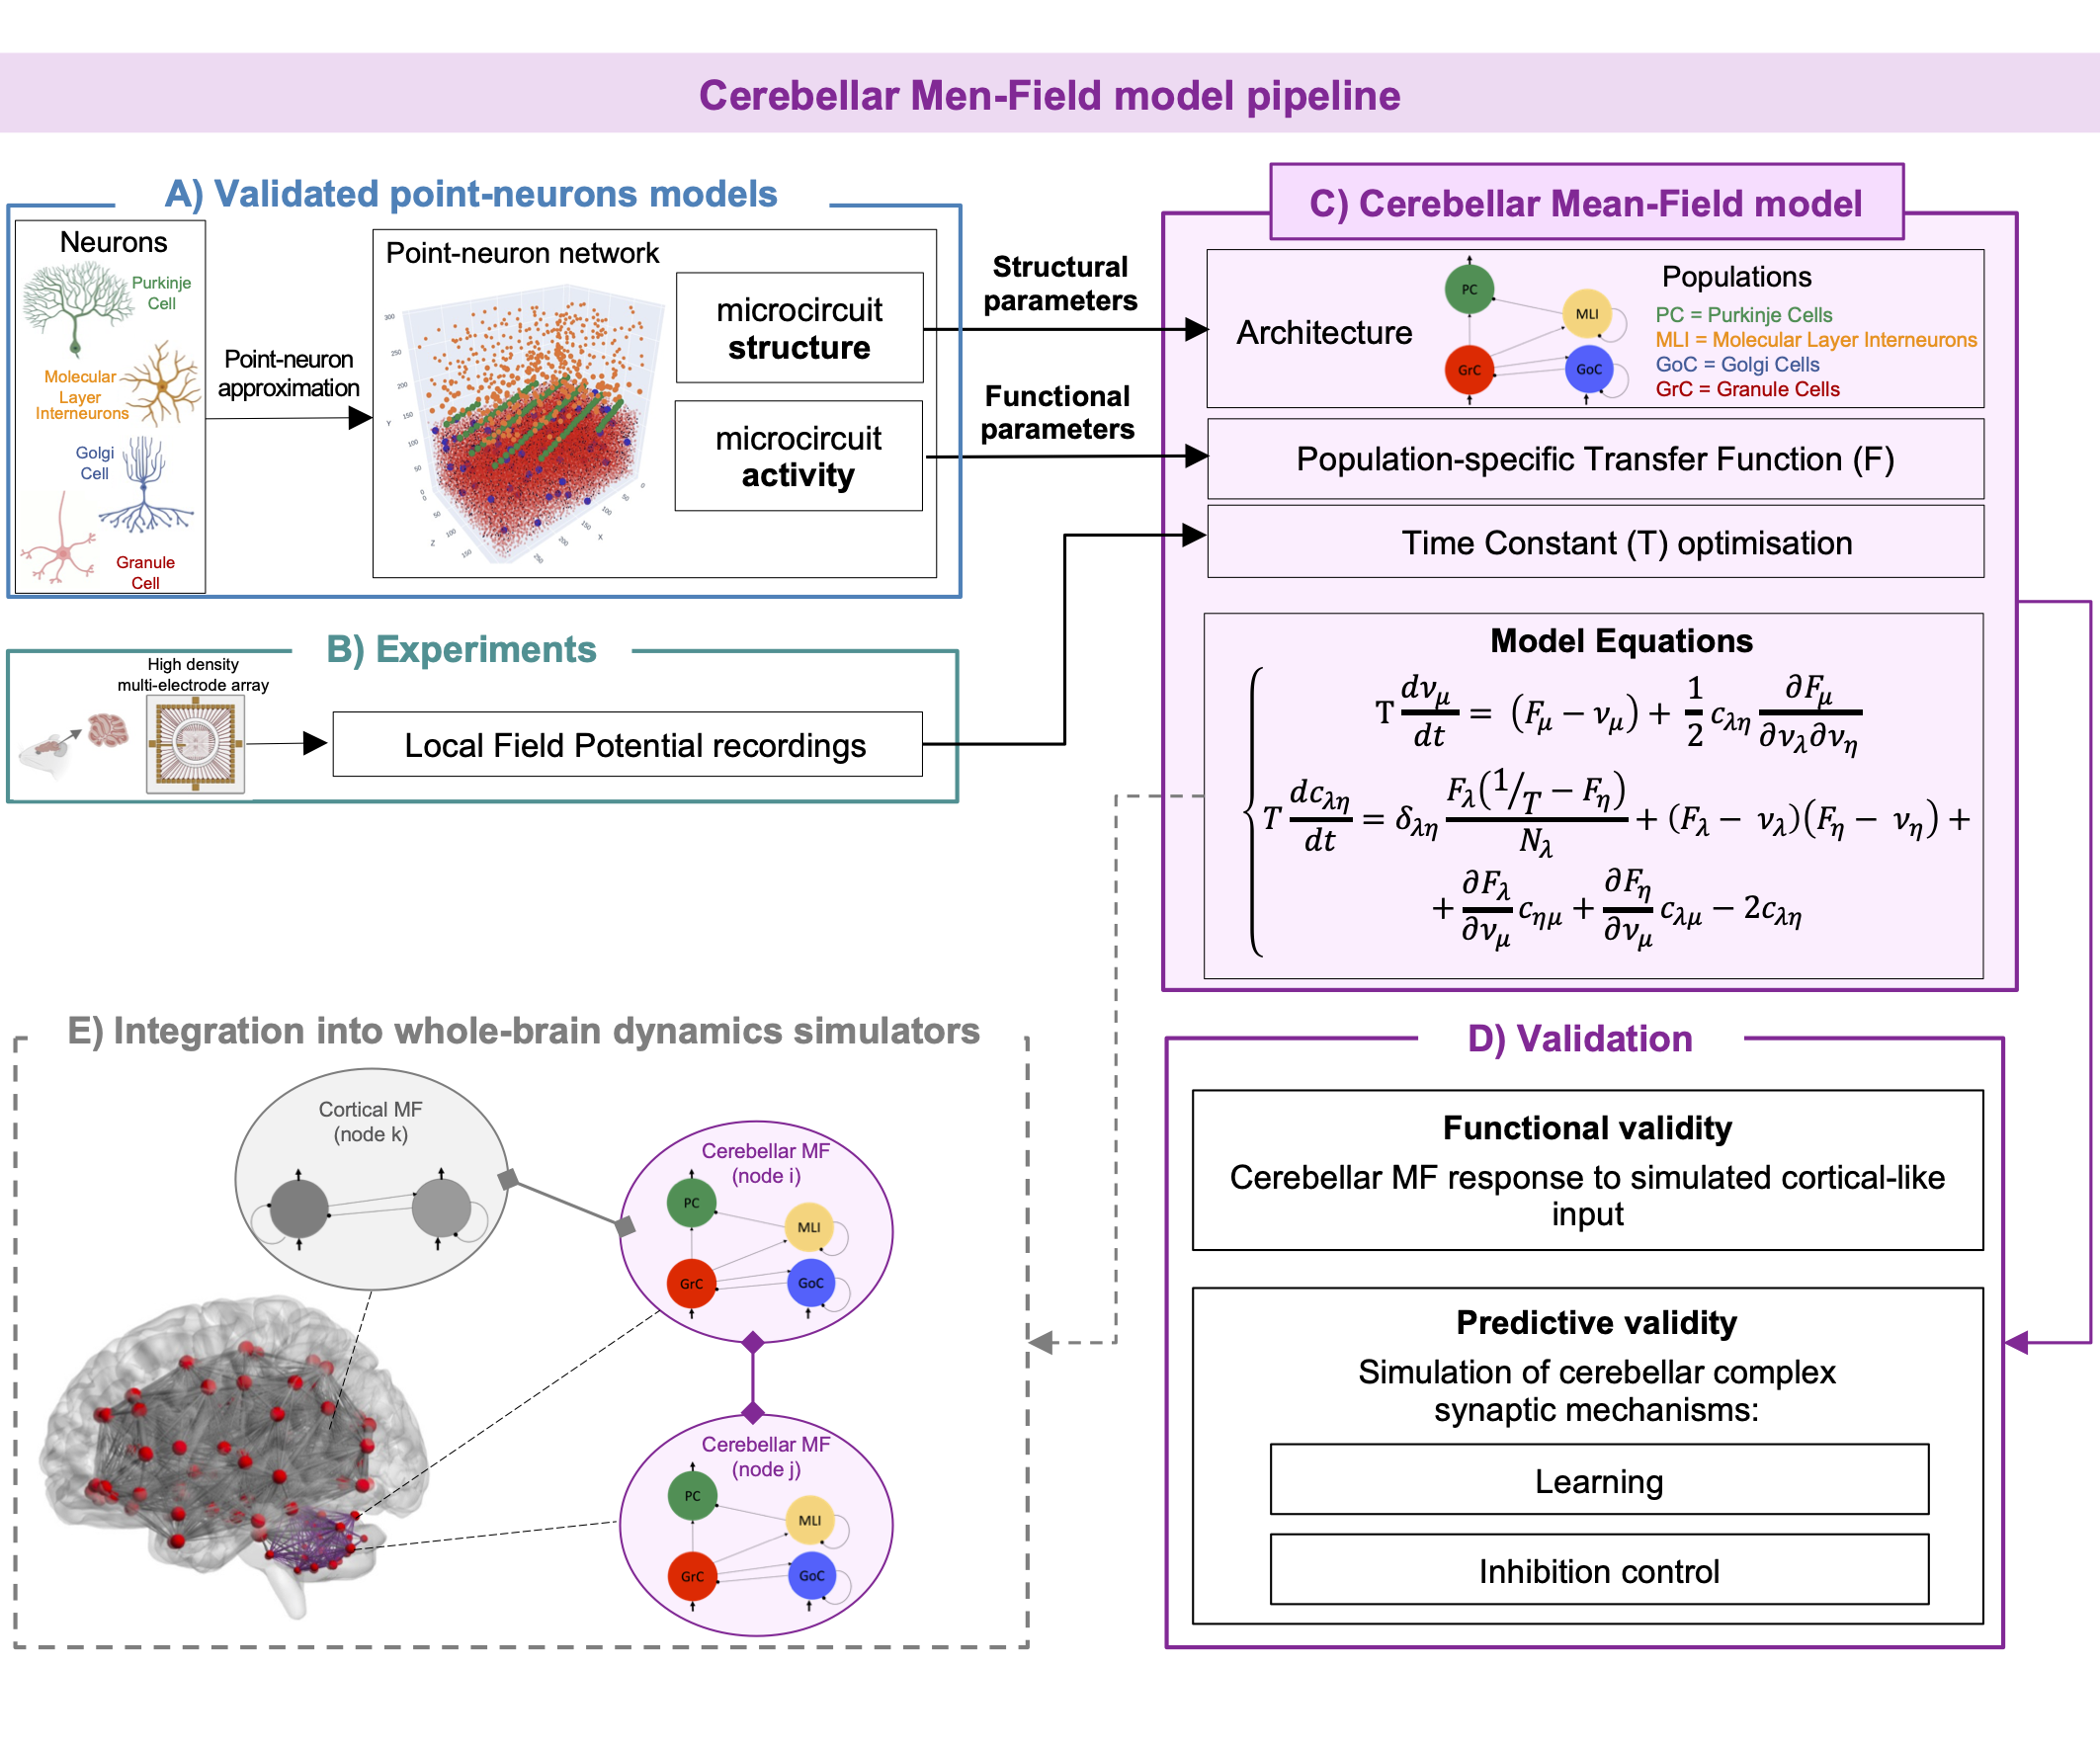
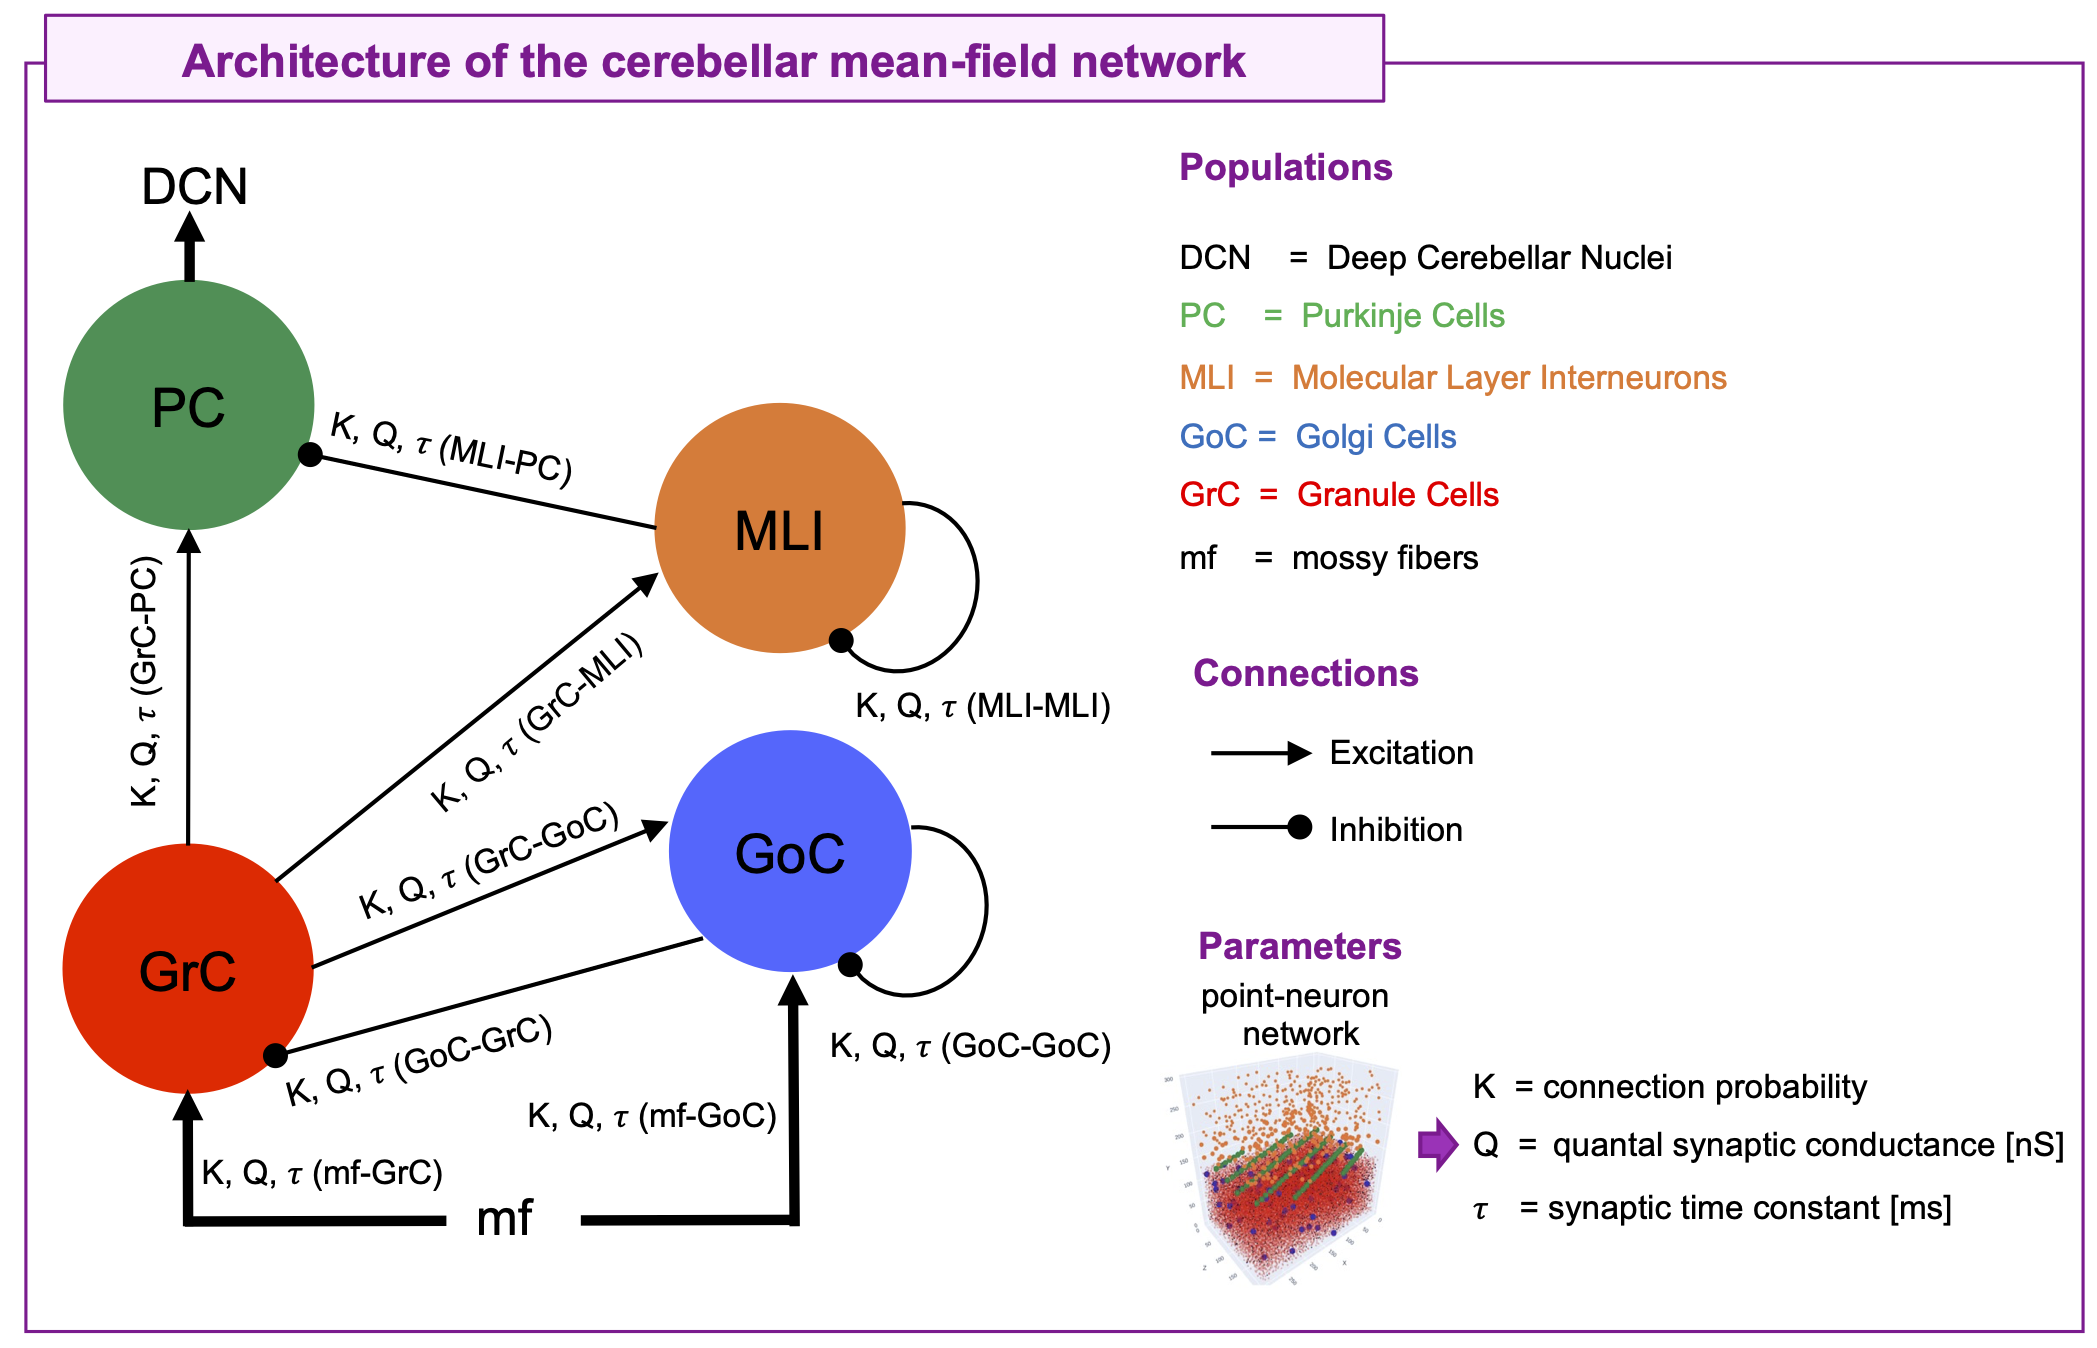
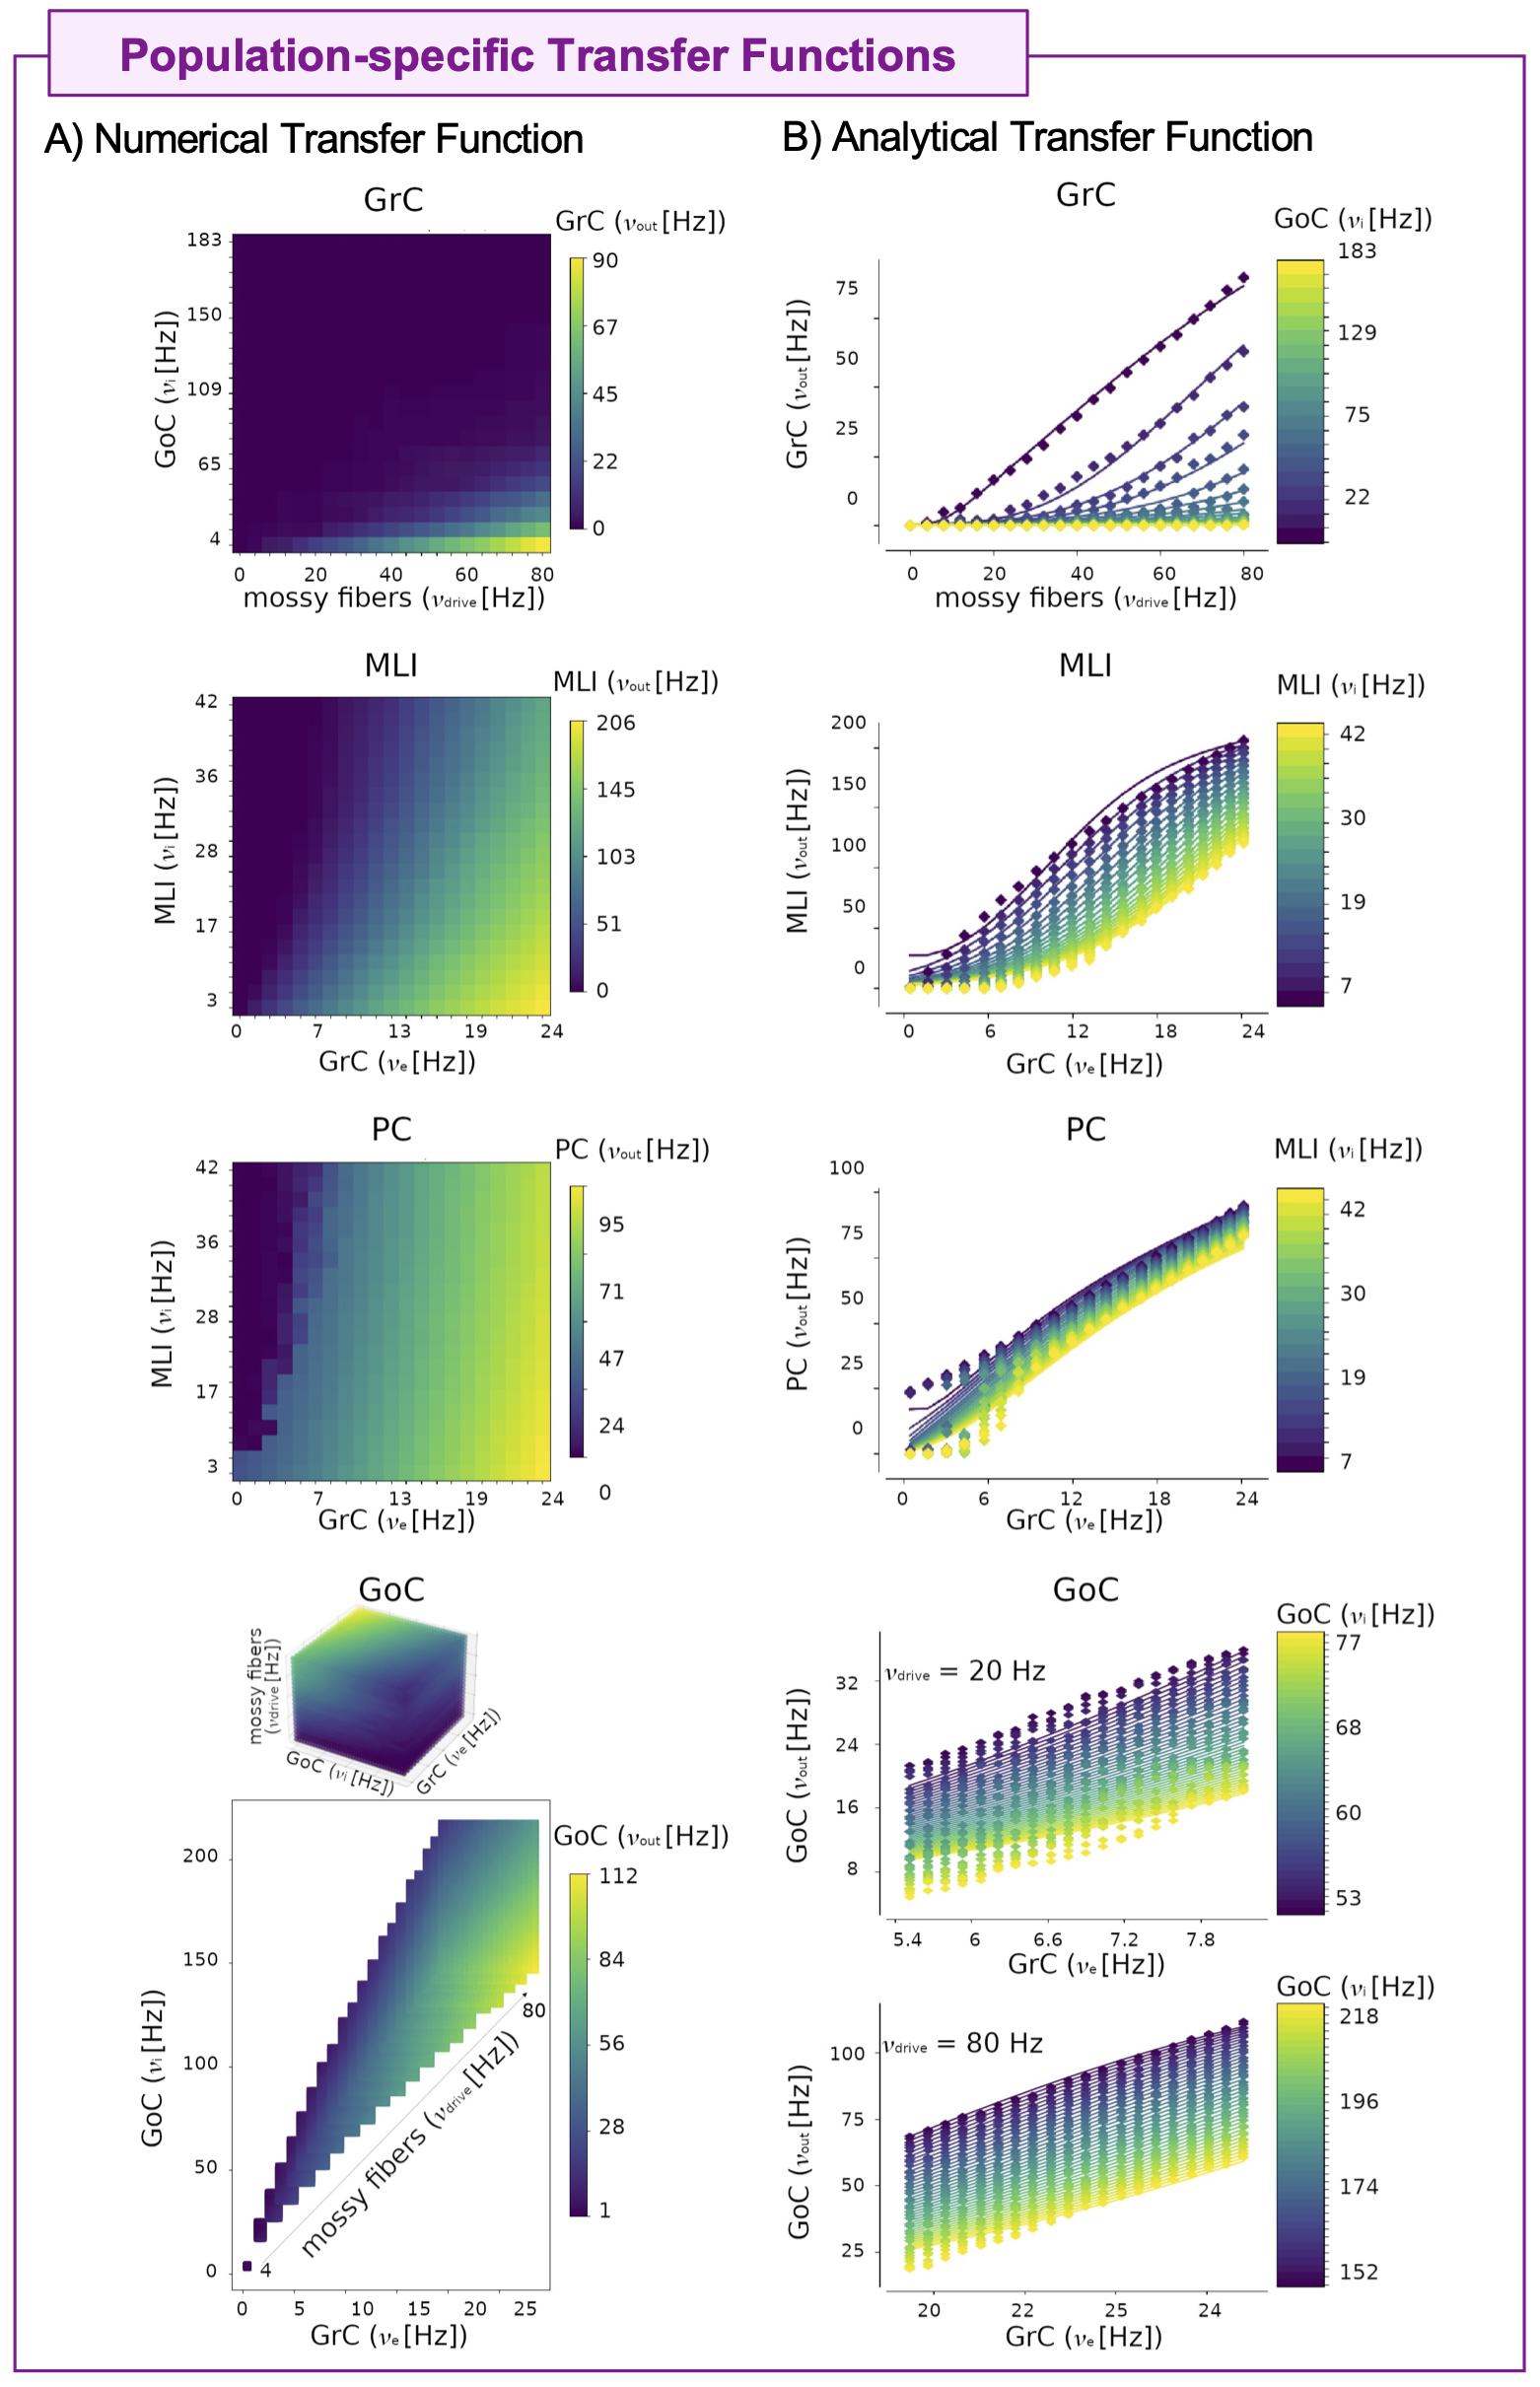
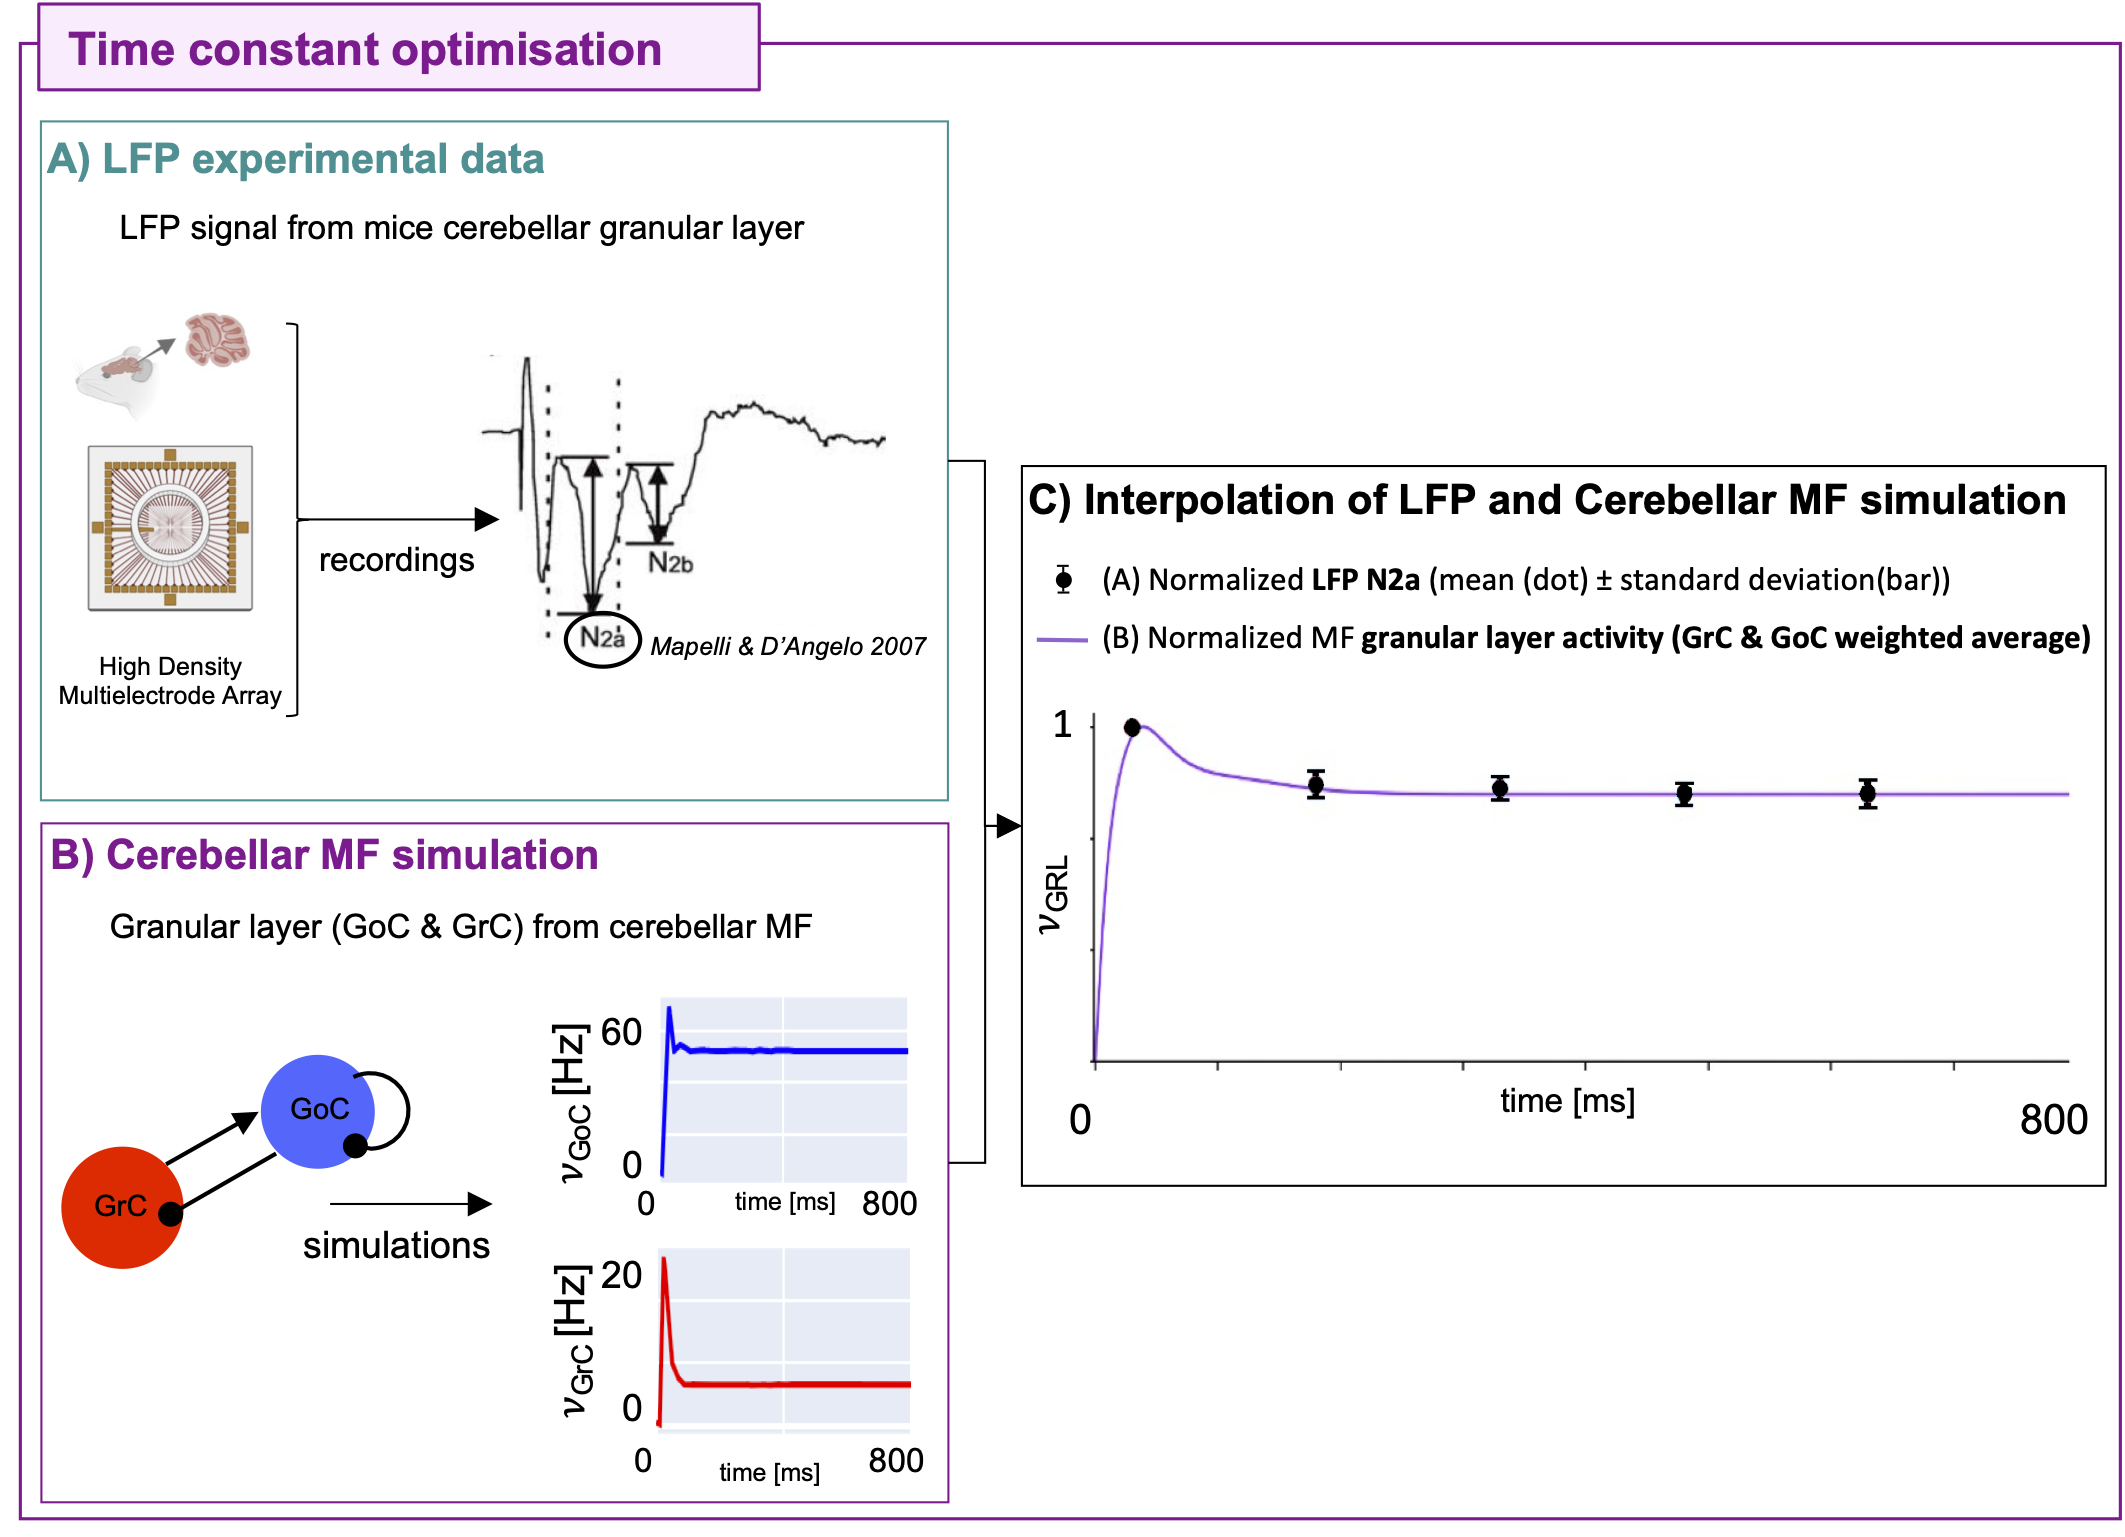
Figure 4) Optimization A) Local Field Potential (LFP) signals were acquired in the granular layer of mice cerebellar slices with High Density Multielectrode Array in response to 5 pulse trains of 50 Hz. B) Mean-field (MF) granular layer activity for different values of time constant T was simulated with the same protocol of LFP. C) The weighted average of the MF granular layer activity (𝜈GRL) interpolates the amplitude of LFPs. The GoC and GrC weights are 13% and 87%, respectively. LFP data and MF prediction were normalized on the maximum. Optimal T is 3.5 ms with mean absolute error = 3%