1281
Cell-type specific basal forebrain modulation shapes global functional network organizations supporting behavioral variability1Southern Medical University, Guangzhou, China, 2Institute of Neuroscience, Chinese Academy of Sciences, Shanghai, China
Synopsis
Keywords: fMRI, fMRI, cell-type specific optogentics; basal forebrain
Activations of the basal forebrain (BF) were associated with arousal fluctuations1, and the regulation of the default model network2,3. However, it remains ambiguous how the cell-type specific BF neurons shape the behavioral performances. We developed an awake mouse fMRI setup with simultaneous cell-type specific optogenetic stimulations in BF. Combined with the anterograde tracing data4, we revealed weak structural-functional correspondence of BF neurons, and demonstrated the cell-type specific BF modulations shaped global functional network organizations supporting behavioral variability. Our results made great sense on the understanding the cerebral regulations and behaviors from BF neurons in a macroscopic whole-brain view.Introduction
The basal forebrain has been implicated in a variety of brain functions such as arousal4, attention, and plasticity. Previous studies have observed the regulation from BF neurons on the default model network and associated behaviors3. Nevertheless, it remains ambiguous how cell-type specific BF neurons devoted to the BOLD activations and influenced the behavioral variability. We combined the awake mouse fMRI setup with simultaneous optogenetic stimulation to explore how the BF neurons shape global functional network organizations and further manipulate mouse behaviors.Method
Thirty-six mice were used in awake mouse fMRI and behavioral studies, including 7 male ChAT-IRES-Cre, 8 male PV-IRES-Cre, 7 male SOM-IRES-Cre, 7 male VGLUT2-IRES-Cre and 7 male wild-type mice. For each mouse, 6 scan of fMRI data were collected using the multiband EPI sequence with the following parameters: bi-band, TR = 500 ms, TE = 15 ms, flip angle = 38.8°, bandwidth = 300 kHz, field of view = 15 × 10.5 mm2, matrix size = 100 × 70, nominal slice thickness = 0.48 mm (slice thickness 0.4 mm with a gap of 0.08 mm), 38 axial slices, and 750 volumes per scan. A T2-weighted structural image was also acquired for co-registration with following parameters: TR = 3300 ms, TE = 11 ms, flip angle = 38.8°, bandwidth = 300 kHz, field of view = 16× 16 mm2, matrix size = 256 × 256, slice thickness = 0.48 mm, 38 axial slices, RARE factor = 8, number of averages = 2. The overall stimulation setup was shown in Fig. 1A-B. For each EPI run, 28 stimuli were delivered with durations of 0.5 s or 2 s, and a random inter-trial-interval time of 15 +/- 3 s. Light (100 ms pulse width, 5 mW at the fiber tip) was delivered to the bilateral BF using a 632 nm laser through a 6 m plastic optical fiber The secondary projections after 1st- order anterograde tracing output of cell-type BF neurons were concatenated and then decomposed by the non-negative matrix factorization (NMF). The temporal weights of each component were then estimated by back-projecting the spatial maps of NMF component to the raw BOLD time series. Free-moving optogenetic behavioral test was performed using a 30 cm cubic arena. The novel object exploration test was modified from the previous study5. The familiarization phase was shortened to 30 min in order to match the time of pre-scan (~30 min). In the test phase, a novel object was placed in another corner of arena, which was far from the familiar one. The optogenetic stimulation paradigm was same as that during fMRI scanning (Fig. 3B).Results
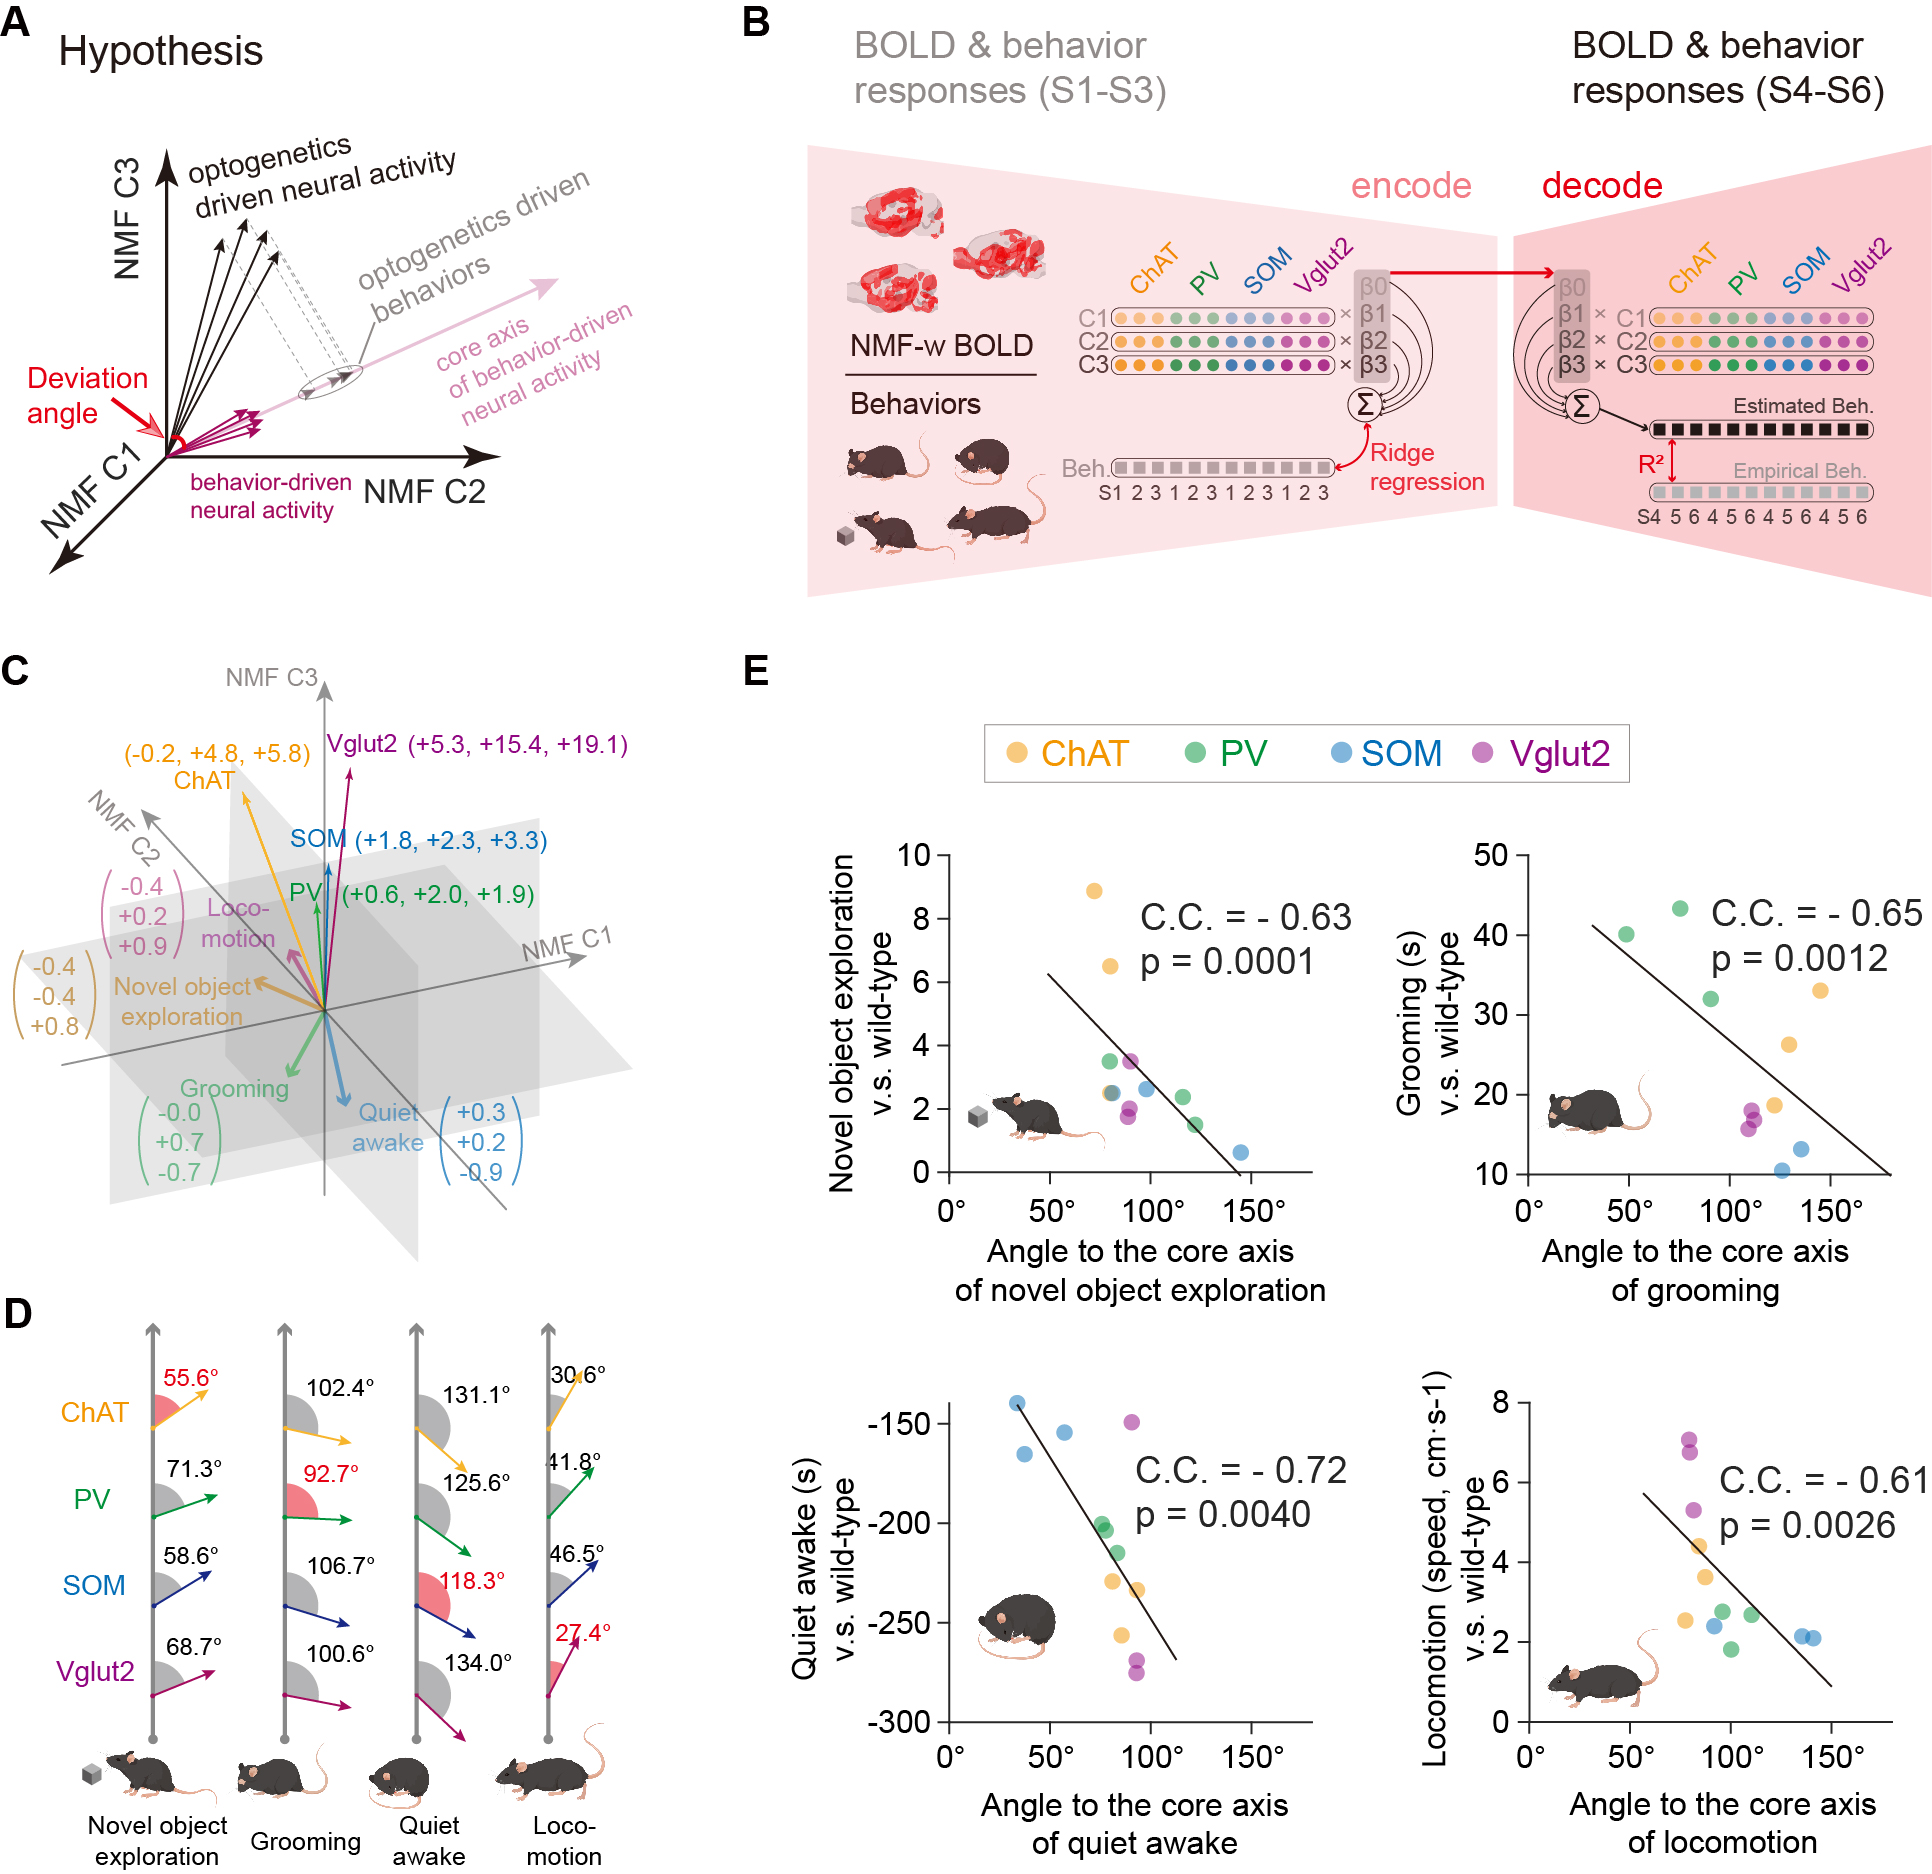
Fig. 1A-C showed the optogenetic stimulation setup, fMRI experiment timeline stimulation paradigm and corresponding activation maps of cell-type specific BF neurons. The anterograde tracing output (Fig. 1D,E) and corresponding weak structural-functional correspondences (Fig. 2A,B) indicated the latent shared tuning on cerebral dynamics under cell-type specific BF stimulations. Such phenomenon suggested the necessity of dimension reduction analysis (NMF, Fig. 3C) on the 1st- and 2nd-order anatomical projection matrix from cell-type specific BF neurons. The first three components (NMF C1-3) after the non-negative matrix factorization showed highly regional specificity (Fig. 2D, i.e., C1, unimodal region dominated; C2, multimodal region dominated; C3, subcortical region dominated), and highly captured the functional activation maps (Fig. 2E) under cell-type specific optogenetic stimulations in BF. Moreover, the corresponding low-dimensional manifold traversed across different sub-planes (Fig. 2F), suggesting the different global functional network organizations under the cell-type specific BF modulations. Moreover, the results of behavior test (Fig. 3) showed distinct behavioral performances under cell-type specific optogenetic stimulations, such as: Vglut2, locomotion preferred; PV, grooming preferred; SOM, quiet awake preferred (but significant lower v.s. the wild-type control); and ChAT, novel object exploration preferred. To further investigate how the global functional network organizations shaped the behavioral variability, we assumed that cell-type specific activations and behavior-related cerebral patterns shared common low-dimensional spaces (Fig. 4A). Using the encode-decode model (Fig. 4B, Scan 1-3 for encode and Scan 4-6 for decode), we estimated the eigenvectors for mouse behaviors (Fig. 4C, Scan 1-3 for encode) in the NMF space and found that higher behavior performance was corresponded to lower derivate angle for each behavioral category (Fig. 4D). Significantly negative correlations between derivate angles and behavioral performance (Fig. 4E, Scan 4-6 for decode) further indicated the cell-type specific BF modulations shaped global functional network organizations supporting behavioral variability.Discussion
Results suggested that the cell-type specific BF activation maps were derived from the global network organizations, rather the direct cell-type specific anatomical projections. Moreover, the corresponding behavioral variability was significantly correlated with the derivate angle between the eigenvectors of optogenetics- and behavior- driven neural activity in the low-dimensional NMF space.Conclusion
We demonstrated the cell-type specific BF modulations shaped global functional network organizations supporting the behavioral variability, utilizing the awake mouse fMRI setup with simultaneous optogenetic stimulations. This work provides a new perspective on the structural-functional coupling and it is of great necessity to understand the cerebral patterns of behaviors in a macroscopic whole-brain view.Acknowledgements
The study was supported by the National Natural Science Foundation of China (8217070761 to ZL., U21A6005 to YF.), Science and Technology Innovation 2030- Major Project for Brain Science and brain-like Program (2021ZD0202200).References
1. Anaclet, C. et al. Basal forebrain control of wakefulness and cortical rhythms. Nat Commun 6, 8744, (2015).
2. Turchi, J. et al. The Basal Forebrain Regulates Global Resting-State fMRI Fluctuations. Neuron 97, 940-952 e944, (2018).
3. Nair, J. et al. Basal forebrain contributes to default mode network regulation. Proc Natl Acad Sci U S A 115, 1352-1357, (2018).
4. Xu, M. et al. Basal forebrain circuit for sleep-wake control. Nat Neurosci 18, 1641-1647, (2015).
5. Lozano-Montes, L. et al. Optogenetic Stimulation of Basal Forebrain Parvalbumin Neurons Activates the Default Mode Network and Associated Behaviors. Cell Rep 33, 108359, (2020).
Figures
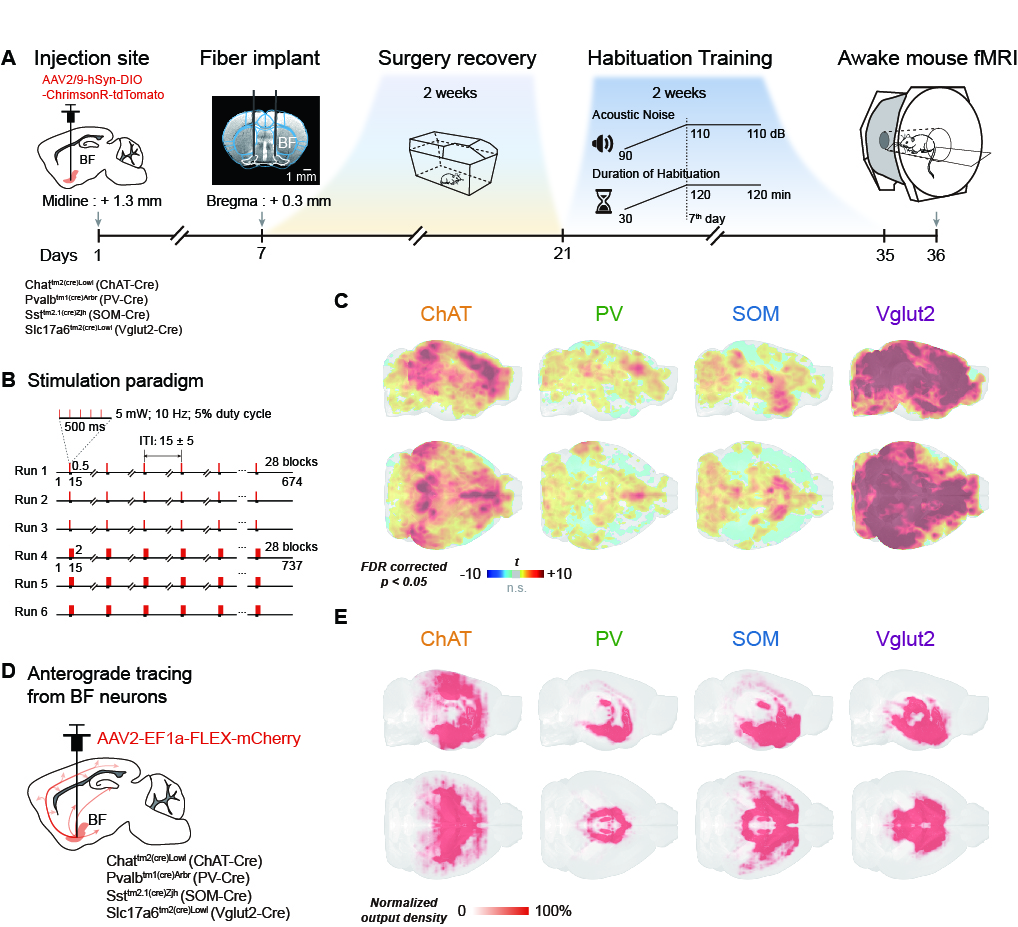
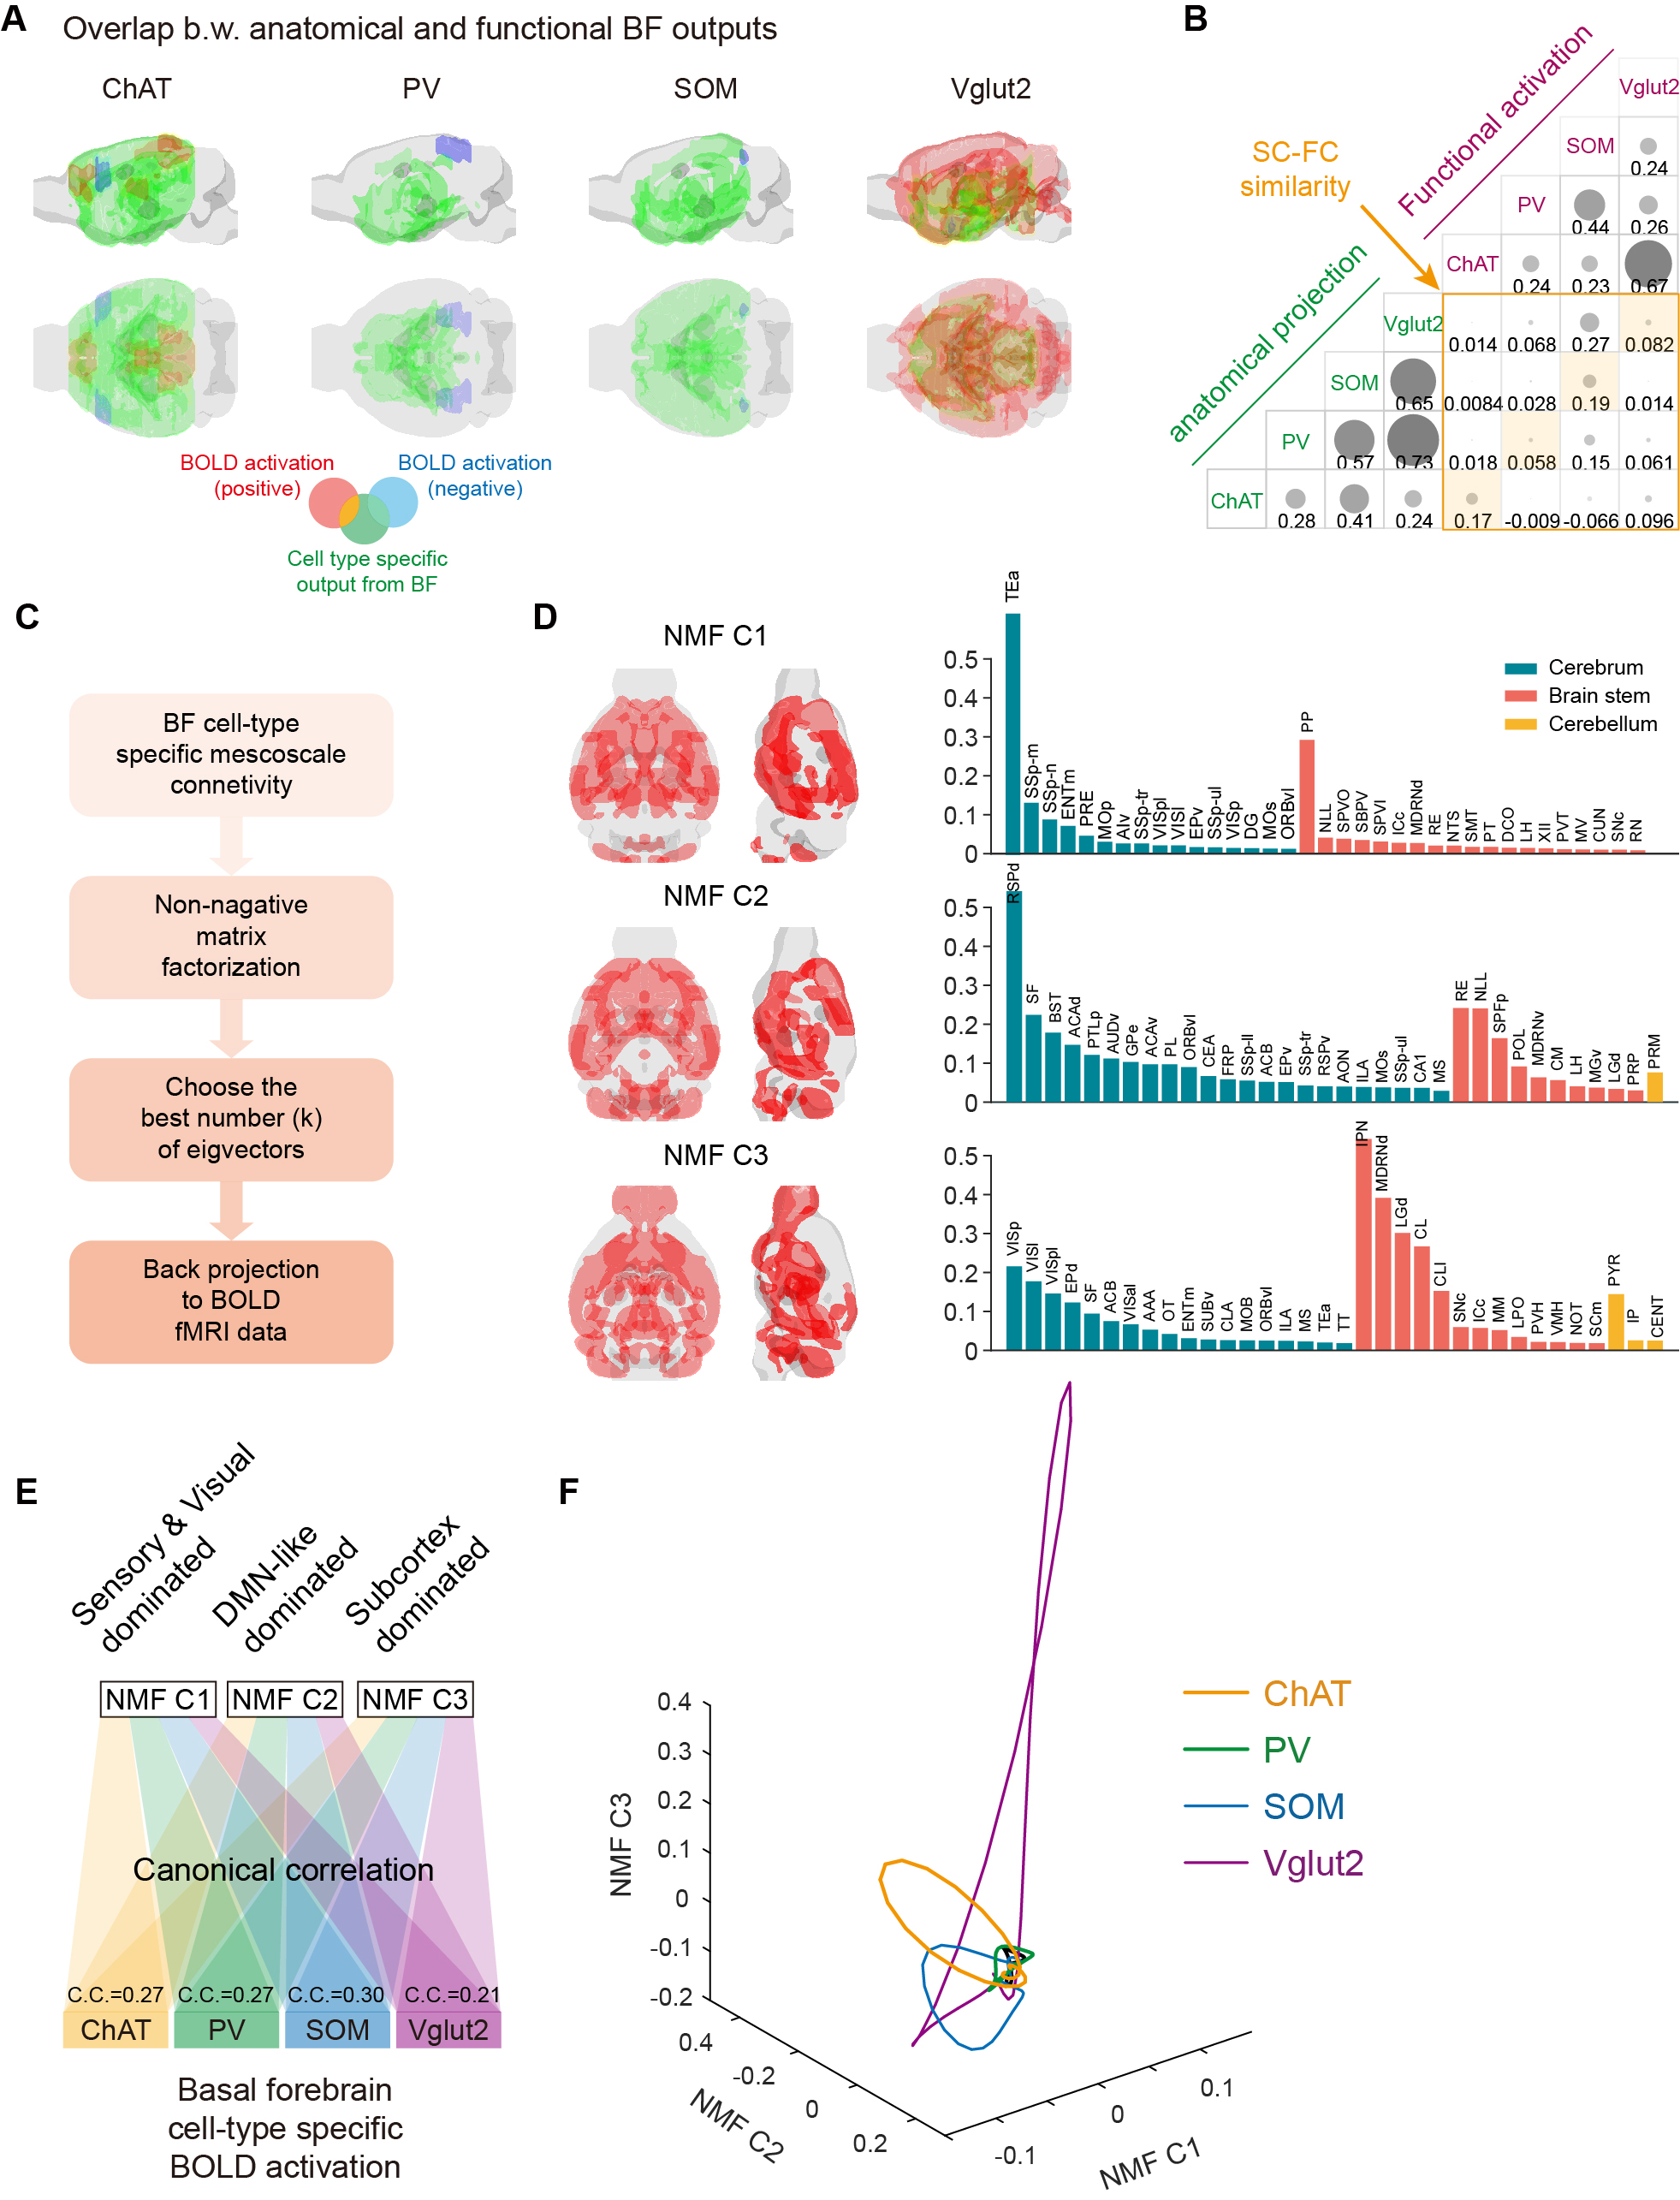
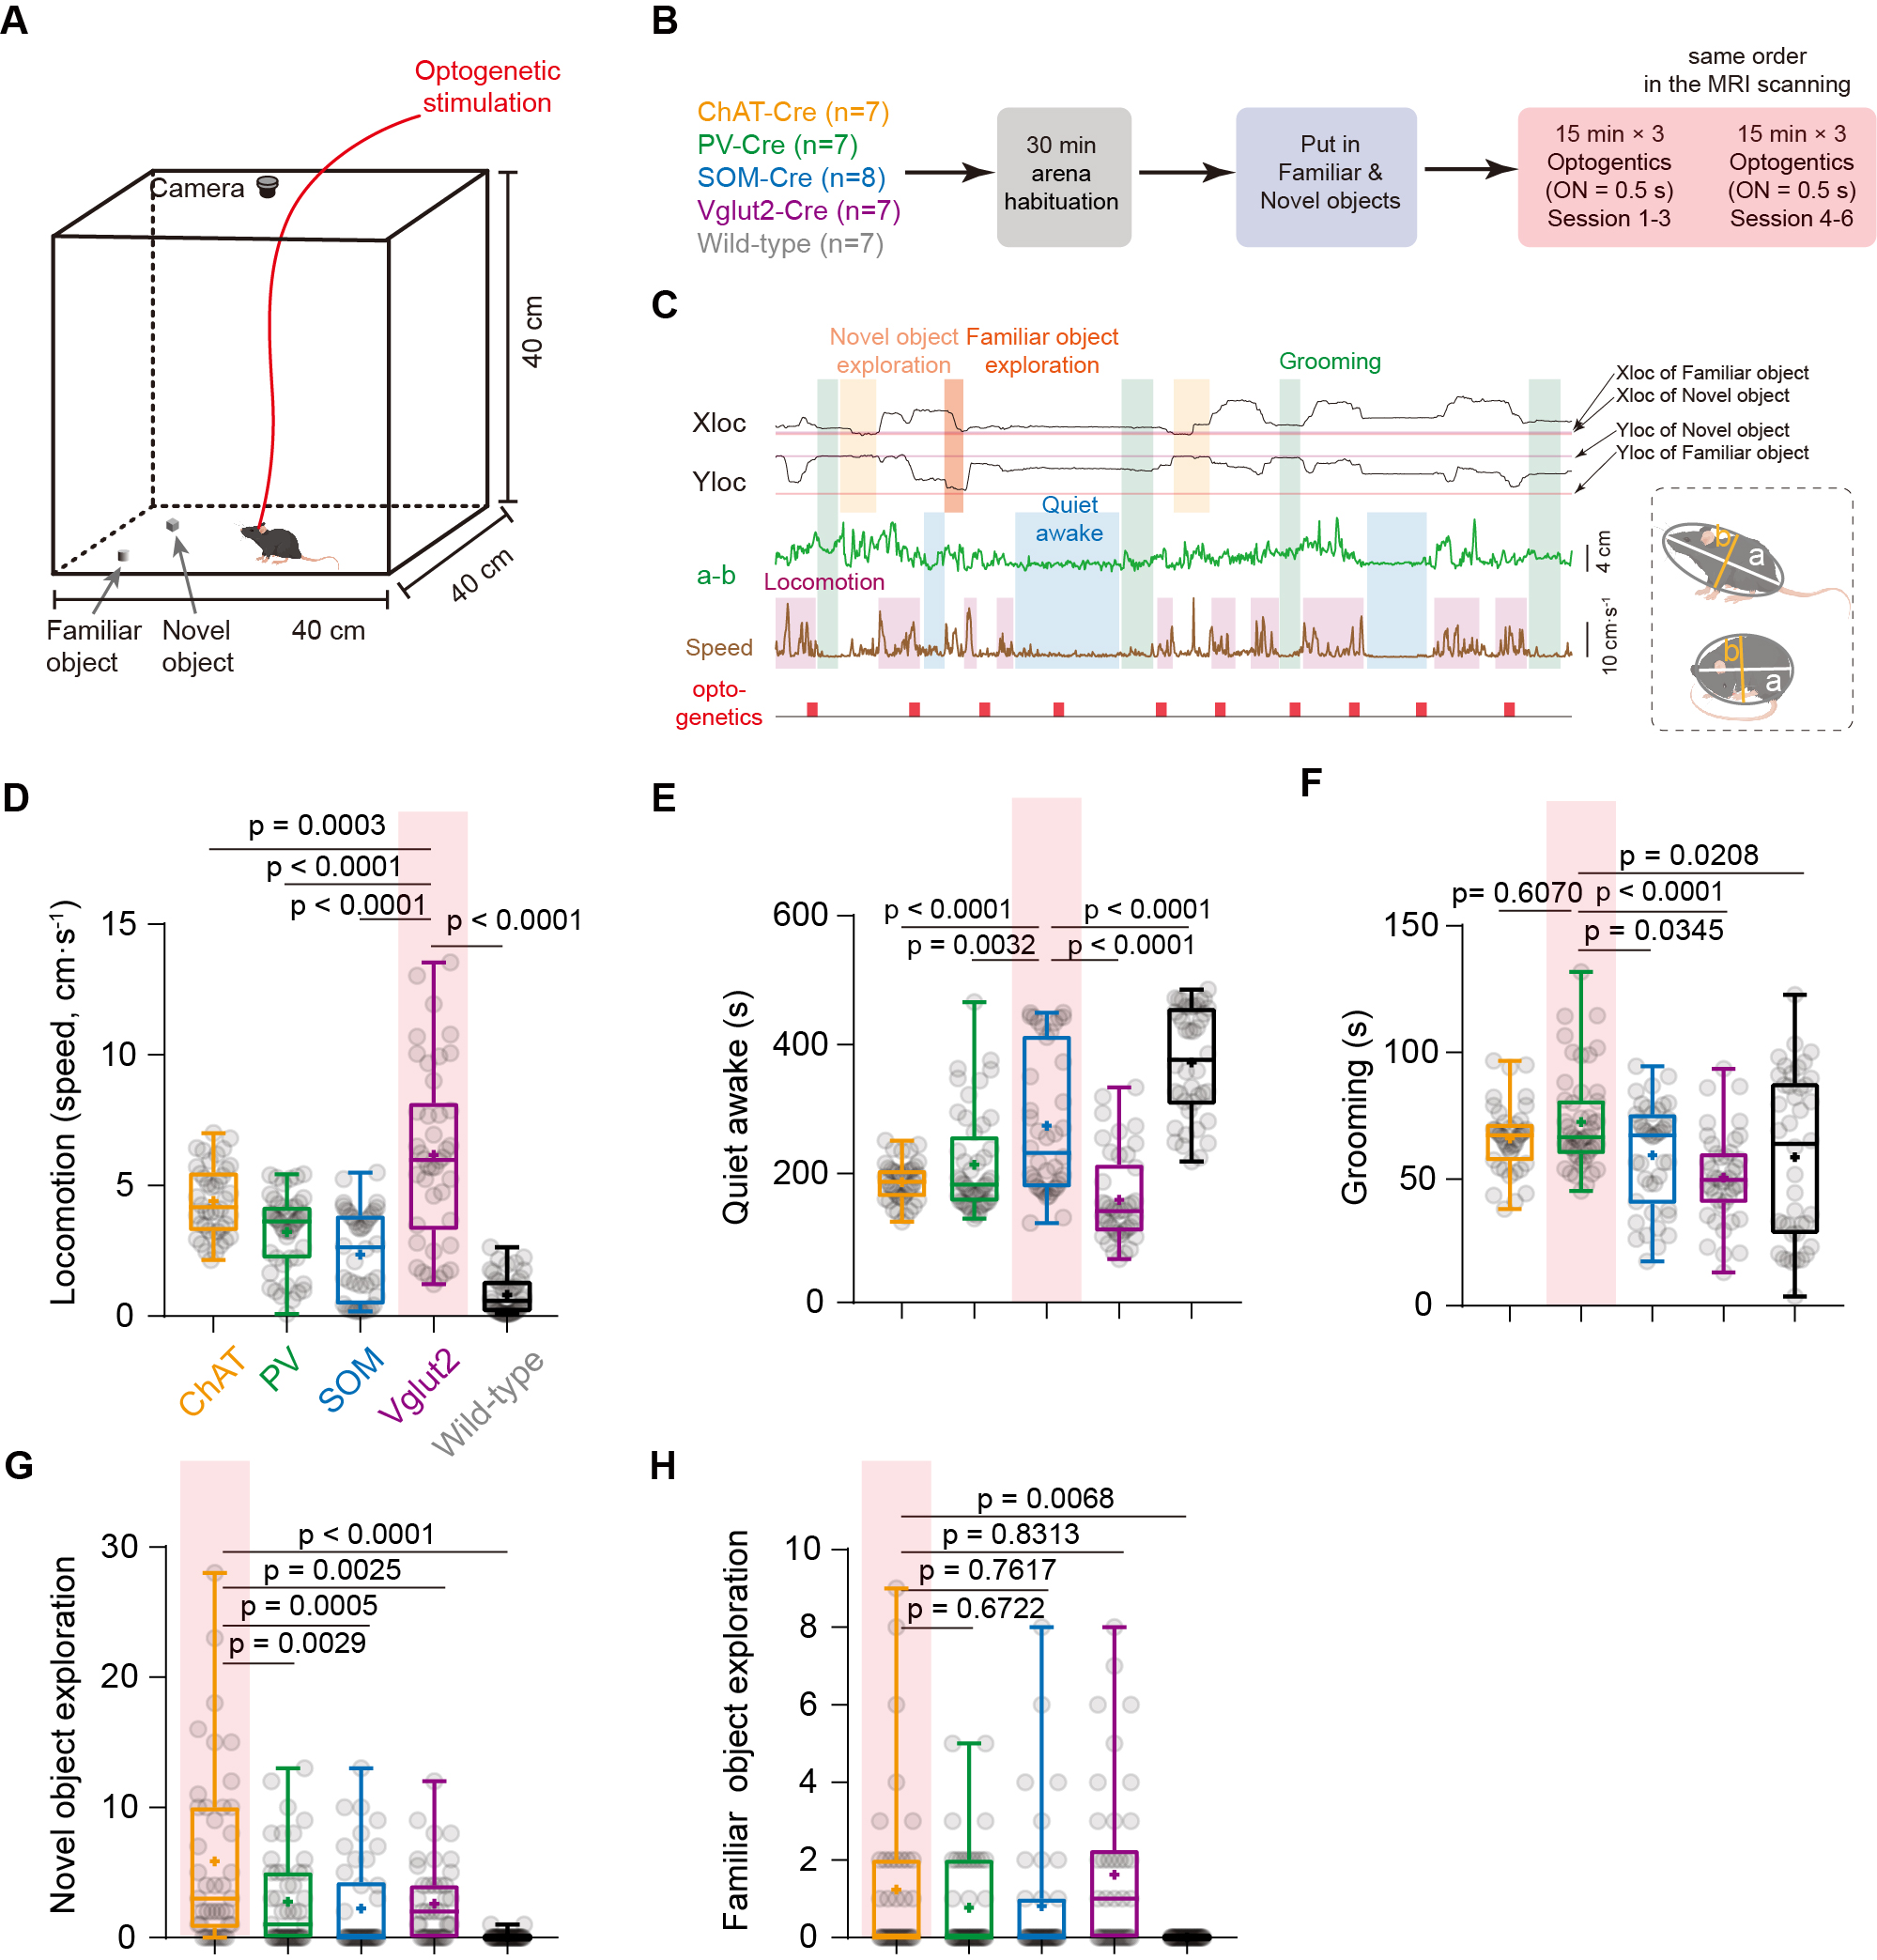
Figure 3. Behavioral performances under cell-type specific optogenetic stimulations in BF. (A-B) Schematic of the behavioral experiments. (C) Representative example of behavioral traces with optogenetic stimulations in BF. (D-H) Behavioral performances under cell-type specific optogenetic stimulations in BF.