1280
En Route to Fine-Grained Neurosignatures in the Individual Brain: Evaluating Methodology to Boost Spatial Accuracy & Sensitivity of BOLD fMRI1Berlin Ultrahigh Field Facility (B.U.F.F.), Max Delbrück Center for Molecular Medicine, Berlin, Germany, 2Weierstrass Institute for Applied Analysis and Stochastics, Berlin, Germany, 3Experimental and Clinical Research Center, a joint cooperation between the Charité Medical Faculty and the Max Delbrück Center for Molecular Medicine in the Helmholtz Association, Berlin, Germany
Synopsis
Keywords: High-Field MRI, fMRI
In recent years, fMRI at ultrahigh magnetic field strengths (≥7T) has shifted from group analyses to probing neural processing in the individual brain. Identifying neurosignatures requires detection of BOLD effects with high sensitivity and spatial accuracy. Yet, it remains a challenge to enhance the sensitivity of fMRI for the BOLD effect without blurring the spatial details. Here, we assess the quality of the Gaussian, spatial adaptive non-local means (SANLM) and the adaptive weights smoothing (AWS) filters by employing a synthetic fMRI dataset as ground truth. AWS provides superior localization of the BOLD activations with high sensitivity at reasonable noise levels.
Introduction
Ultrahigh field functional MRI (fMRI) of the brain has recently shifted from group level analysis to detailing neural processing in single subjects1. Identifying functional neurosignatures in the individual brain requires detection of BOLD effects with high sensitivity and spatial accuracy. But BOLD sensitivity and spatial accuracy come as a trade-off: Gaussian smoothing, which is commonly applied to improve BOLD sensitivity causes a substantial loss of spatial accuracy by blurring the anatomical boundaries and introducing confounding effects from neighboring voxels. We recently evaluated spatial adaptive non-local means (SANLM) filtering as a potential alternative with promising results2. Yet, the spatial accuracy could not be adequately assessed, as it was applied only to experimental data, lacking ground truth.To address this limitation this work evaluates the performance of the Gaussian, SANLM and the adaptive weights smoothing (AWS)3 filters using a synthetic fMRI dataset for rigorous evaluation. We employed metrics for BOLD sensitivity and spatial accuracy to qualify and rank the performance of the applied filters. We further introduced a new metric to assess the extent to which the filters affect the statistical z-scores toward the edges of BOLD clusters and preserve their relative statistical magnitude (RSM). The overall goal is to adapt and evaluate apt methodology to preserve spatial accuracy of BOLD patterns with high sensitivity, en route to identifying fine-grained functional neurosignatures of pain at the level of single subjects.
Methods
Synthetic datasets: One volume from a brain fMRI dataset acquired at 7.0 T (single shot EPI, TE=33.2 ms, spatial resolution=1.5mm isotropic) was extracted and duplicated 599 times. Four masks with different shapes and sizes were created to define the regions of activation (Fig. 1). Eight onsets of activation with a separation of 90 seconds between each other were convolved with a double gamma function to simulate the hemodynamic response function. Gaussian and Rician noises were simulated with FSL4. A third noise type termed "acquired" was obtained by calculating the difference between an unfiltered fMRI dataset and one filtered with NORDIC5. The three types of noises were amplified to five magnitudes, 1%, 2%, 4%, 8%, and 16%. Finally, the noises were added to the synthetic BOLD signal time-series. Data analysis: Pre-processing of actual fMRI data to calculate temporal SNR (tSNR) and acquired noise was performed using fMRIPrep6. SANLM filtering of the synthetic fMRI data was performed with the CAT12 toolbox (SPM12) at three intensities: light, medium, and strong. Gaussian smoothing was carried out at 1.5, 2.5, and 3.5 full width at half maximum millimeter with AFNI. FSL FEAT was used for first-level analysis by generalized linear model (GLM) regression. The AWS filter runs in R environment, as part of the fmri and aws libraries. AWS employs as inputs the contrast beta weights, variance contrast beta weights, and the residuals, obtained by the GLM. Spatial accuracy: the Sørensen-Dice coefficient was employed (Fig. 3c). BOLD sensitivity: true positives (TP) divided by the sum of TP and false negatives (FN) (Fig. 3d). RSM: requires a normalized z-map (Fig. 4b) calculated by dividing the activation z-map by its highest voxel value, then subtracting it from the synthetic z-map, creating a difference map (Fig. 4c). The RSM equals the inverse of the product between the mean of the difference map and the number of active voxels in the difference map (Fig. 4a).Results
Gaussian and SANLM filters amplified the BOLD effect but blurred the spatial details of BOLD clusters (Fig. 2) and deformed the original shapes of the clusters (Fig. 1). AWS maintained the geometry of BOLD clusters at noise levels in the cortical tSNR range (Fig. 1). BOLD cluster shapes were insufficiently preserved for higher noise levels (≥4%) for all the filter methods. The number of FN increased with higher noise levels (Fig. 3a). Gaussian smoothing and SANLM at strong filter strength exhibited higher FP than the other methods (Fig. 3b), which yielded low spatial accuracy. AWS achieved substantially higher accuracy at the first three noise levels (Fig. 3c). BOLD sensitivity was approximately similar across filters (Fig. 3d). AWS’s RSM values were remarkably higher than those obtained for the other filters (Fig. 4c). The overall filter performance was calculated by averaging across the three types of noise levels at 1% and 2% to outline results corresponding to cortical tSNR, and 2% and 4% for the subcortex (Fig. 5). AWS performed best in terms of accuracy with comparably high sensitivity and significantly higher RSM scores (Fig. 5).Discussion & Conclusion
We benchmarked the performance of different filter approaches in regard to enhance BOLD sensitivity and preserve spatial accuracy. The synthetic datasets created as ground truth enabled us to evaluate the quality of the filter approaches based on the above criteria. AWS results outperformed Gaussian and SANLM filters in terms of spatial accuracy. AWS provides a better localization of the BOLD activations and preserves the cluster geometry at reasonable noise levels (1-2%). To conclude, AWS demonstrated to be a superior filtering method that boosts BOLD sensitivity, while preserving spatial accuracy, and depicting the best magnitude fidelity to the BOLD activations. Our finding provides an important technical foundation for the correct analysis of BOLD fMRI into fine-grained functional neurosignatures in the individual brain.Acknowledgements
No acknowledgement found.References
1. Dubois J, et. al., Building a Science of Individual Differences from fMRI. Trends Cogn Sci. 2016 Jun;20(6):425-443. DOI: 10.1016/j.tics.2016.03.014.
2. Tellez I, Reimann H. (2022) Non-Local Means Denoising of 7T Functional MR Images: Enhancing Spatial Accuracy of Fine-Grained Task-Specific Neurosignatures? ISMRM-ESMRMB & ISMRT 31st Annual Meeting. London UK.
3. Tabelow K, et. al., Analyzing fMRI experiments with structural adaptive smoothing procedures. Neuroimage. 2006. DOI: 10.1016/neuroimage.2006.06.0294
4. M.W. Woolrich, et. al., Bayesian analysis of neuroimaging data in FSL. NeuroImage, 45:S173-86, 2009
5. Vizioli, L., et. al., Lowering the thermal noise barrier in functional brain mapping with magnetic resonance imaging. Nat Commun 12, 5181, 2021. https://doi.org/10.1038/s41467-021-2
6. Esteban, O., et. al., fMRIPrep: a robust preprocessing pipeline for functional MRI. Nat Methods 16, 111–116, 2019. https://doi.org/10.1038/s41592-018-0235-4
Figures
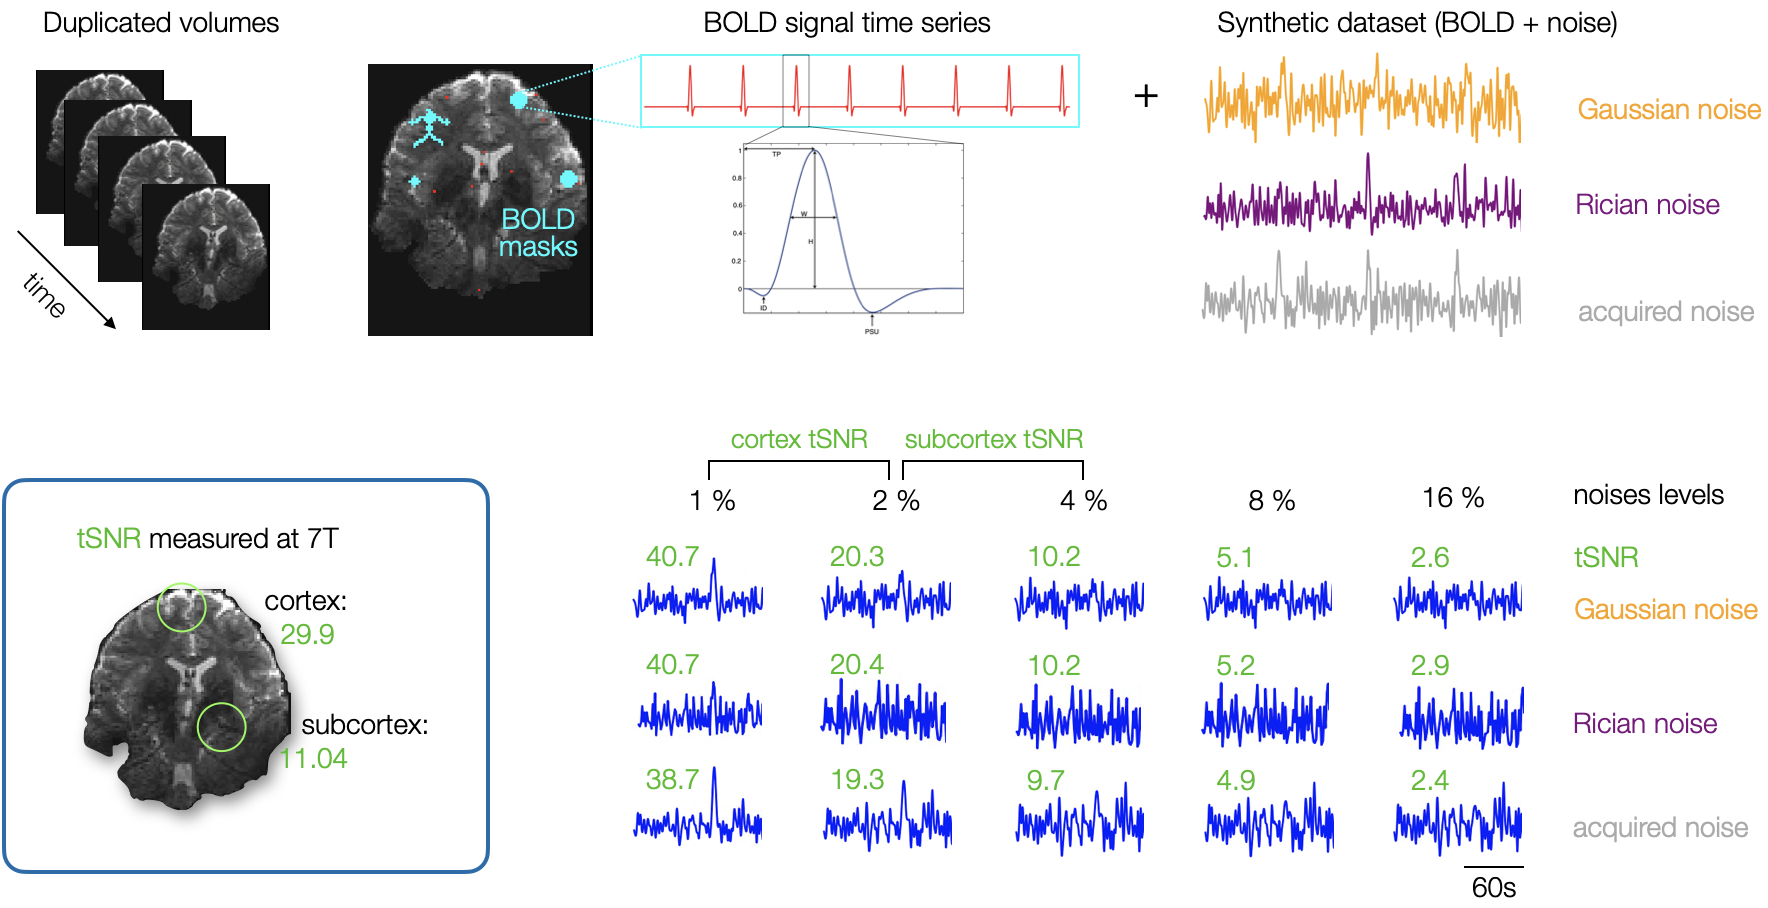
Synthetic datasets creation. One volume of an acquired fMRI time series was extracted and duplicated 599 times. Four different masks were created to define the activation regions. Gaussian, Rician and acquired noise were simulated and amplified to 5 magnitudes (1-16%). The noises were added to the synthetic BOLD signal time series. tSNR values were measured at the cortex and subcortex on real fMRI experimental data acquired at 7T and on the synthetic time series to outline the range of real noise.
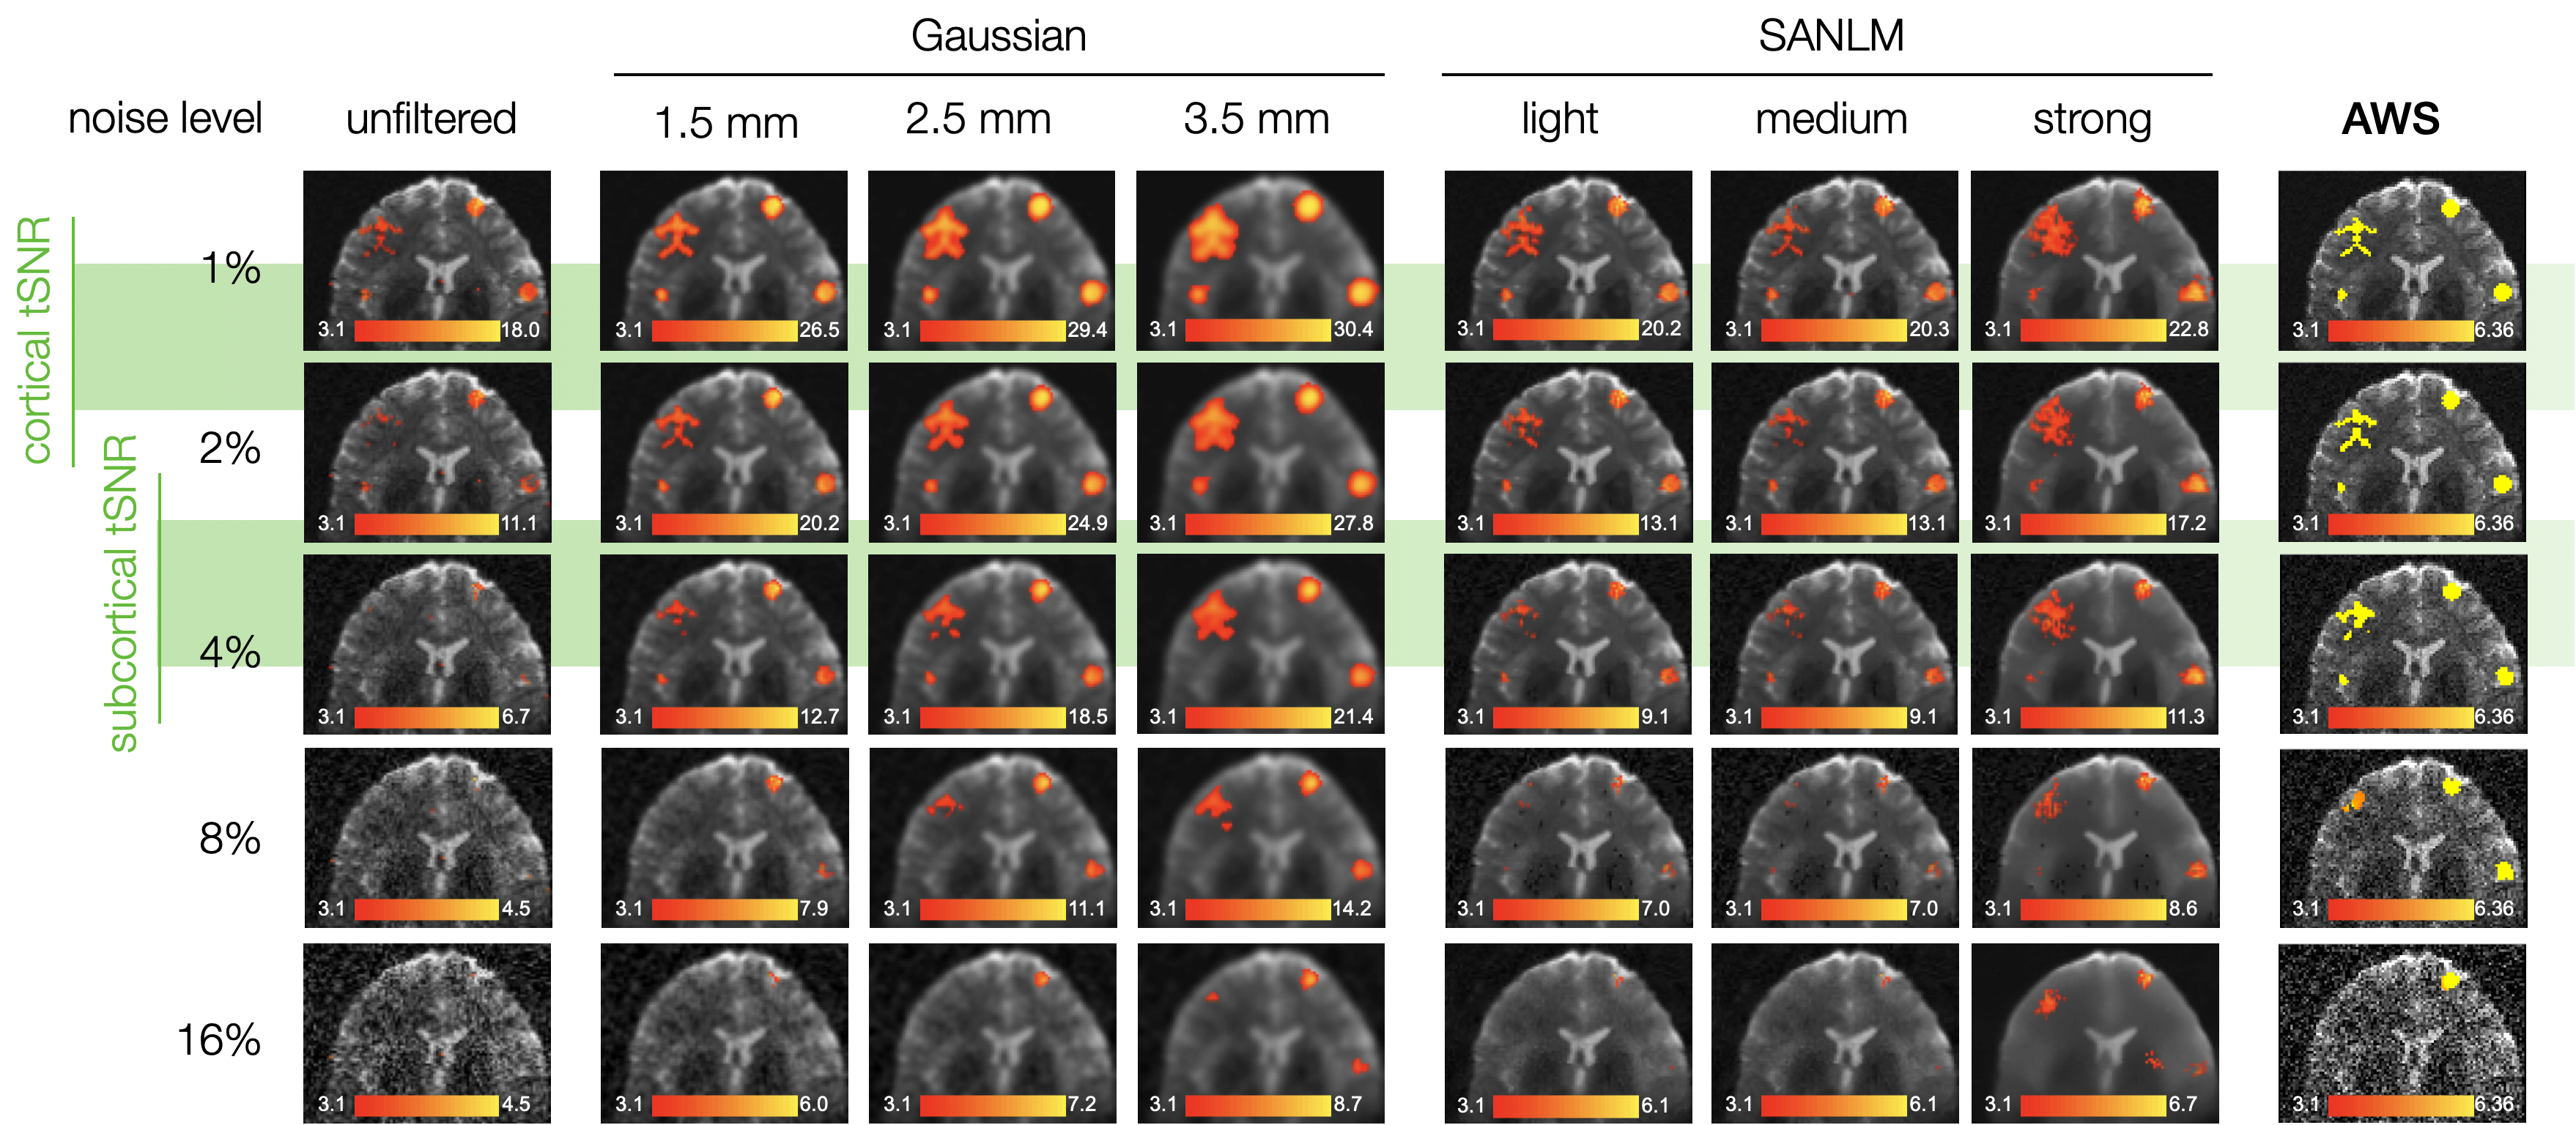
BOLD cluster comparison: Gaussian noise between 1-16% noise levels. Unfiltered data compared to Gaussian, SANLM and AWS filters. Gaussian filters amplifiy the BOLD effect but blur the spatial details of BOLD clusters. SANLM data show amplification of BOLD effects, deforming the shapes of the original clusters. AWS preserves the geometry of the cluster at the cortical tSNR range. Gaussian and SANLM filters z-scores decrease for greater noise levels. AWS keeps the same range of z-scores along all the noise levels, depicting all the BOLD clusters with their highest value (6.36).
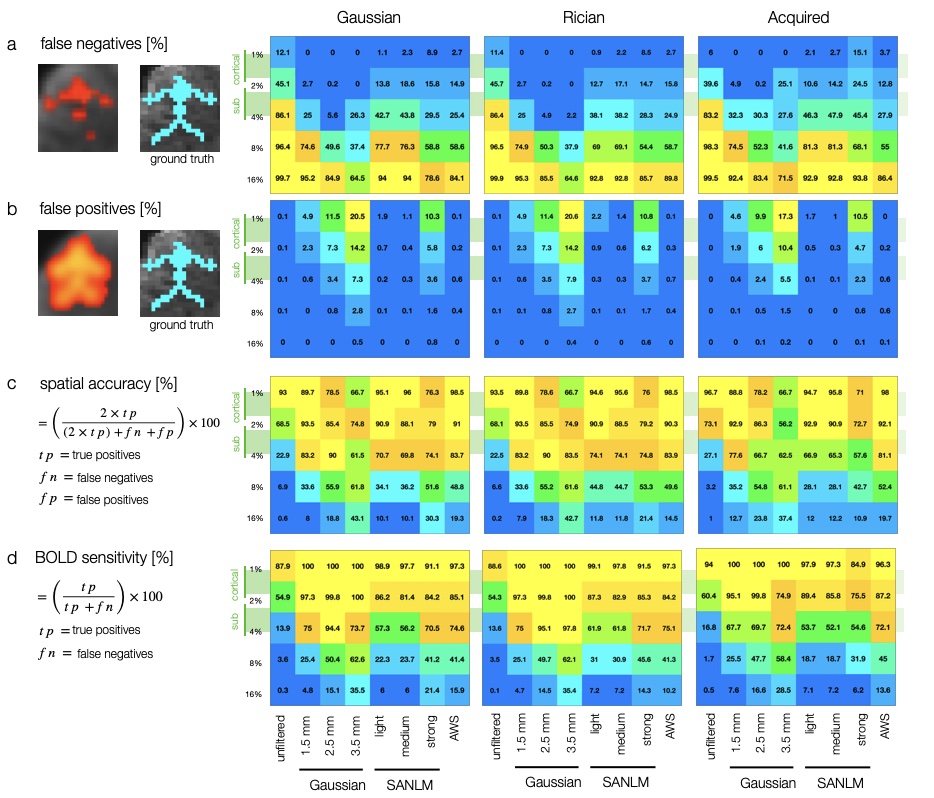
Metric results for across filters at distinct types and levels of noise. a) The number of false negatives (FN) increases with noise levels. b) Gaussian filters and SANLM strong intensity presented comparably higher false positives (FP) than the rest of the methods blurring of spatial details. c) The spatial accuracy for three types of noise depicts low values to the Gaussian kernels as a consequence of the inflated FP, and was highest for AWS. d) BOLD sensitivity was approximately similar across filters.
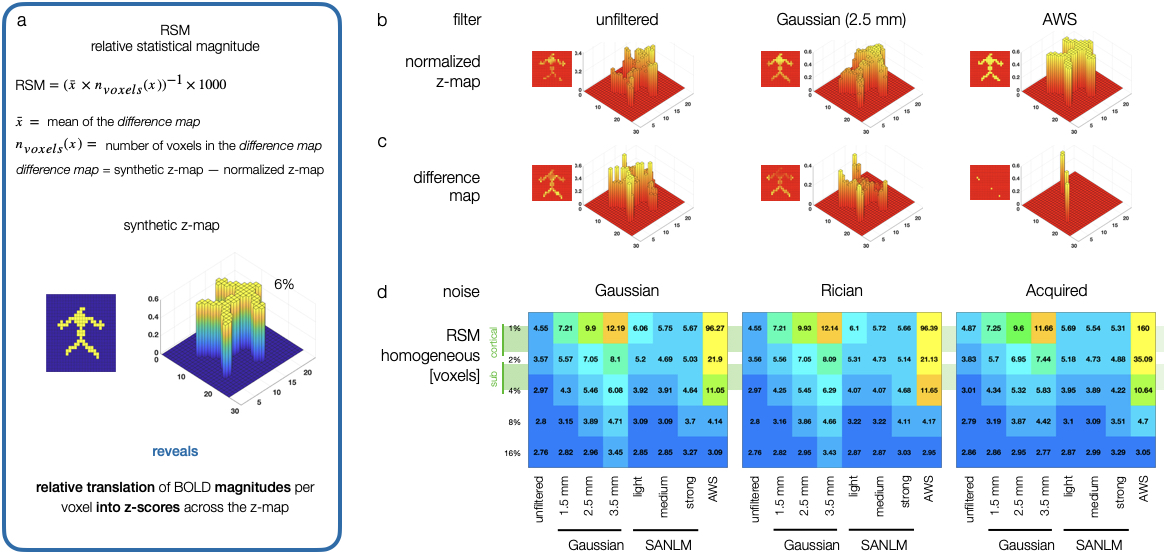
Relative statistical magnitude (RSM). a) RSM, defined to measure the preservation of relative magnitudes of z-scores, was employed as an additional metric to evaluate the actual likelihood of the underlying BOLD activations. AWS’s RSM scores are remarkably higher than the other filters.
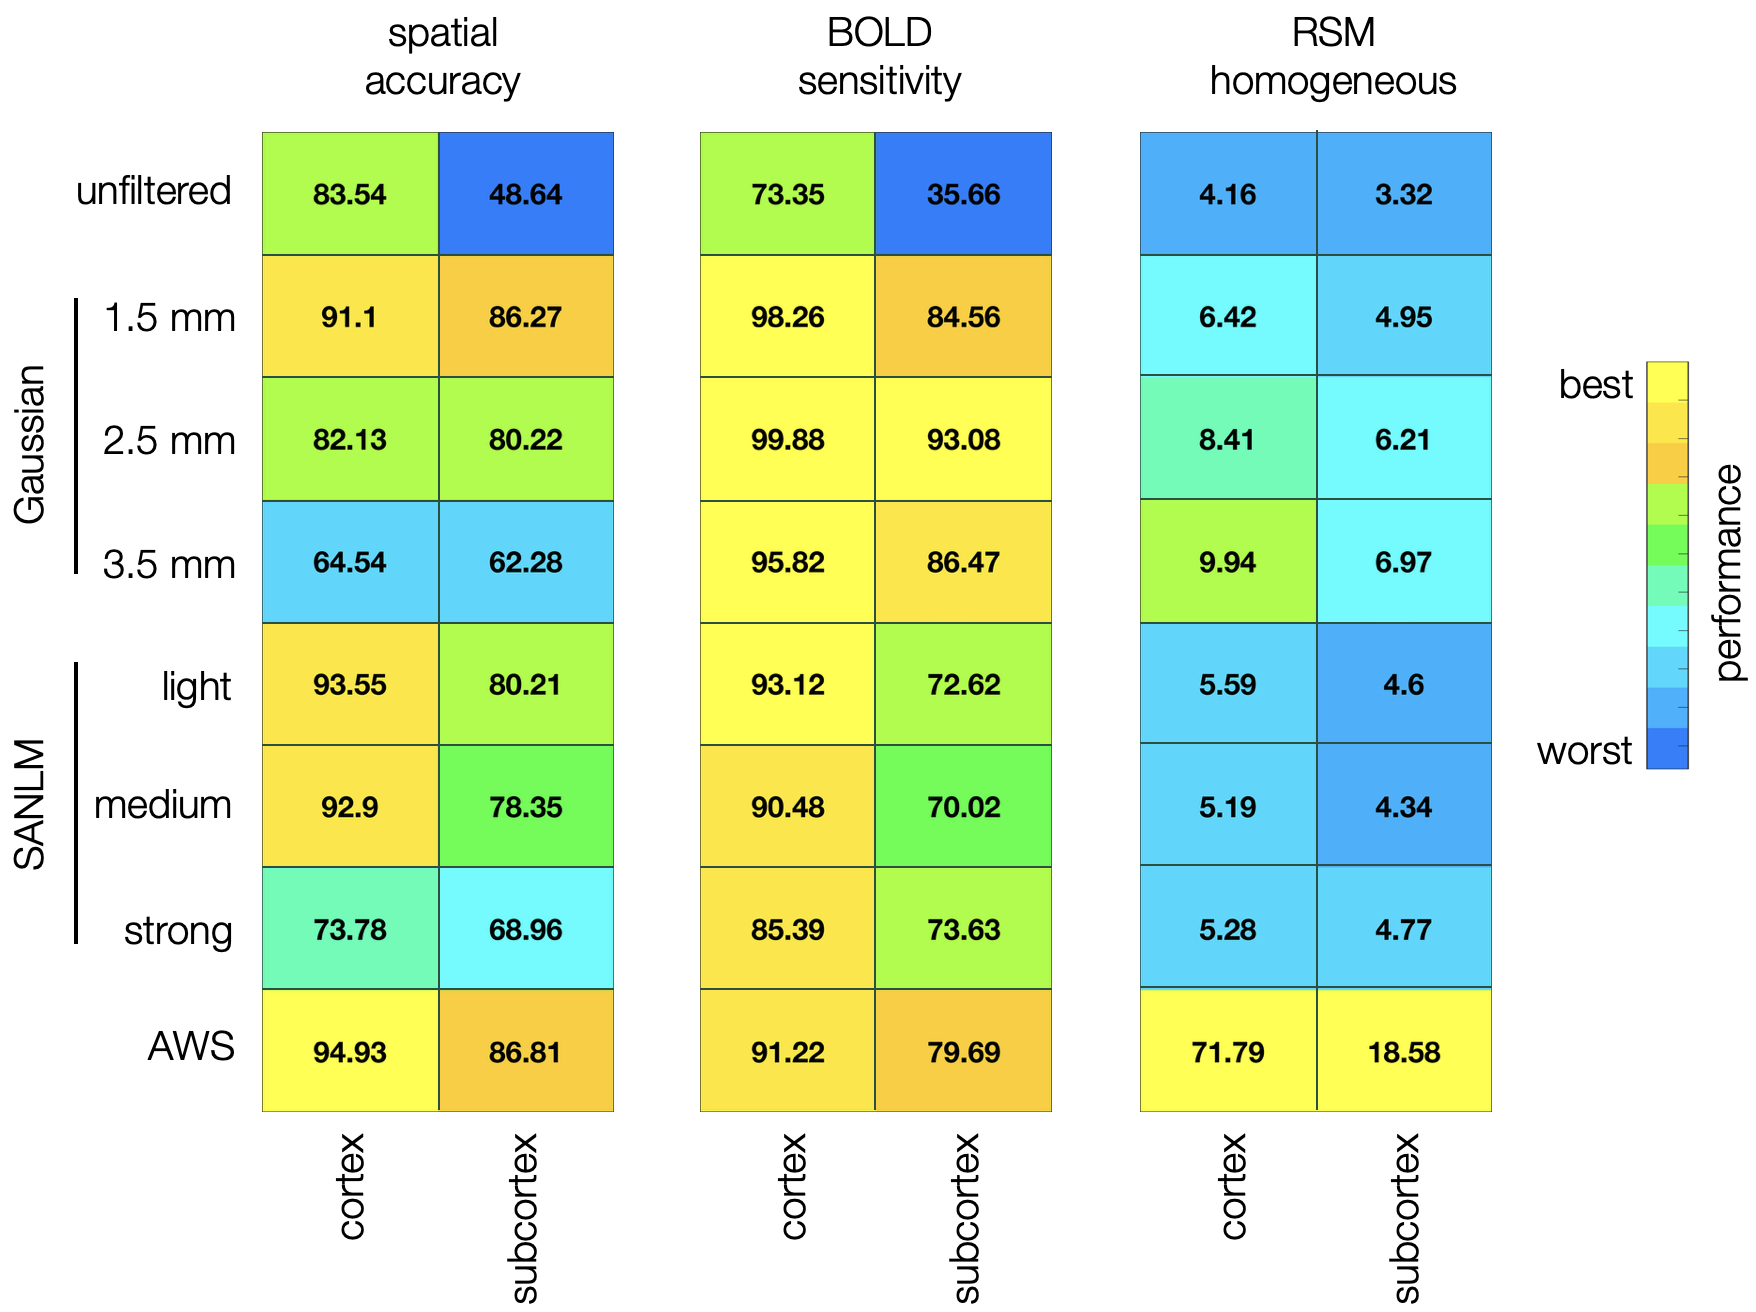
Overall performance of filters evaluated in the range of cortex and subcortex tSNR noise level. To summarize all results presented in figure 3, the values were averaged across all noise types and noise levels 1-2% (corresponding to cortical tSNR) and 2-4% (corresponding to subcortical tSNR). AWS had the best accuracy overall. Gaussian filters exhibited the highest BOLD sensitivities, followed by SANLM light and AWS. RSM was significantly higher for AWS, depicting the best magnitude fidelity to the BOLD activations.