1275
Data-driven analysis of echo planar time-resolved MRI suggests frequency-specific mechanisms of brain fluctuations with unique TE signatures1Georgia State University, Stone Mountain, GA, United States, 2Emory University, Atlanta, GA, United States, 3Harvard University, Combridge, MA, United States, 4Georgia State University, Atlanta, GA, United States
Synopsis
Keywords: fMRI (resting state), Brain
A novel analysis of EPTI rsfMRI to assess frequency contributions in unique echoes.Introduction
Evidence has shown that changing echo time (TE) in functional MRI (fMRI) sensitizes the MR signal to different physiological contributions. For example, conventional blood oxygen level dependent (BOLD) fMRI contrast peaks between echo times of 25 to 35 ms at 3T reflecting changes in T2 or T2* relaxation rate changes in response to a mismatch in CMRO2 and CBF during brain activation. Other types of fMRI data collection have previously been proposed, including Signal enhancement by extravascular water protons (SEEP) fMRI collected at short echo times, which is thought to be sensitive to changes in proton density weighting due to brain-activation-based cell swelling1. However, collecting a range of short, medium, and long TE time courses of resting fMRI data nearly simultaneously has been difficult until recently with the development of echo planar time-resolved imaging (EPTI)2. In the present report, we determine if short, medium, and long echo times may serve as complementary markers of brain activity using the signal characteristics of the 112 simultaneous EPTI resting fMRI time courses collected at 3T each with unique echo times between 5 and 60 ms.Methods
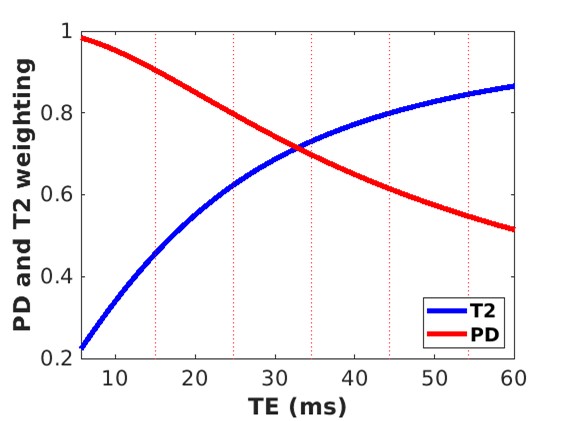
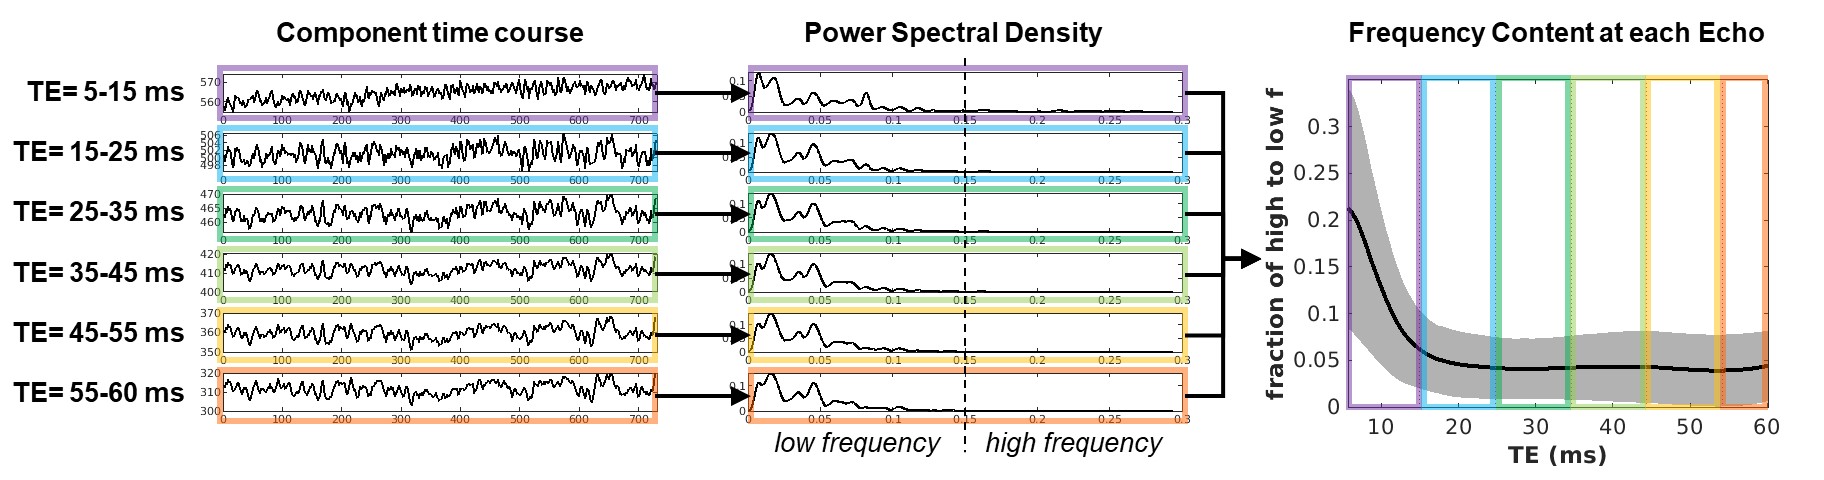
Simulation of the fluctuation contributions from proton density (PDw) and T2w changes were accomplished in Matlab by simulating random, independent, time courses for PD and T2 and then creating a combined time course using S(t,TE)=PD(t)*exp(-TE/T2(t)) for each of the 112 TE’s. Then cross-correlation between PD(t) and S(t,TE) provided the PD weighting at each echo, and cross-correlations between T2(t) and S(t,TE) provided the T2 weighting at each echo. For the data collection, 112 nearly simultaneous resting fMRI time courses were acquired at 3T with EPTI using a range of TE=5-60ms on three participants. Using spm12, the data was motion corrected, warped into MNI space, and smoothed with an 8mm kernel. Each participant’s 112 echoes were decomposed in GIFT3 using a spatially constrained group ICA framework4. Each component’s time course was further transformed into a power spectral density, followed by the computation of a ratio of high (0.15-0.3Hz) to low (0-0.149Hz) frequency bands to further inspect the frequency contribution at each echo.Results
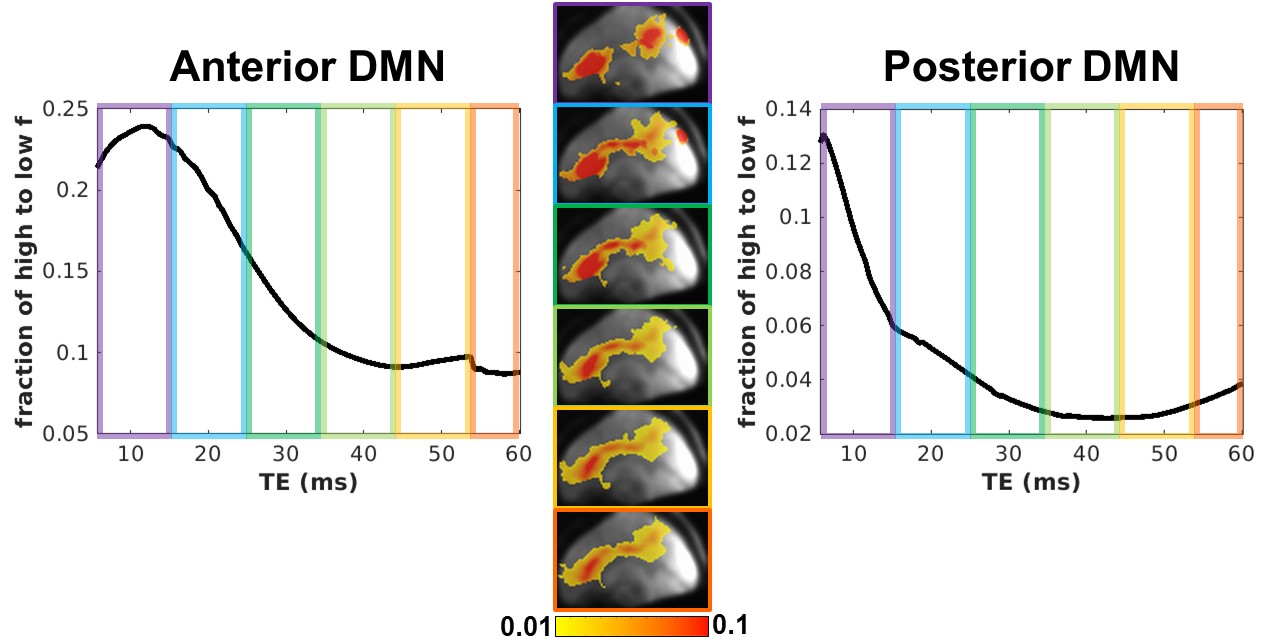
As expected, simulation results show that PD weighting is greatest at short echoes and that T2 weighting is greatest at longer echoes (Figure 1). PD and T2 have equal contributions to resting fluctuations at TE=32ms. The collected data shows that shorter echoes have a greater ratio of high-to-low frequency compared to longer echoes (Figure 2). On average, the high-frequency content resides in echoes less than 15ms. However, mapping the ratio of high to low frequency shows a spatial heterogeneity, where the frontal regions maintain more high-frequency content at longer echoes compared to posterior regions (Figure 3).Discussion
Theoretically, the shorter echoes contain more PD weighting, and empirically the shorter echoes contain more high-frequency content. Therefore, we speculate that the shorter echoes are sensitive to activation-related cell swelling, which may occur at higher frequencies than the sluggish, vascular-based T2 changes. Furthermore, the novel frequency based EPTI analysis shows regional anterior/posterior differences that may allow for the classification of differential physiological attributes across different brain regions.Conclusion
The range of short to long echoes collected virtually simultaneously with EPTI may help to improve the understanding of brain function and disease processes such as Alzheimer’s Disease with rich data sensitive to multiple physiological processes.Acknowledgements
No acknowledgement found.References
1 Figley, C. R., Leitch, J. K. & Stroman, P. W. In contrast to BOLD: signal enhancement by extravascular water protons as an alternative mechanism of endogenous fMRI signal change. Magn Reson Imaging 28, 1234-1243 (2010). https://doi.org:10.1016/j.mri.2010.01.005
2 Wang, F. et al. Echo planar time-resolved imaging (EPTI). Magn Reson Med 81, 3599-3615 (2019). https://doi.org:10.1002/mrm.27673
3 Calhoun, V. D., Adali, T., Pearlson, G. D. & Pekar, J. J. A method for making group inferences from functional MRI data using independent component analysis. Hum Brain Mapp 14, 140-151 (2001). https://doi.org:10.1002/hbm.1048
4 Du, Y. et al. NeuroMark: An automated and adaptive ICA based pipeline to identify reproducible fMRI markers of brain disorders. Neuroimage Clin 28, 102375 (2020). https://doi.org:10.1016/j.nicl.2020.102375
Figures