1273
Mapping Grey Matter Cerebrovascular Reactivity and Oxygen Consumption Using Resting-State BOLD-ASL Functional MRI1Neuroscience, Imaging and Clinical Sciences, University G. D'Annunzio of Chieti Pescara, Chieti Scalo, Italy, 2Department of Psychology, Cardiff University Brain Research Imaging Centre (CUBRIC), Cardiff, United Kingdom, 3School of Psychology, Cardiff University Brain Research Imaging Centre (CUBRIC), Cardiff, United Kingdom, 4University G. D'Annunzio of Chieti Pescara, Chieti Scalo, Italy, 5Cardiff University Brain Research Imaging Centre (CUBRIC), Cardiff, United Kingdom
Synopsis
Keywords: fMRI (resting state), Quantitative Imaging, Cerebrovascular Reactivity
BOLD and ASL CBF fMRI can measure cerebrovascular reactivity (CVR) following a vasodilatory stimulus such as hypercapnia. BOLD and ASL CVR measurements allow us to extract the maximum BOLD signal modulation from which, through biophysical modelling, OEF and CMRO2 can be inferred. We measured these physiological variables in grey matter by assessing the resting-state coupling between fMRI and end-tidal CO2 (reflecting arterial CO2) recordings. In-vivo evaluation of two, sequentially acquired, 14-min recordings at rest demonstrated the method’s good repeatability. This simplified calibrated fMRI approach does not require an exogenous hypercapnic stimulus and thus holds promise for future applications.Introduction
Calibrated functional MRI permits quantitative assessment of brain physiology1. Cerebrovascular reactivity (CVR), i.e., the ability of brain blood vessels to dilate and increase cerebral blood flow (CBF), may be assessed by measuring functional (f)MRI signal responses to a hypercapnic (increased CO2) stimulus2. CVR can be measured semi-quantitatively through BOLD sensitivity to deoxy-hemoglobin (dHb) (BOLD-CVR) or quantitatively in the grey matter (GM) by measuring CBF with ASL. The two CVRs can be estimated together with combined BOLD-ASL recordings to perform calibrated fMRI and infer the maximum BOLD modulation (M), which is proportional to baseline dHb3. We recently developed a calibrated fMRI approach that, by integrating the Davis Model of BOLD4 with a biophysical model of oxygen-transport from capillaries to mitochondria, allows estimation of oxygen extraction fraction (OEF) and the cerebral metabolic rate of oxygen (CMRO2) from a hypercapnia-based measurement of M5. This comprehensive approach requires a hypercapnic gas challenge or breath-holding, which limits its application in clinical settings. Here, we investigate the feasibility of inferring BOLD and ASL CVRs, as well as OEF and CMRO2, through coupled fluctuations in fMRI signal and end-tidal CO2 (reflecting arterial CO2) at rest.Methods
Twenty healthy volunteers (age: 27.5±3.8 years; 11/9 F/M) underwent resting-state fMRI. Data were acquired on a Siemens Prisma 3T scanner using a 32-channel receive-only head-coil. MPRAGE was acquired for anatomical reference (1mm-isotropic resolution, TR/TE = 2100/3.24ms). BOLD-ASL fMRI was acquired using pCASL with pre-saturation and background suppression and a dual-excitation (DEXI) readout6. The labelling duration and post label delay were set to 1.5s. EPI readout with GRAPPA acceleration (factor 3) was used with TE1=10ms and TE2=30ms. The latter TE was used for BOLD signal evaluation. An effective TR of 4.9s was implemented to record 16 slices with a slice thickness of 7mm, 20% slice gap and 3.4mm in-plane resolution. A total of 350 tag-control pairs were acquired over 28min, together with an ASL calibration image (M0), acquired separately. Expired CO2 and O2 traces were recorded using a nasal cannula and a gas analyser (AD Instruments). End-tidal CO2 and O2 were extracted and resampled to match the fMRI. MRI data were analyzed using FSL7. Motion-corrected fMRI time-courses (FSL McFLIRT) and tissue partial volume maps (FSL FAST) were coregistered to the M0 volume. ASL control-tag difference were converted to CBF through voxel-wise M0 normalization and adopting the single compartment kinetic model8. The following processing was computed separately for the first and the last 14 minutes of the recording. Average BOLD and CBF maps were extracted and relative signal fluctuations computed. To focus on frequencies with a strong coupling between fMRI and end-tidal CO2 modulations, the fMRI and CO2 signals were band-pass filtered between 0.02 and 0.04 Hz9. BOLD-CVR and CVR maps were estimated through voxel-wise regression of BOLD and ASL signals on end-tidal CO2 traces, respectively. Average GM (partial volume estimate>50%) values were extracted for CBF, and for BOLD-CVR and CVR by considering GM voxels with significant correlations of end-tidal CO2 with BOLD and ASL signals, respectively (p<0.05, uncorrected). Average GM OEF and CMRO2 were computed by using average GM CBF, BOLD-CVR and CVR5. Arterial partial pressure of oxygen was inferred from O2 recordings. Hemoglobin in blood and oxygen tension at the mitochondria were assumed to be 14 g/dl and 10 mmHg, respectively. Refer to 5 for further information on modelling.Results
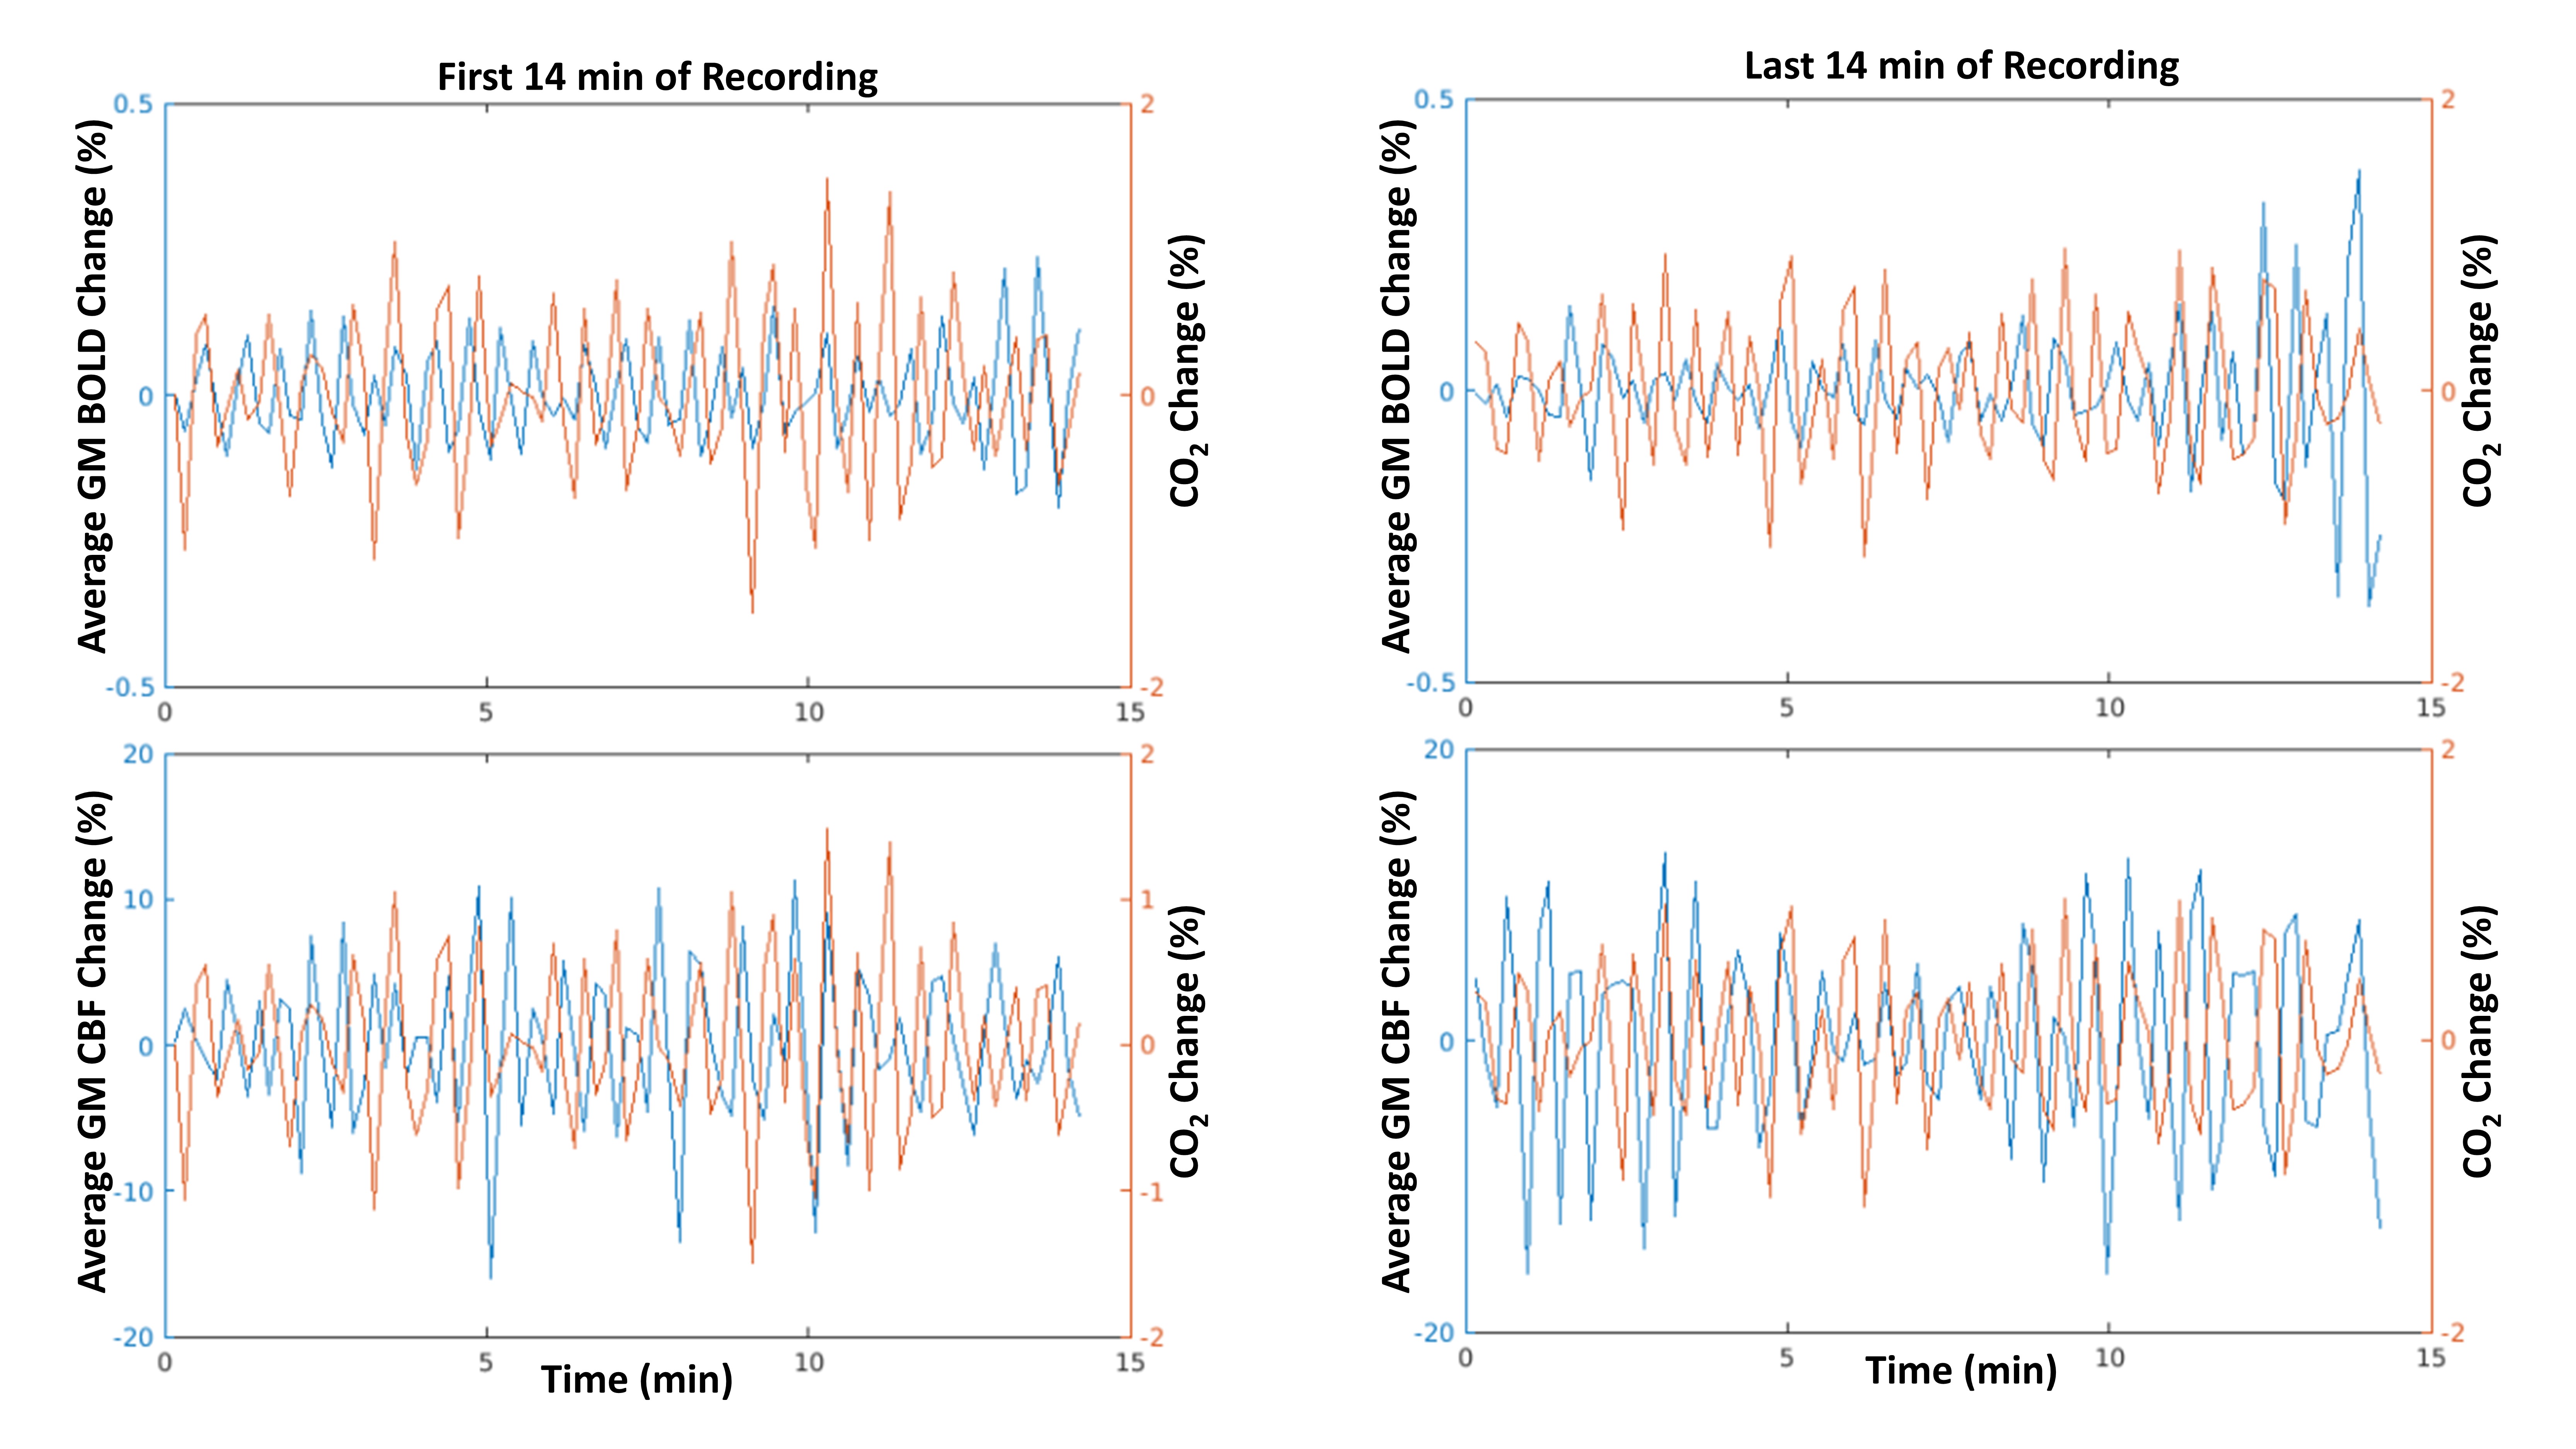
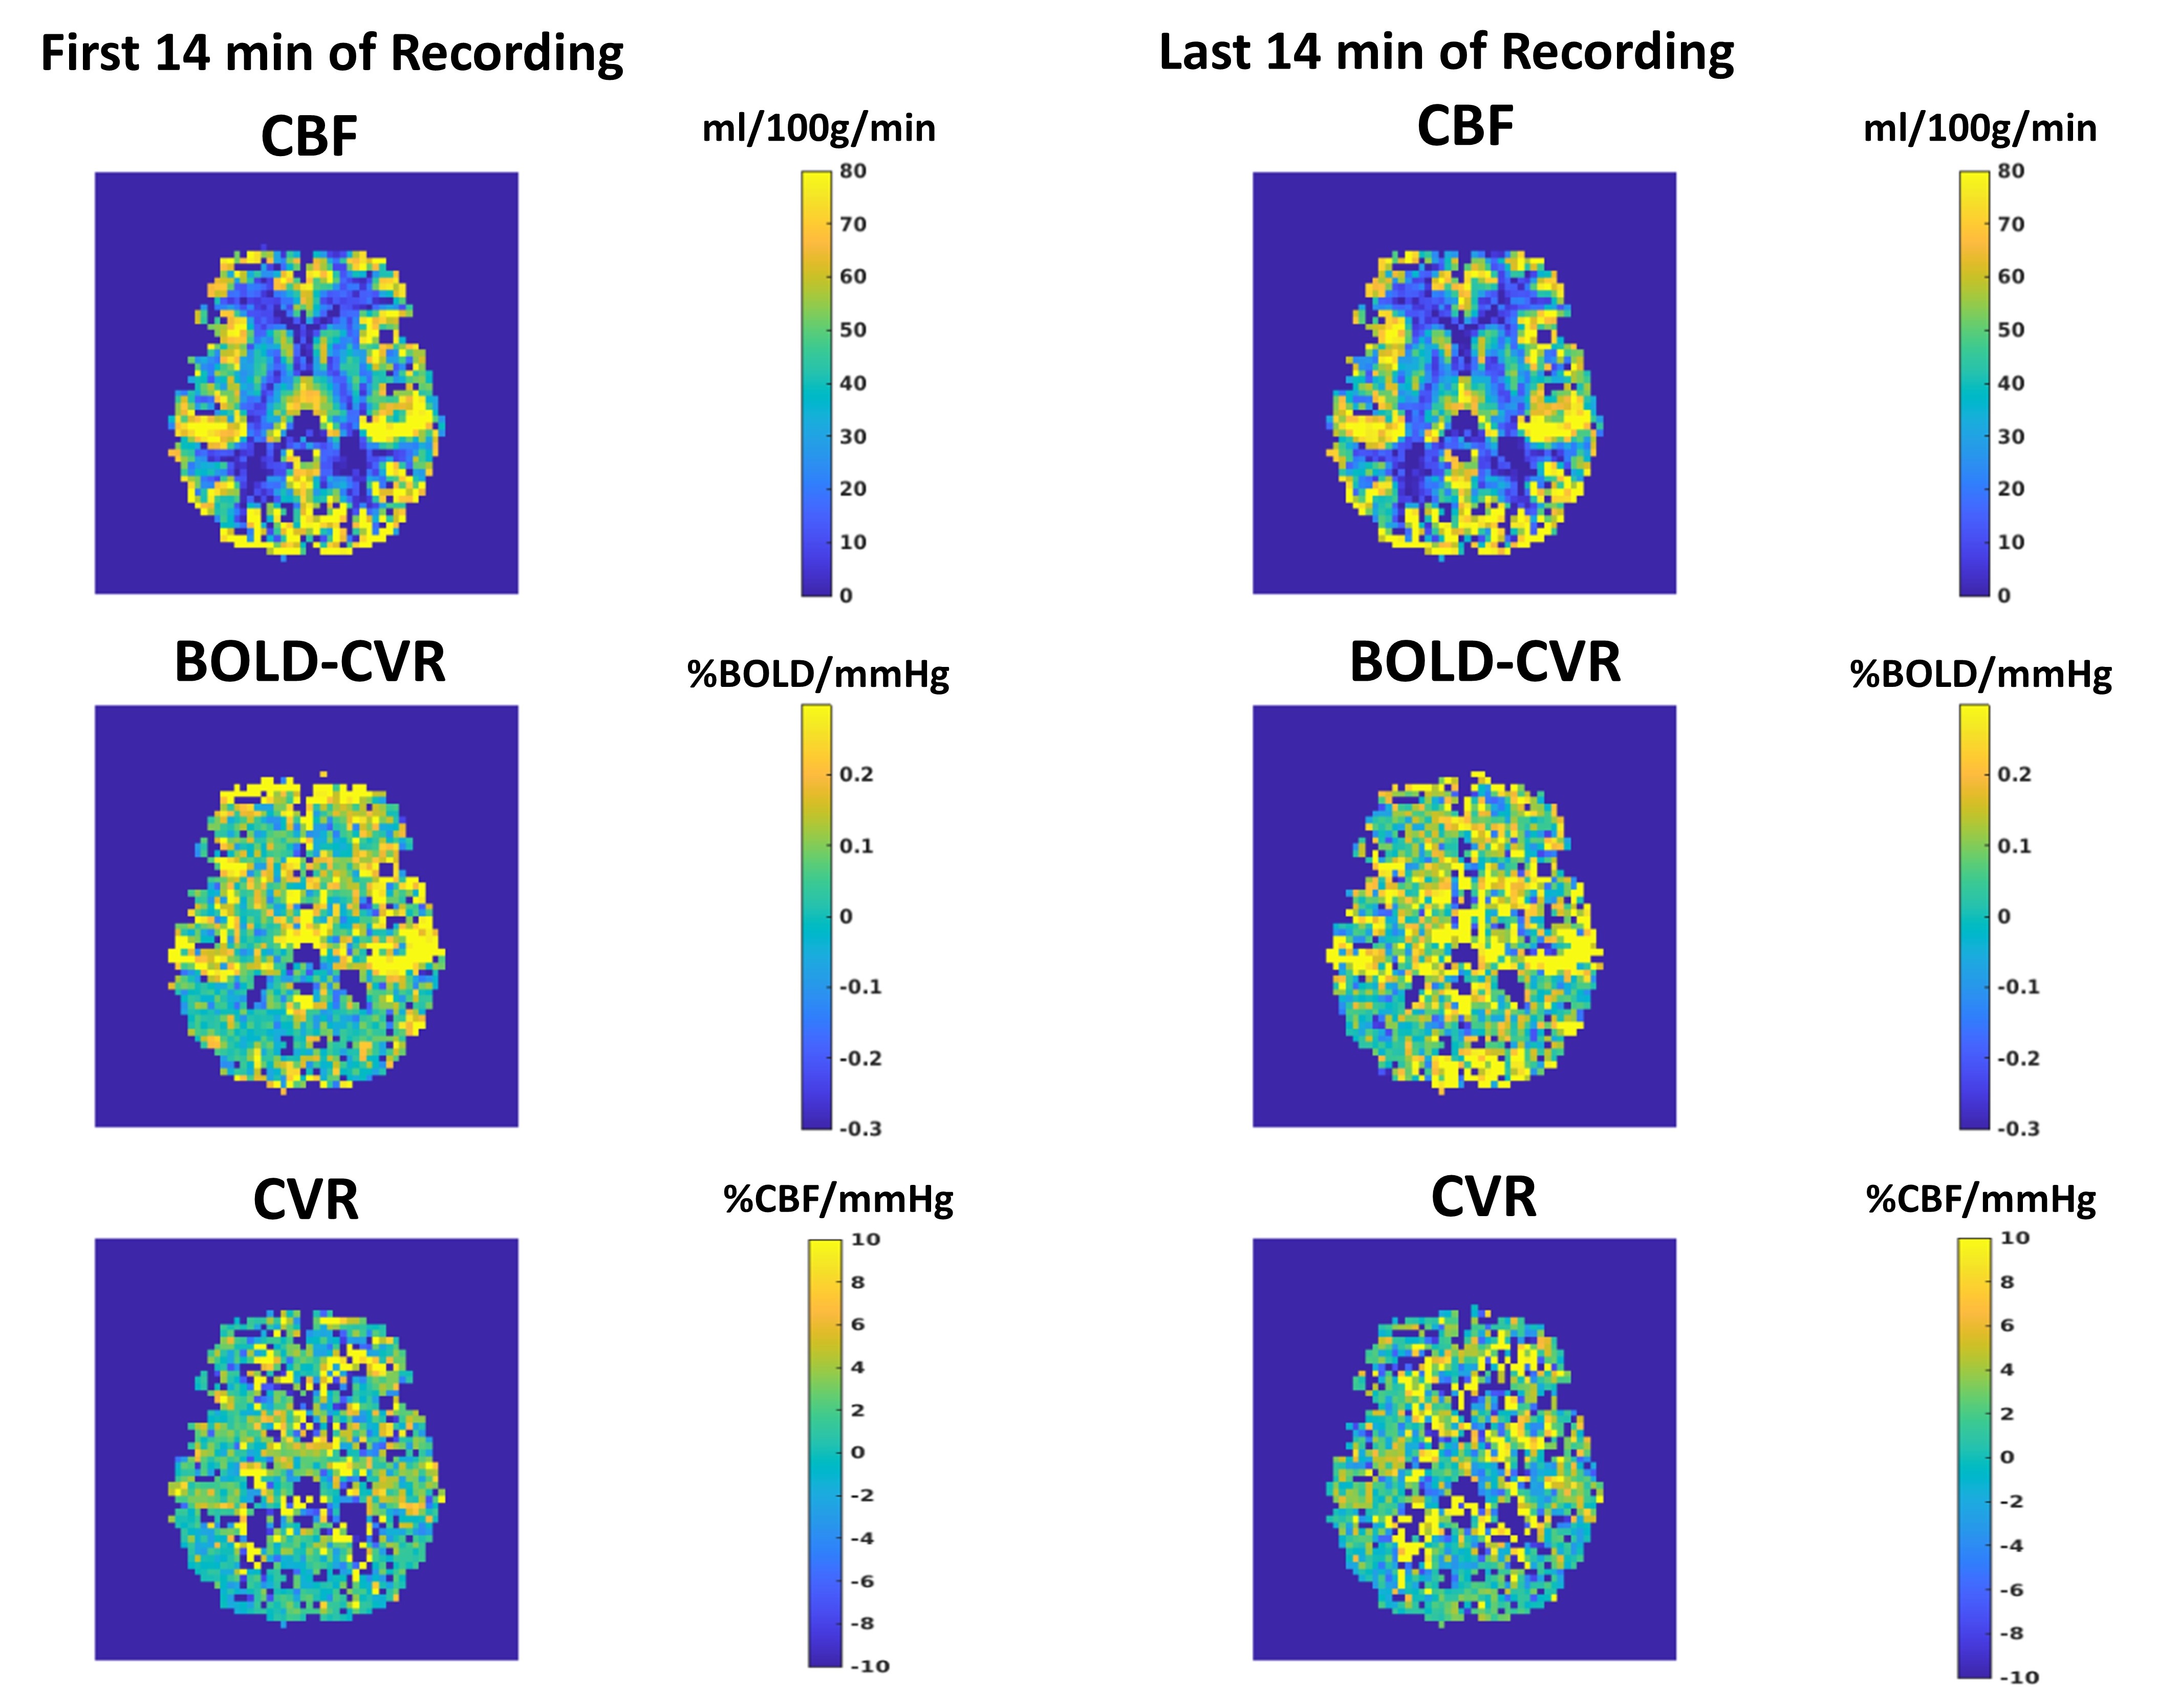
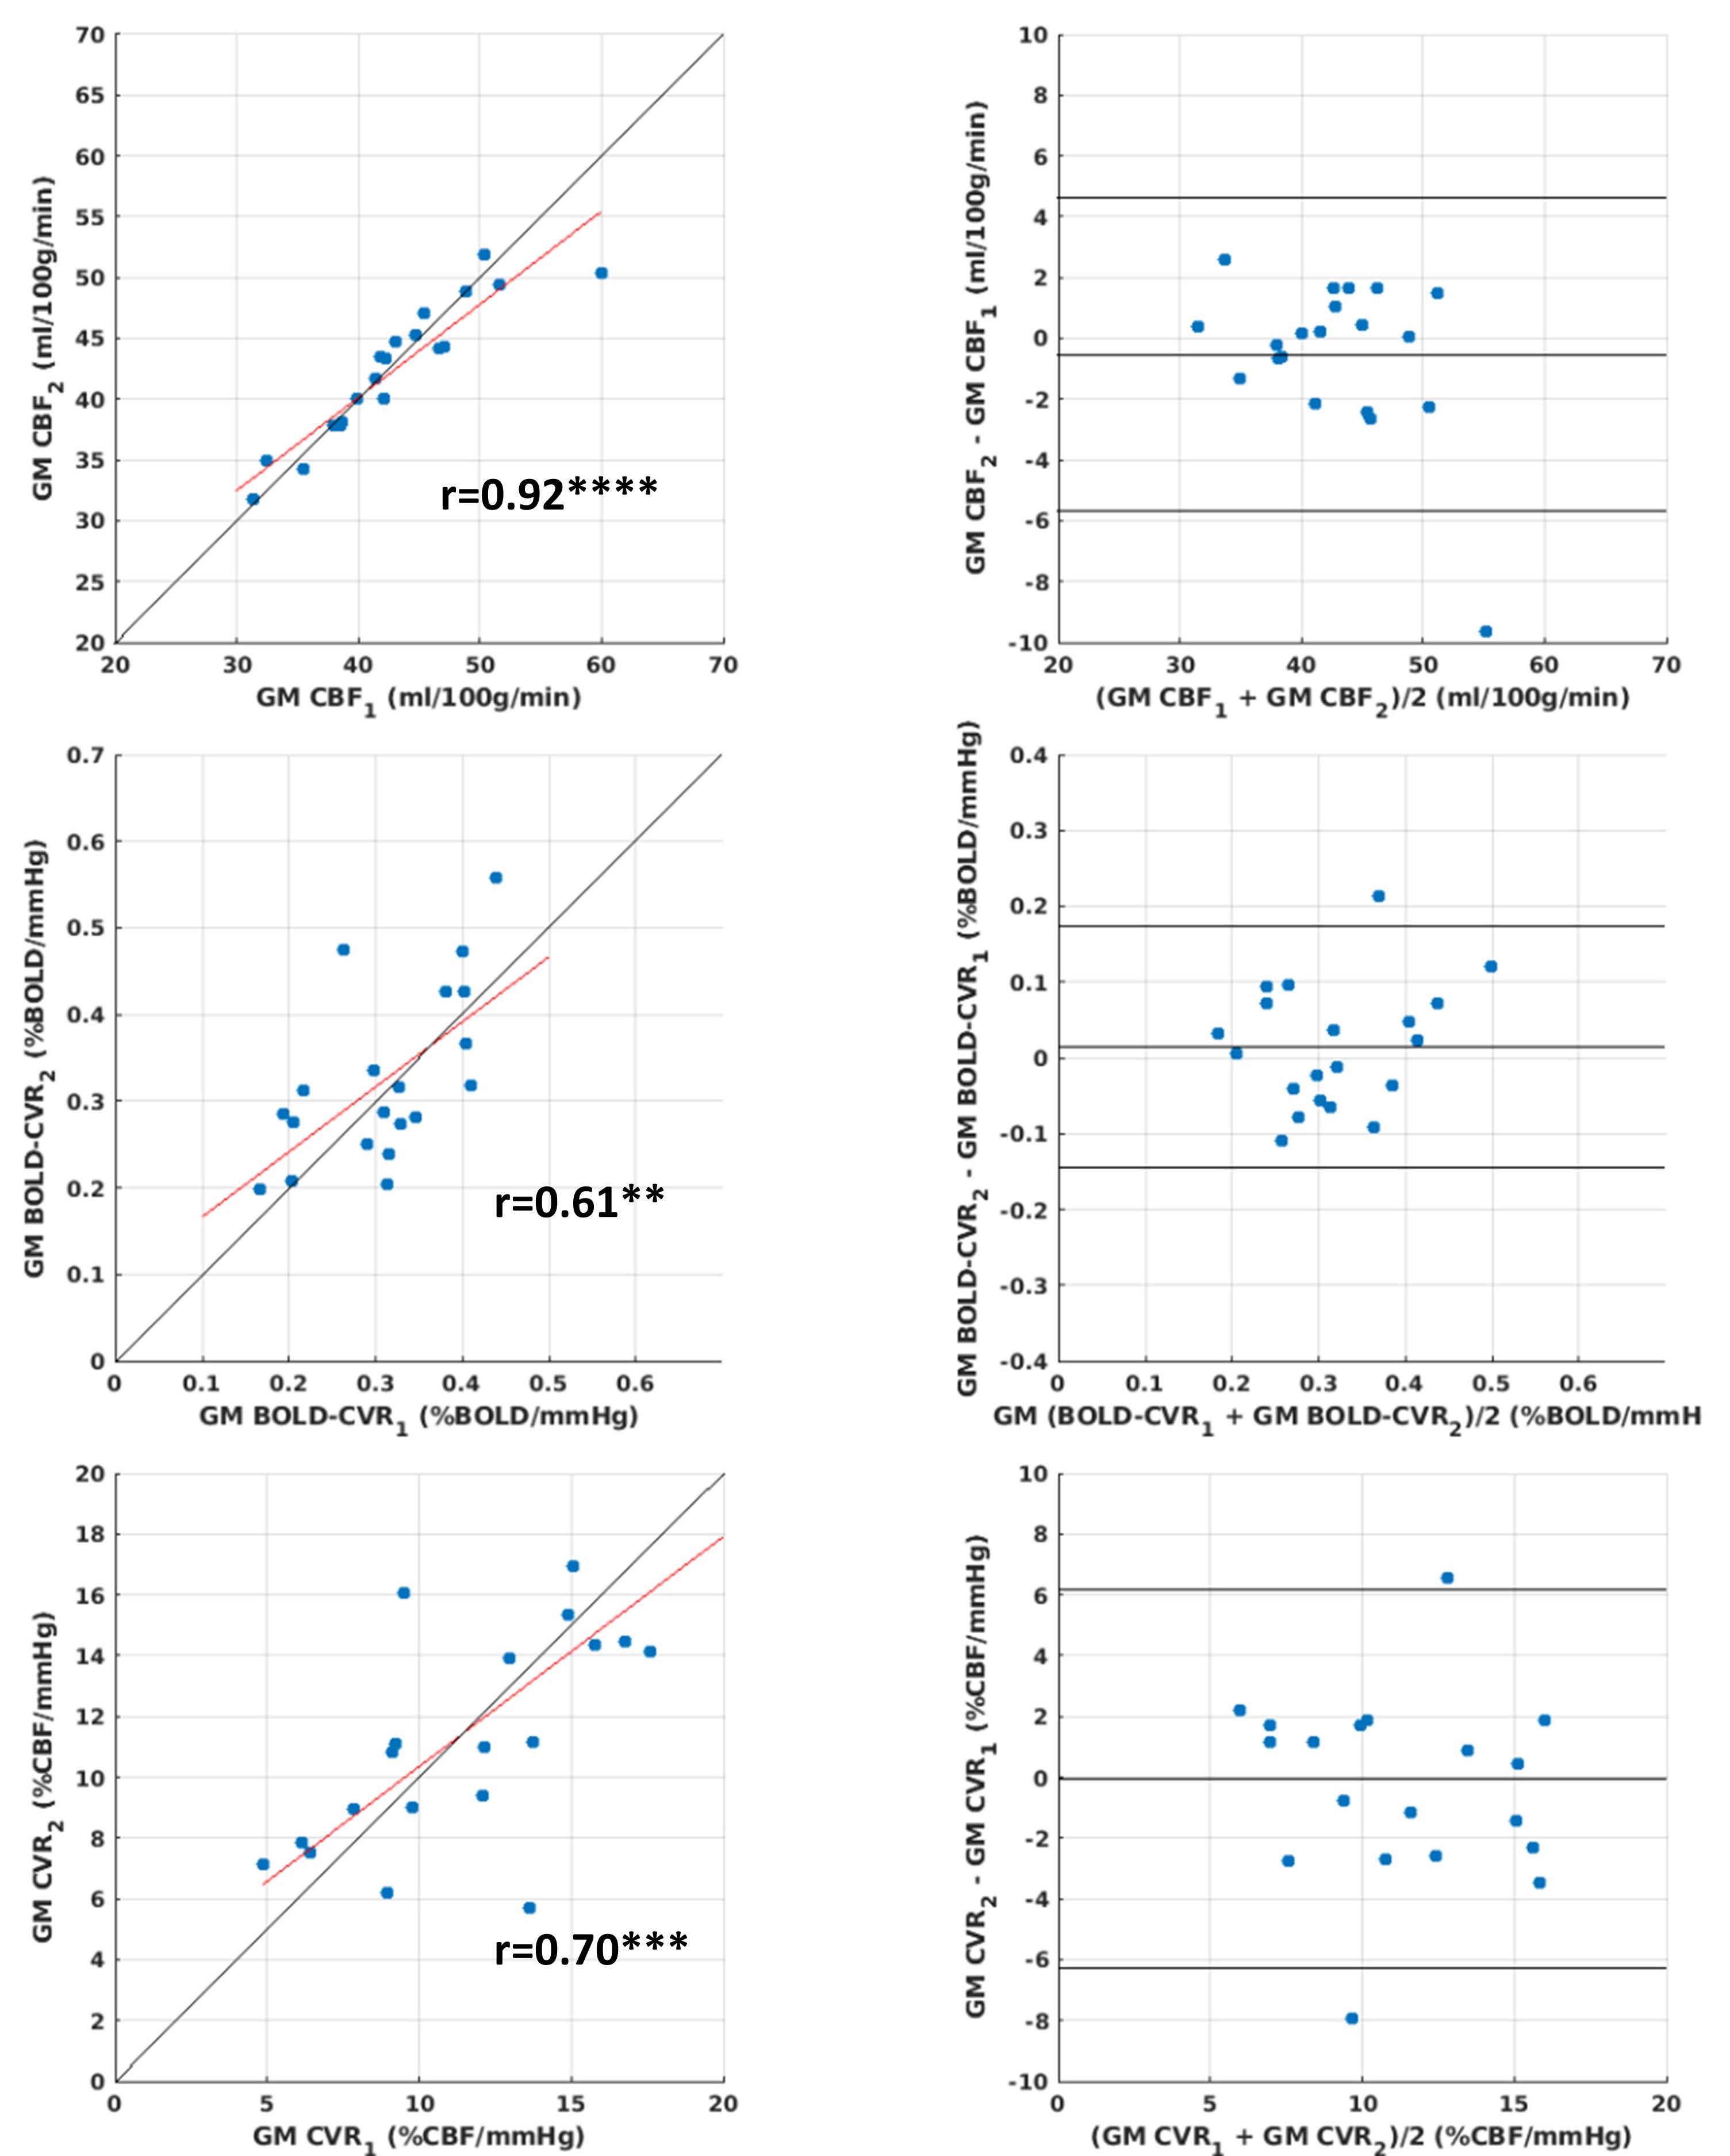
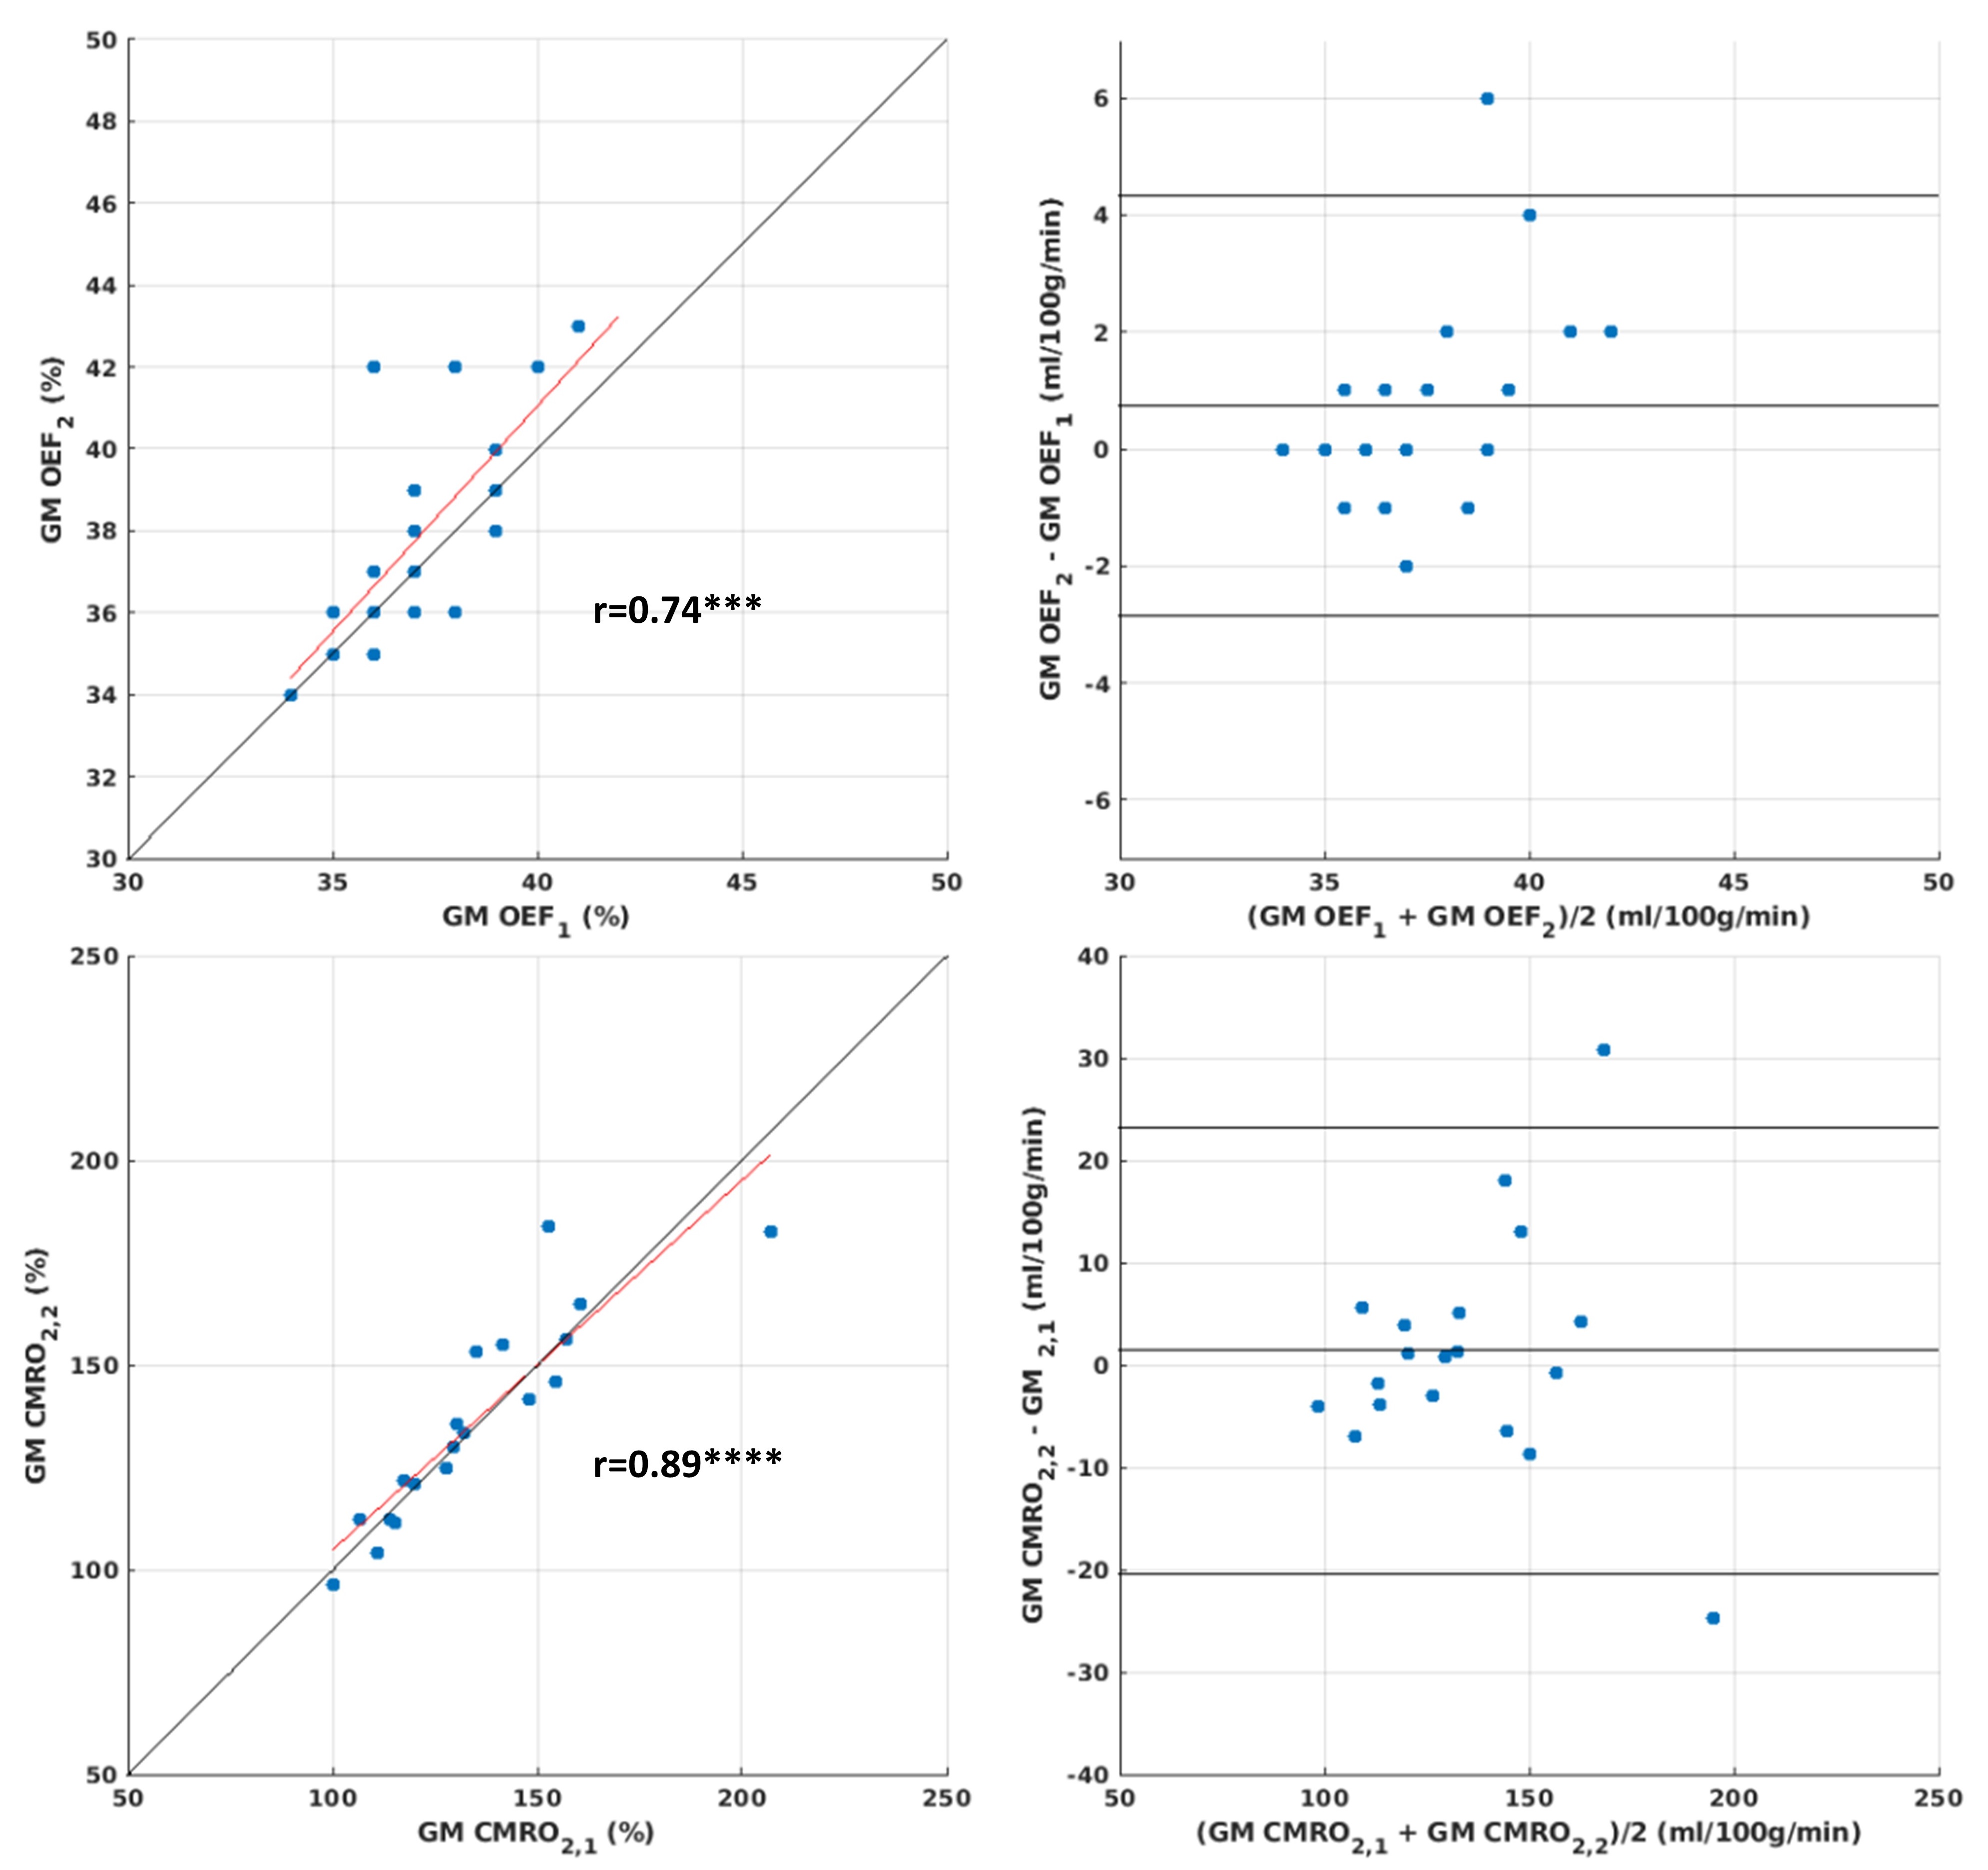
Figure 1 reports an example of filtered end-tidal CO2 traces together with average GM BOLD and ASL signal fluctuations for the first and the last 14 minutes of recording. Figure 2 shows an example of baseline CBF, BOLD-CVR and CVR maps for the first and the last 14 minutes of recording. The maps computed from the two different time intervals are similar. The repeatability assessment of average GM CBF, BOLD-CVR and CVR and of average GM OEF and CMRO2, are summarized in Figure 3 and Figure 4, respectively. The results suggest that the method delivers plausible values for the metrics of interest and good repeatability. The scatterplots (left column) show strong associations (all p’s<0.01) and the Bland and Altman plots show random differences with their average not significantly different from 0 (all p’s>0.05).Discussion and Conclusion
Results support the feasibility of the resting-state evaluation of the physiological variables of interest, i.e. BOLD-CVR, CVR, OEF and CMRO2. Of note, differently from BOLD-CVR, ASL average GM CVR, and hence average OEF and CMRO2, were found to be reliable only when considering voxels with significant coupling between end-tidal CO2 traces and the ASL signals (p<0.05) on a 14 minute recording timescale. This result plausibly reflects the limited signal to noise ratio intrinsic to the ASL technique. An evaluation of the accuracy of the approach through comparison with an alternative technology is warranted. Resting-state evaluation of baseline BOLD and ASL CVRs, as well as of OEF and CMRO2, seems feasible and the simplified approach, not requiring exogenous gas challenges, holds promise for clinical application.Acknowledgements
This work was partially conducted under the framework of the Departments of Excellence 2018–2022 initiative of the Italian Ministry of Education, University and Research for the Department of Neuroscience, Imaging and Clinical Sciences (DNISC) of the University of Chieti-Pescara, Italy.
Wellcome Ph.D. studentship supported E.P. for data collection.
References
1 Germuska M, Wise RG. Calibrated fMRI for mapping absolute CMRO2: Practicalities and prospects. NeuroImage 2019; 187: 145–153.
2 Liu P, De Vis JB, Lu H. Cerebrovascular reactivity (CVR) MRI with CO2 challenge: A technical review. NeuroImage 2019; 187: 104–115.
3 Bulte DP, Kelly M, Germuska M, Xie J, Chappell MA, Okell TW et al. Quantitative measurement of cerebral physiology using respiratory-calibrated MRI. NeuroImage 2012; 60: 582–591.
4 Buxton RB. Introduction to Functional Magnetic Resonance Imaging: Principles and Techniques. Cambridge University Press, 2009.
5 Chiarelli AM, Germuska M, Chandler H, Stickland R, Patitucci E, Biondetti E et al. A flow-diffusion model of oxygen transport for quantitative mapping of cerebral metabolic rate of oxygen (CMRO2) with single gas calibrated fMRI. J Cereb Blood Flow Metab 2022; 42: 1192–1209.
6 Schmithorst VJ, Hernandez-Garcia L, Vannest J, Rajagopal A, Lee G, Holland SK. Optimized Simultaneous ASL and BOLD Functional Imaging of the Whole Brain. J Magn Reson Imaging JMRI 2014; 39: 1104–1117.
7 Jenkinson M, Beckmann CF, Behrens TEJ, Woolrich MW, Smith SM. FSL. NeuroImage 2012; 62: 782–790.
8 Alsop DC, Detre JA, Golay X, Günther M, Hendrikse J, Hernandez-Garcia L et al. Recommended implementation of arterial spin-labeled perfusion MRI for clinical applications: A consensus of the ISMRM perfusion study group and the European consortium for ASL in dementia. Magn Reson Med 2015; 73: 102–116.
9 Liu P, Li Y, Pinho M, Park DC, Welch BG, Lu H. Cerebrovascular reactivity mapping without gas challenges. NeuroImage 2017; 146: 320–326.
Figures