1272
Multi-echo, multi-contrast functional activation: validation of combined spin- and gradient-echo EPI in fMRI1Barrow Neurological Institute, Phoenix, AZ, United States, 2Arizona State University, Tempe, AZ, United States, 3Hyperfine, Inc., Guilford, CT, United States, 4MD Anderson Cancer Center, Houston, TX, United States
Synopsis
Keywords: Data Acquisition, fMRI (task based), Neuro, multi-echo, multi-contrast, EPI
Standard functional MRI (fMRI) suffers from susceptibility-induced dropout near air-tissue interfaces and is sensitive to larger vessels. Conversely, a combined spin- and gradient-echo (SAGE) acquisition can provide sensitivity to functional activation across macro- and microvascular scales with reduced signal dropout. Multi-echo analysis of SAGE-fMRI data was performed by using quantitative and relaxation-weighted T2* and T2. In a task-based experiment, SAGE relaxation-weighted analyses showed increased contrast- and temporal signal-to-noise ratios (CNR and tSNR, respectively), especially for microvascular analysis. SAGE-fMRI provides improvements over standard fMRI in image quality and robustness of functional activation, as well as inclusion of microvascular sensitivity.Introduction
Functional MRI (fMRI) is used to map fluctuations in brain activity via sensitivity to the blood-oxygen-level dependent (BOLD) effect. However, fMRI acquired with a gradient-echo (GRE) acquisition with echo-planar imaging (EPI) readout suffers from susceptibility-induced dropout near air-tissue interfaces and is more sensitive to larger vessels1,2. Spin-echo (SE) EPI is less sensitive to BOLD but has improved spatial localization of neuronal activation due to microvascular specificity, as well as the ability to refocus susceptibility-induced signal dropouts3. A combined spin- and gradient-echo (SAGE) acquisition4,5 may be able to overcome some of the challenges with standard fMRI and provide a muti-contrast analysis across macro- and microvascular scales. The present study aimed to assess task-based SAGE-fMRI analyses in comparison to GRE and SE methods.Methods
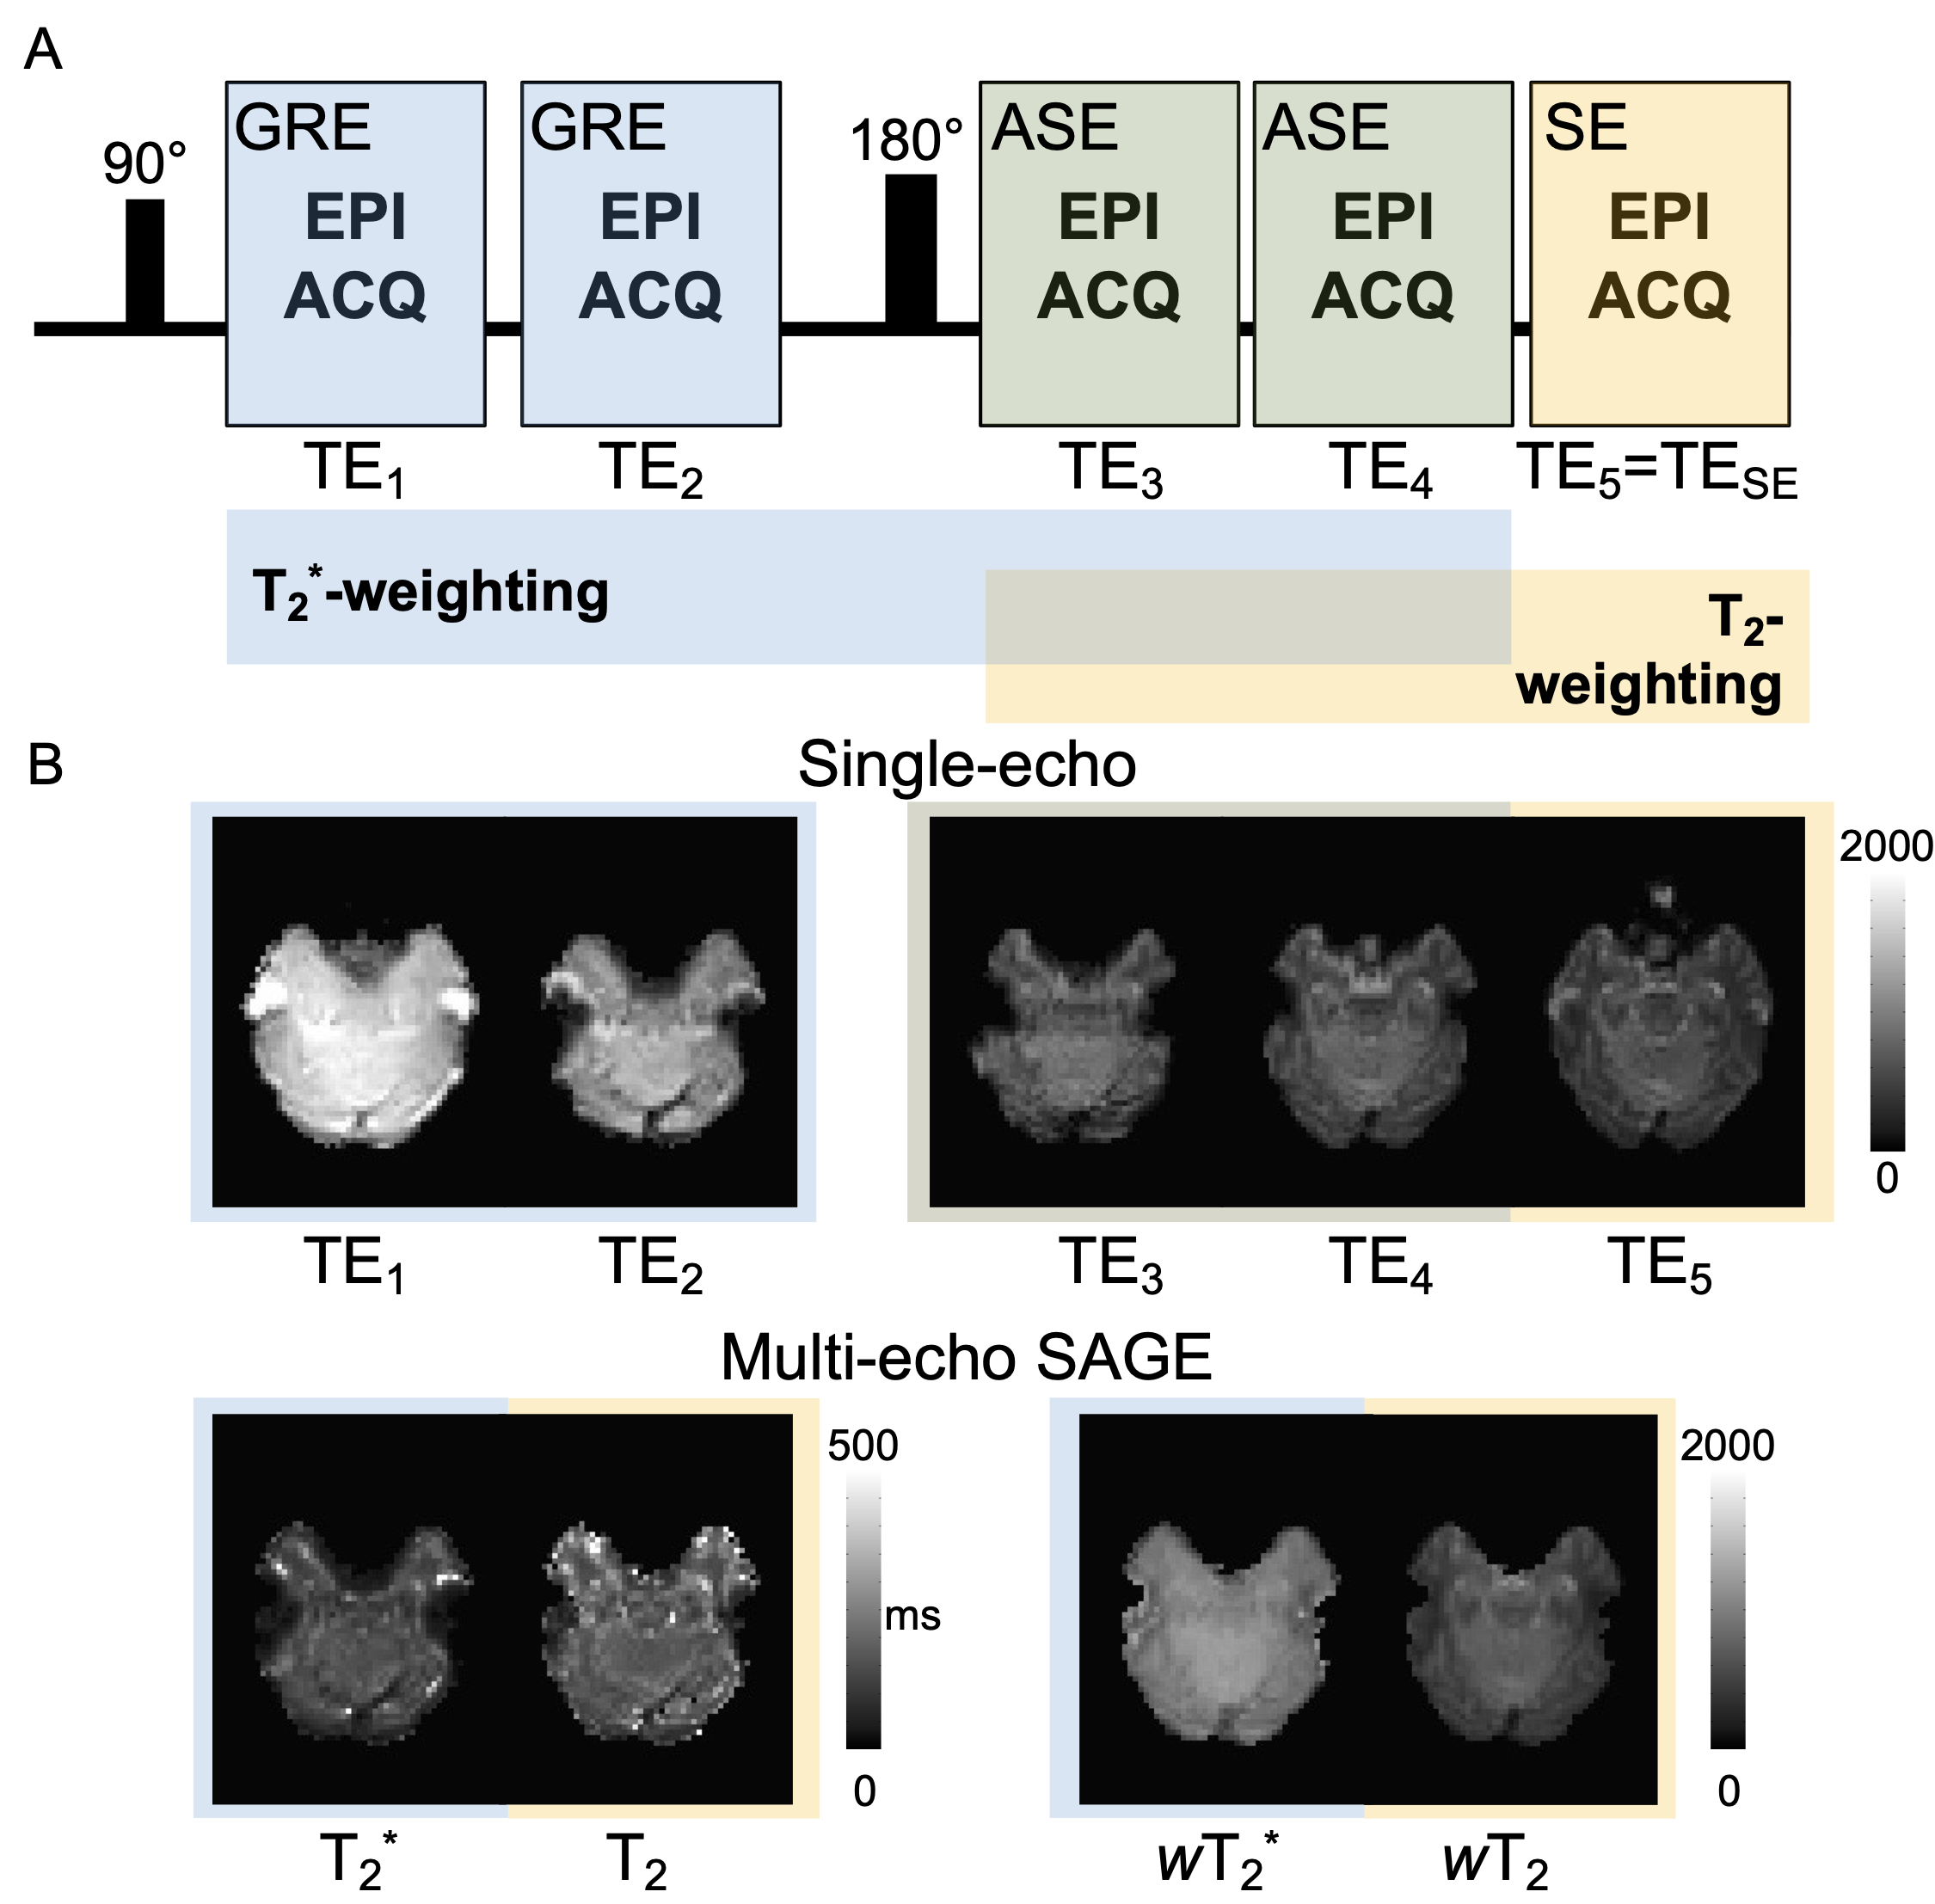
The standard SAGE sequence includes five echoes - two GRE, two asymmetric spin-echoes (ASE), and one SE (Figure 1) - with varying sensitivity to relaxation times T2* and/or T2 (=1/R2* and =1/R2, respectively)5. For multi-GRE sequences, previous studies have shown the benefit of weighting the signal by the measured relaxation rate, which is effectively the relative contribution to BOLD contrast1,6. The relative relaxation-weighting factors for T2* and T2 (wT2* and wT2, respectively) as a function of echo time (TE) are given by:$$w_{T_2^*}(TE)=\begin{cases}TE∙exp[-TE∙R_2^*] & 0<TE<\frac{{TE_{SE}}}{2}\\(TE_{SE}-TE)∙exp[-TE_{SE}(R_2^*-R_2 )-TE(2R_2-R_2^*)] & \frac{{TE_{SE}}}{2}<TE<TE_{SE}\end{cases}[1]$$
$$w_{T_2}(TE)=\begin{cases}0 & 0<TE<\frac{{TE_{SE}}}{2}\\(2TE-TE_{SE})∙exp[-TE_{SE}(R_2^*-R_2 )-TE(2R_2-R_2^* )] & \frac{{TE_{SE}}}{2}<TE<TE_{SE}\end{cases}[2]$$
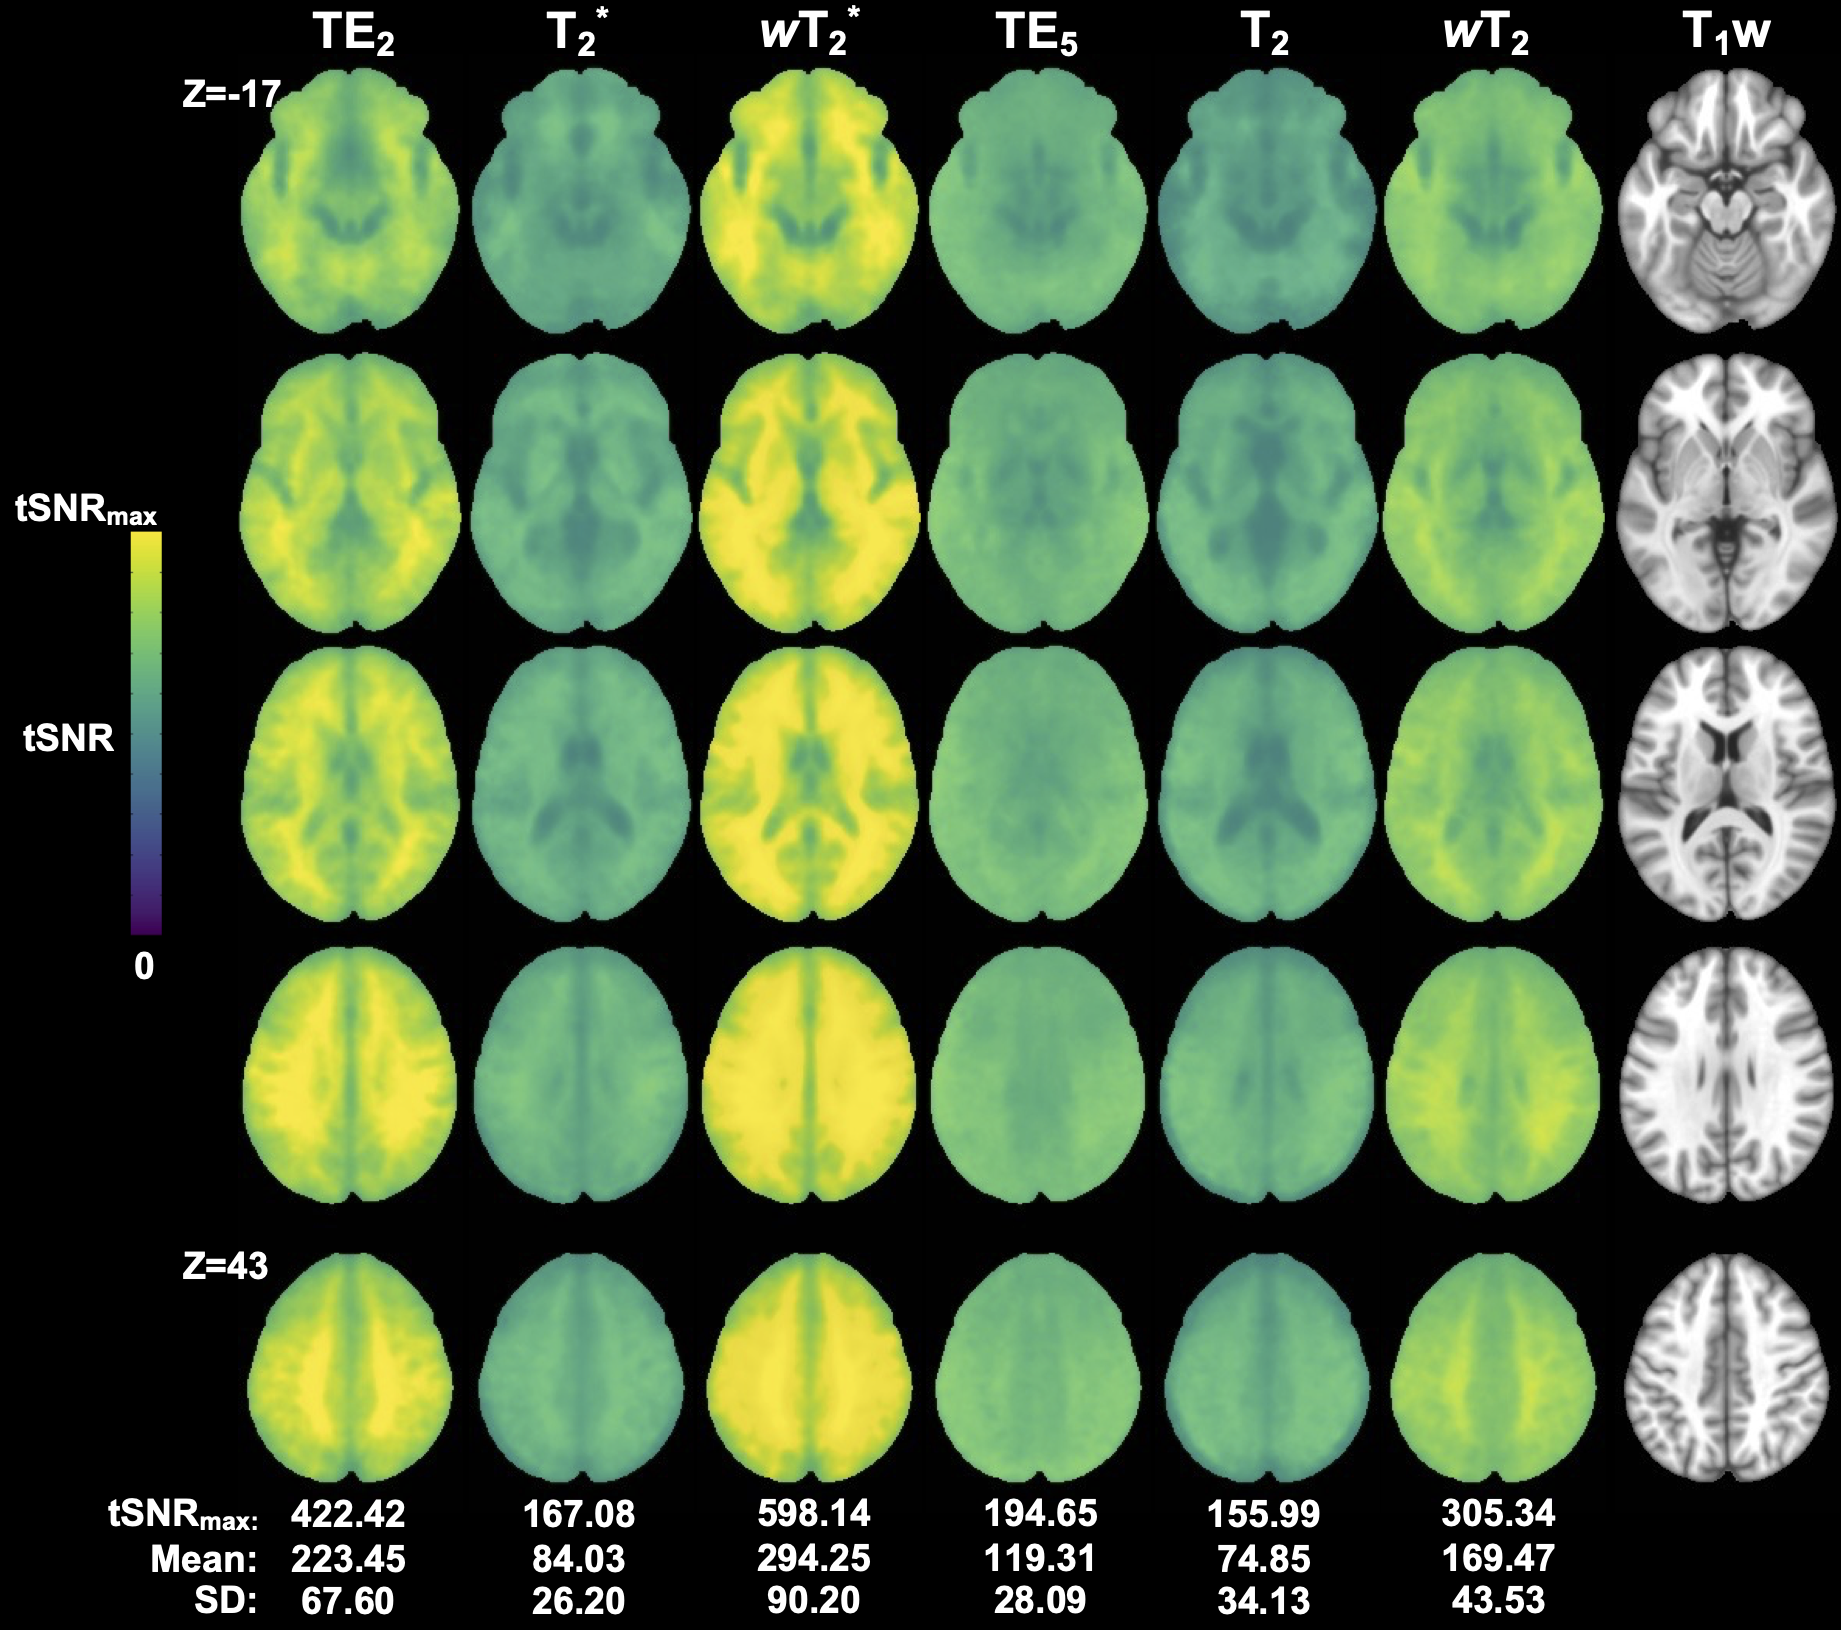
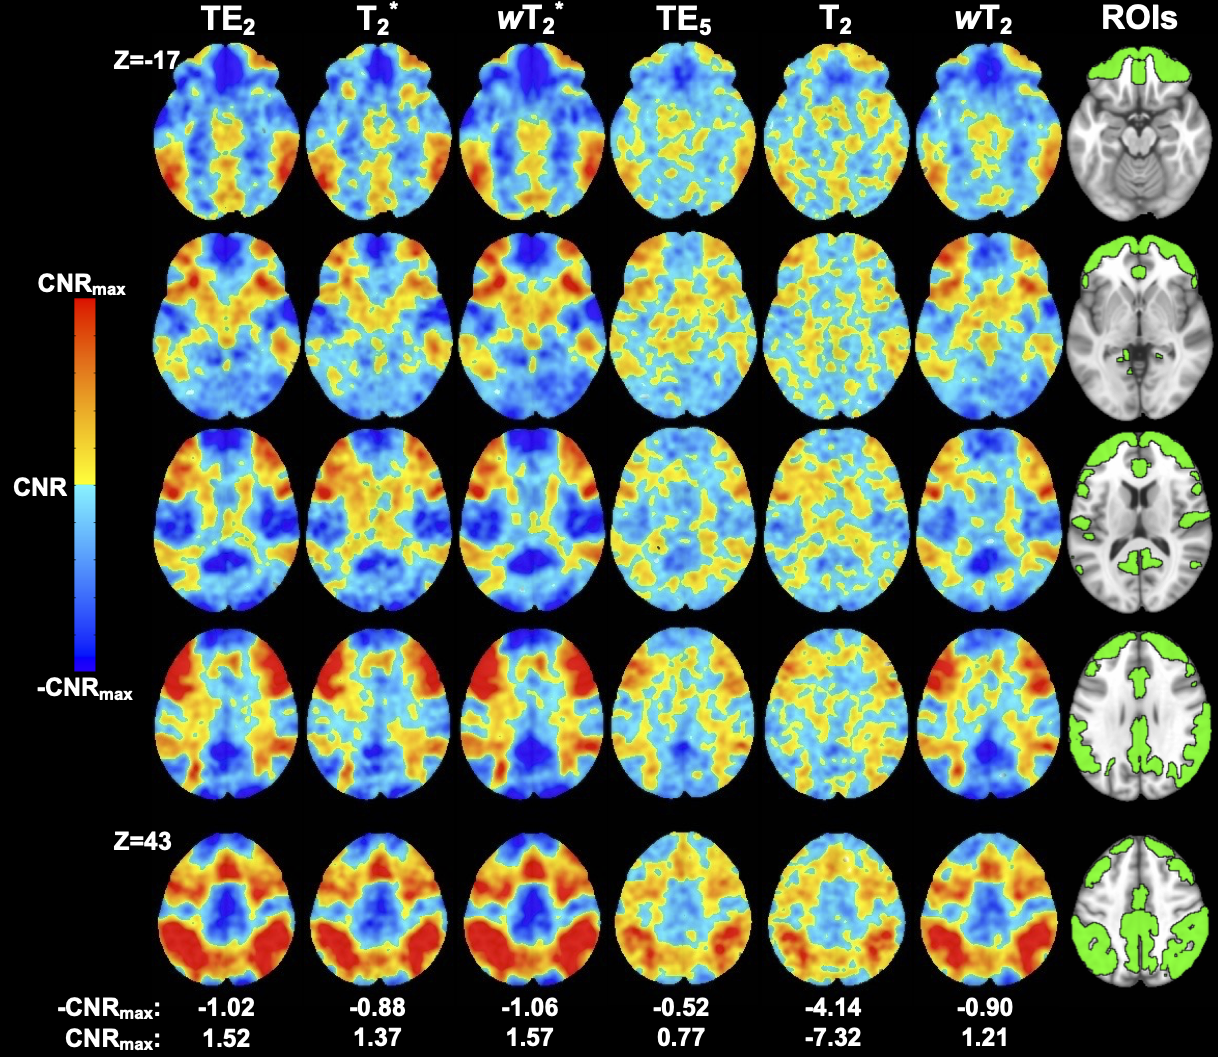
For simplicity, the signal intensities and normalization factors have been omitted. Data were acquired in healthy subjects (n=15, 24.4±2.6 years old, 5 males) at 3T (Ingenia, Philips) with a 32-channel head coil. The protocol was approved by the local IRB, and all participants provided written informed consent. Standard T1-weighted anatomical images were acquired using a 3D magnetization-prepared rapid acquisition gradient echo (MP-RAGE) sequence. SAGE-fMRI data were acquired using the N-back working memory task7–10 (2-back versus 0-back baseline) with our optimized SAGE parameters11: SENSE = 2.5, multi-band = 2, TE1-5 = 8.0/27/59/78/97ms, TR = 3.0s, acquisition matrix: 240 × 240, voxel size = 3mm isotropic, 112 volumes. A reverse phase acquisition was collected for distortion correction. Each SAGE image underwent standard preprocessing using FSL12 and AFNI13. For multi-echo analysis, relaxation rates were fit from the SAGE signal14, and relaxation-weighted summations (Equations 1 and 2) were performed, thus generating six signals for analysis (macrovascular-dominant: standard GRE, SAGE-T2*, SAGE-wT2*, and microvascular-dominant: SE, SAGE-T2, SAGE-wT2). To compare these signals, temporal signal-to-noise ratio (tSNR) was calculated voxel-wise using the mean signal intensity over time divided by the standard deviation of the noise ($$$\sigma_{noise}$$$). Additionally, contrast-to-noise (CNR) ratio was calculated as the difference between signal during stimulus ON and baseline OFF ($$$\Delta S$$$), divided by $$$\sigma_{noise}$$$. A paired t-test was performed for tSNR maps, with results corrected for multiple comparisons within each map (FDR<0.05) and across tests (Bonferroni correction). A t-test was performed to compare signal ON- versus OFF-task. Effect size was calculated using Cohen's D to measure the magnitude of signal change: $$$\Delta S$$$ divided by the standard deviation of the signal. Regions-of-interest (ROI) were derived from atlases in MNI-space15–17.
Results
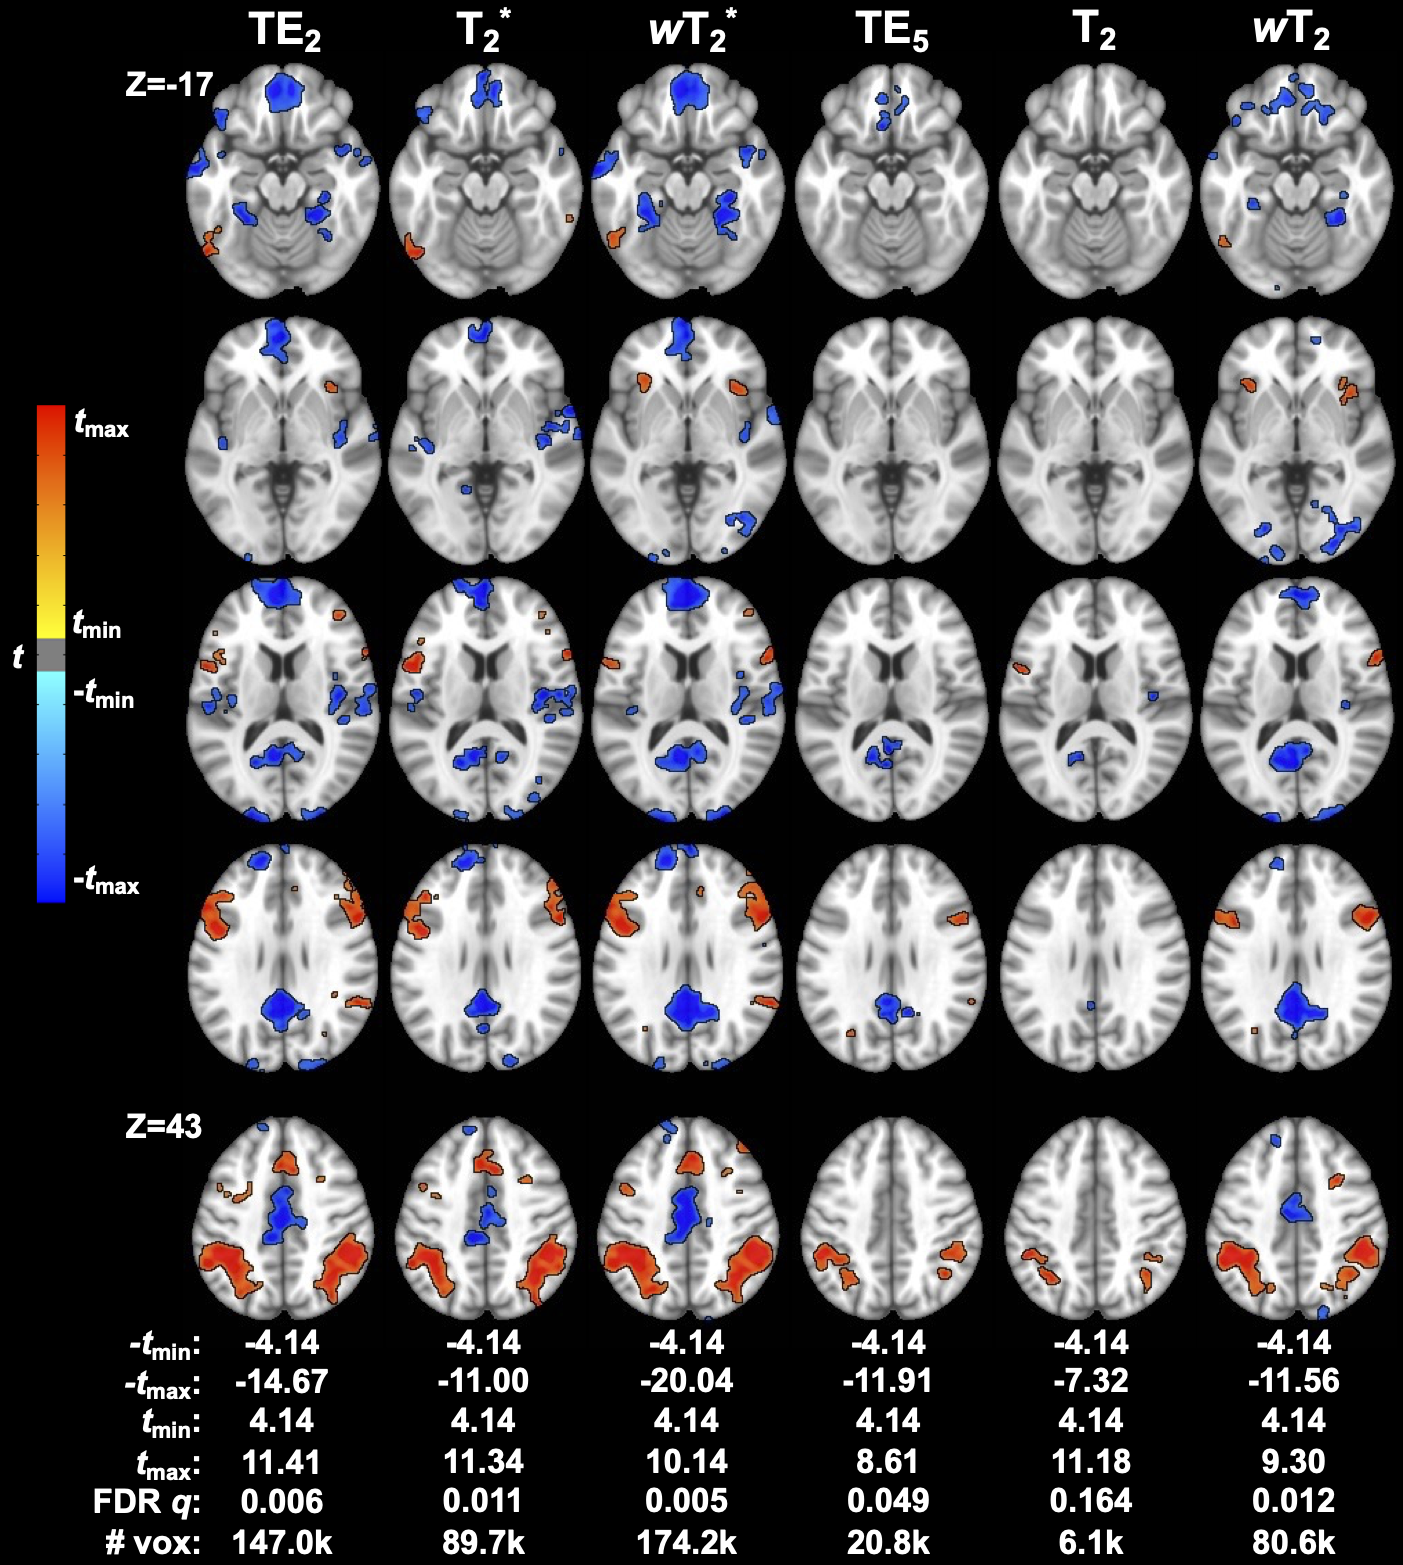
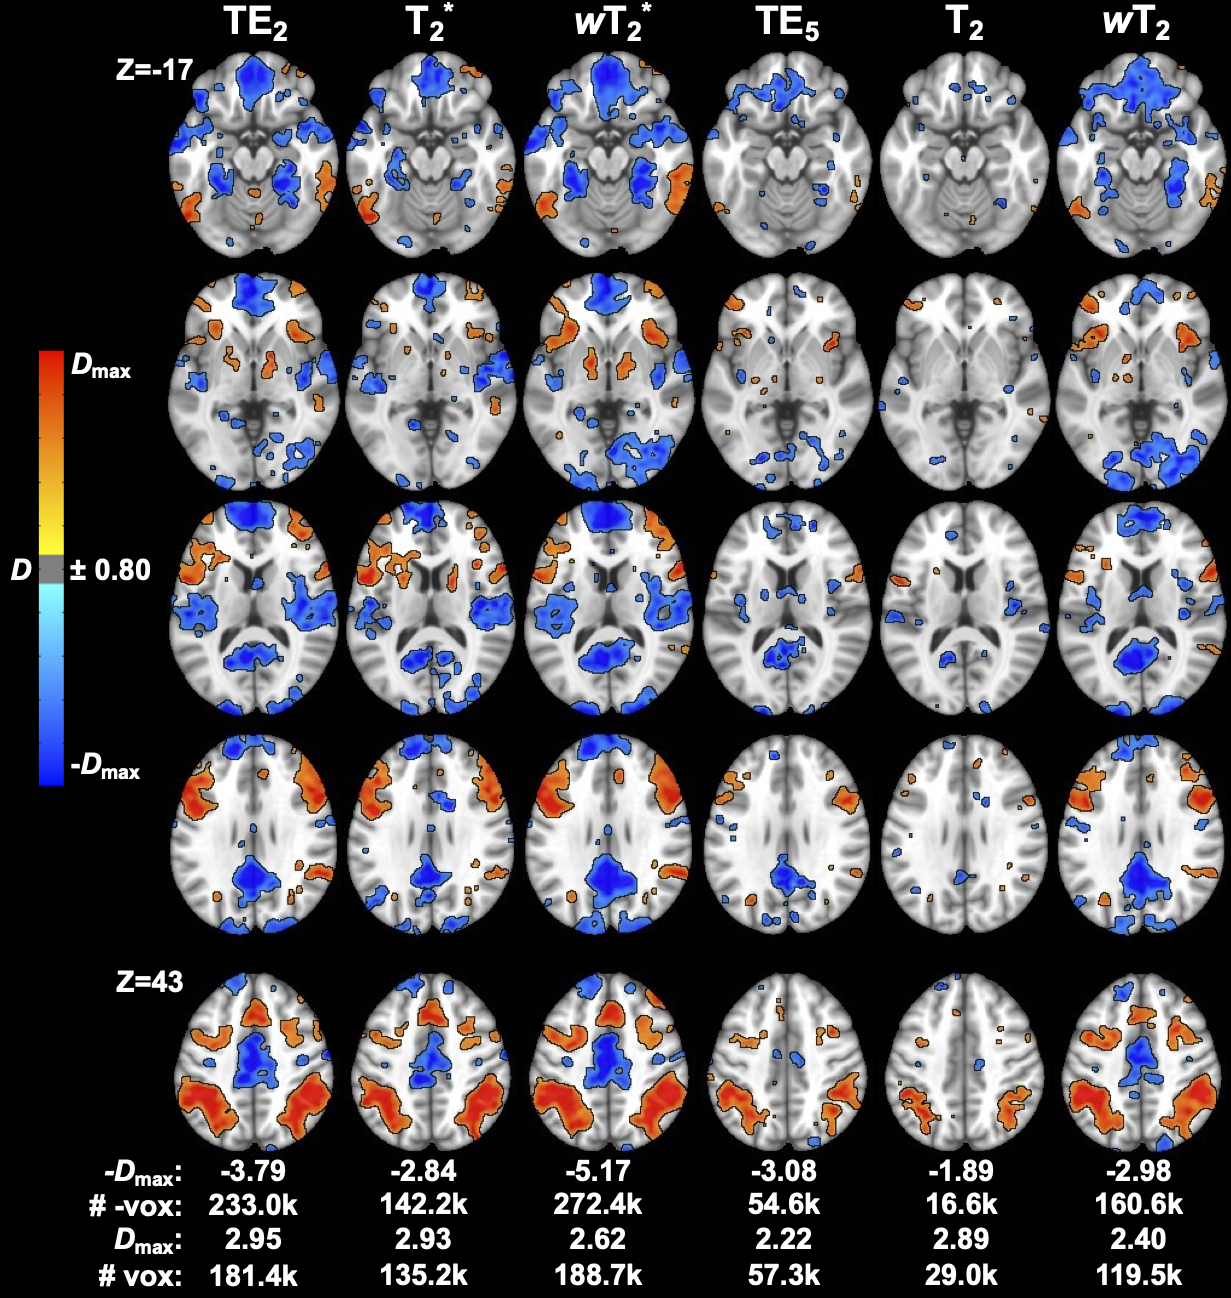
Weighted SAGE maps showed significantly higher tSNR across the brain compared to quantitative SAGE maps (for raw mean group tSNR, see Figure 2; wT2*>T2* for 99.5% total brain volume and wT2>T2 for 99.3% total brain volume) and single-echo fMRI, respectively (wT2*>TE2 for 43.5% total brain volume; wT2>TE5 for 70.0% total brain volume). In the temporal and inferior frontal lobes, there was no significant difference between T2* and TE2, with small clusters of each region showing significantly higher T2* tSNR compared to TE2. CNR values were higher for relaxation-weighted signals than quantitative relaxation times and single-echo methods (Figure 3). These differences for more subtle for wT2* and more obvious for wT2.There was significant activation (p<0.001, cluster-size corrected) in ROIs across macro- and microvasculature-sensitive maps for single-echo and SAGE methods (Figure 4). Both SAGE T2 and wT2 map had a higher maximum t-value (tmax) than TE5; the wT2 map also had a higher voxel count for significant activation than other microvascular methods. For macrovascular methods, wT2 had a higher -tmax and voxel counts for significant de-activation and activation than TE2. Similar trends for macro- and microvascular methods were seen in the effect size analysis (Figure 5).Discussion
In this study, we assessed SAGE-based fMRI using the N-back task. We showed that relaxation-weighted SAGE analyses exhibited increased robustness of functional activation, magnitude of activation, CNR, and tSNR compared to single-echo methods. Reduced susceptibility artifacts leant to significant improvements in tSNR in the inferior frontal and temporal lobes for SAGE wT2* and T2* compared to standard fMRI. Moreover, larger clusters and more robust functional activation seen with weighted SAGE could be indicative of higher BOLD sensitivity. Smaller clusters in microvascular (compared to macrovascular) analyses are expected given the improved spatial specificity but may also be a result of lower BOLD sensitivity. Dynamic R2* and R2 time courses are more quantitative measures but generally showed lower tSNR, CNR, and significant cluster sizes.Conclusion
SAGE-fMRI offers a multi-echo, multi-contrast acquisition, reducing image artifacts and providing sensitivity to microvasculature for comprehensive analyses across two vascular scales. Relaxation-weighted SAGE-fMRI exhibited improved tSNR, CNR, and robustness of activation. Future research may include comparison of SAGE-fMRI to multi-GRE methods, as well as assessment of SAGE-based functional connectivity.Acknowledgements
We acknowledge the source of funding for this work, the Barrow Neurological Foundation. We have a research agreement with Philips Healthcare.References
1. Poser BA, Versluis MJ, Hoogduin JM, Norris DG. BOLD contrast sensitivity enhancement and artifact reduction with multiecho EPI: parallel-acquired inhomogeneity-desensitized fMRI. Magn Reson Med. 2006;55(6):1227-1235.
2. Glover GH, Lemieux SK, Drangova M, Pauly JM. Decomposition of inflow and blood oxygen level-dependent (BOLD) effects with dual-echo spiral gradient-recalled echo (GRE) fMRI. Magn Reson Med. 1996;35(3):299-308.
3. Norris DG, Zysset S, Mildner T, Wiggins CJ. An investigation of the value of spin-echo-based fMRI using a Stroop color-word matching task and EPI at 3 T. Neuroimage. 2002;15(3):719-726.
4. Schmiedeskamp H, Straka M, Newbould RD, et al. Combined spin- and gradient-echo perfusion-weighted imaging. Magn Reson Med. 2012;68(1):30-40.
5. Stokes AM, Skinner JT, Quarles CC. Assessment of a combined spin- and gradient-echo (SAGE) DSC-MRI method for preclinical neuroimaging. Magn Reson Imaging. 2014;32(10):1181-1190.
6. Posse S, Wiese S, Gembris D, et al. Enhancement of BOLD-contrast sensitivity by single-shot multi-echo functional MR imaging. Magn Reson Med. 1999;42(1):87-97.
7. Ragland JD, Turetsky BI, Gur RC, et al. Working memory for complex figures: an fMRI comparison of letter and fractal n-back tasks. Neuropsychology. 2002;16(3):370-379.
8. Marshall I, Simonotto E, Deary IJ, et al. Repeatability of motor and working-memory tasks in healthy older volunteers: assessment at functional MR imaging. Radiology. 2004;233(3):868-877.
9. Drobyshevsky A, Baumann SB, Schneider W. A rapid fMRI task battery for mapping of visual, motor, cognitive, and emotional function. Neuroimage. 2006;31(2):732-744.
10. Barch DM, Burgess GC, Harms MP, et al. Function in the human connectome: task-fMRI and individual differences in behavior. Neuroimage. 2013;80:169-189.
11. Keeling EG, Bergamino M, Ragunathan S, Quarles CC, Stokes AM. Optimization of combined spin- and gradient-echo EPI in fMRI via in- and through-plane acceleration. Proc 31st Annu Meet ISMRM. 2022;1528.
12. Jenkinson M, Beckmann CF, Behrens TE, Woolrich MW, Smith SM. FSL. Neuroimage.2012;62(2):782-790.
13. Cox RW. AFNI: software for analysis and visualization of functional magnetic resonance neuroimages. Comput Biomed Res. 1996;29(3):162-173.
14. Sisco NJ, Keeling EG, Borazanci A, Dortch RD, Stokes AM. Rapid Parameter Estimation for Combined Spin and Gradient Echo (SAGE) Imaging. Proc 31st Annu Meet ISMRM. 2022;4972.
15. Mazziotta J, Toga A, Evans A, et al. A probabilistic atlas and reference system for the human brain: International Consortium for Brain Mapping (ICBM). Philos Trans R Soc Lond B Biol Sci. 2001;356(1412):1293-1322.
16. Collins D, Holmes C, Peters T, Evans A. Automatic 3-D model-based neuroanatomical segmentation. Hum Brain Mapp. 1995;3(3):190-208.
17. Desikan RS, Ségonne F, Fischl B, et al. An automated labeling system for subdividing the human cerebral cortex on MRI scans into gyral based regions of interest. Neuroimage. 2006;31(3):968-980.
Figures