1270
Impact of EPI readout duration on the diffusion-fMRI response onset time
Shota Hodono1, Jonathan R Polimeni2,3, and Martijn A Cloos1
1Centre for Advanced Imaging, The University of Queensland, Brisbane, Australia, 2Athinoula A. Martinos Center for Biomedical Imaging, Massachusetts General Hospital, Charlestown, MA, United States, 3Harvard-MIT Division of Health Sciences and Technology, Massachusetts Institute of Technology, Cambridge, MA, United States
1Centre for Advanced Imaging, The University of Queensland, Brisbane, Australia, 2Athinoula A. Martinos Center for Biomedical Imaging, Massachusetts General Hospital, Charlestown, MA, United States, 3Harvard-MIT Division of Health Sciences and Technology, Massachusetts Institute of Technology, Cambridge, MA, United States
Synopsis
Keywords: fMRI (task based), Diffusion/other diffusion imaging techniques
We investigated the impact of the EPI readout duration on the onset time of activation observed with diffusion functional MRI (DfMRI). Both long (28.5-ms) and short (12.5-ms) readouts showed a clear functional response, even in individual subjects. However, using a long readout the onset time was shifted towards SE-BOLD (1.6-s [short readout] vs 1.2-s [long readout]), suggesting that longer readouts make the DfMRI signal more similar to SE-BOLD, presumably due to increased BOLD contamination.Introduction
Conventional functional MRI (fMRI) techniques infer brain activation indirectly by observing associated hemodynamic changes1-3. As a result, the detection of neuronal activity can be “blurred” in space and time4. To achieve more direct fMRI contrast, various techniques have been proposed5,6. One is the diffusion fMRI (DfMRI) approach6. However, many have struggled to reproduce the DfMRI response reliably7-9. Last year, we showed that using short EPI readouts, minimizing the T2’ contamination from hemodynamic effects, a functional response with an onset time 1.6-s earlier than that of SE-BOLD can be detected using DfMRI10. Here we investigate how the DfMRI response onset time behaves as a function of EPI readout duration.Methods
The study was approved by the local human research ethics committee in accordance with national guidelines. In addition to four subjects previously scanned with short readouts10, another four healthy volunteers were scanned using the same 3T and 64-channel head coil (Prisma, Siemens, Germany). Functional data were acquired using the same twice-refocused diffusion-weighted SE-EPI sequence (b=1800s/mm2). To minimize the duration of the diffusion preparation, the diffusion gradients were uniformly distributed over three axes. We compared these data with an identical protocol without diffusion weighting (b=0 s/mm2) to provide twice refocused spin echo (TRSE)-BOLD contrast. We designed our protocol around the approximate optimal echo-time for SE-BOLD at 3T (TE=75ms). Data were acquired using short10 (12.5ms, bandwidth/pixel = 2530Hz/pixel, GRAPPA=3) and long readout durations (28.5ms, bandwidth/pixel=1496Hz/pixel, GRAPPA=2) using a moderate resolution acquisition (3x3x3mm3).The visual stimulus consisted of a flickering checkerboard (8Hz: 10/30s ON/OFF) (Fig. 1). Each run lasted 8.5min, collecting 510 volumes (volume-TR=1s, 8 slices, 50% gap). Because this protocol was designed to achieve high specificity of the DfMRI signal at the expense of sensitivity, we acquired up to 10 DfMRI runs per subject to increase SNR through trial averaging.
Slice timing and motion were corrected SPM1211. Activation maps were estimated from the TRSE-BOLD datasets (b=0 s/mm2) using GLM analysis (FSL feat12). Voxels with a z-score above 4.0 were selected as the ROI for DfMRI data sets. Signals within the ROI were averaged across runs, and the mean trial response was estimated using custom code written in MATLAB (Mathworks, USA).
Results & Discussion
Figure 2 and 3 show the trial average responses from an individual subject using short and long readouts. Interestingly, when the responses are normalized, an earlier onset is still observed in DfMRI data with long readouts, even in individual subjects. Noticeably, confidence intervals in long readout acquisitions are much wider than short readout acquisitions. When averaged across subjects (Fig.4), we see 0.67±0.3% signal change in the DfMRI data collected with long readouts, which is almost equivalent to our short readout data (0.65±0.2%). However, the DfMRI response observed using long readouts preceded SE-BOLD response by only 1.2s, which is 0.4s smaller than what we observed when using shorter readouts (1.6s). Some of this effect may be due to the response amplitude normalization, and further evaluation of the onset time differences is ongoing.In SE-based sequences, the T2’ contribution is only fully refocused at the center of the readout, therefore when a longer readout window is used the acquired signal becomes more and more contaminated with T2’. For example, Goense & Logothetis13 reported that there is significant T2’ contribution to SE-BOLD response with readout duration of 30.7 ms, but it was suppressed with 15.4-ms readout window at 4.7 Tesla. Hence, we suspect that T2’ contamination can bias the DfMRI response towards BOLD. Thus both the DfMRI and the SE-BOLD acquisitions will reflect contamination from gradient-echo-BOLD components.
Seminal work by Miller et al.9 concluded that DfMRI is significantly weighted by vascular component, because fMRI experiment with hypercapnia showed similar signal behavior to DfMRI experiment and no stimulus onset time difference was observed. Therefore, a significant vascular effect on the DfMRI response was suggested. However, their DfMRI protocol used a 33ms long readout. It is possible that their long readout introduced significant T2’ contamination.
Conclusion
We have found that using a longer readout the onset time of the DfMRI is shifted towards SE-BOLD. The underlying biophysical origin of the early onset observed using DfMRI remains unclear. However, it is becoming increasingly clear that it is easily overshadowed by a much stronger BOLD effect.Acknowledgements
This work was supported by ARC Future fellowship grant FT200100329, by the NIH NIBIB (grants P41-EB03006, R01-EB019437 and R01-EB032746) and by the BRAIN Initiative (NIH NIMH grant R01-MH111419 and NINDS grant U19-NS123717). The authors acknowledge the facilities of the National Imaging Facility at the Centre for Advanced Imaging.References
1. Ogawa S, Lee TM, Kay AR, Tank DW. Brain magnetic resonance imaging with contrast dependent on blood oxygenation. proceedings of the National Academy of Sciences. 1990 Dec;87(24):9868-72.2. Duong TQ, Kim DS, Uğurbil K, Kim SG. Localized cerebral blood flow response at submillimeter columnar resolution. Proceedings of the National Academy of Sciences. 2001 Sep 11;98(19):10904-9.
3. Hillman EM. Coupling mechanism and significance of the BOLD signal: a status report. Annual review of neuroscience. 2014 Jul 7;37:161.
4. Turner R. How much cortex can a vein drain? Downstream dilution of activation-related cerebral blood oxygenation changes. Neuroimage. 2002 Aug 1;16(4):1062-7.
5. Toi PT, Jang HJ, Min K, Kim SP, Lee SK, Lee J, Kwag J, Park JY. In vivo direct imaging of neuronal activity at high temporospatial resolution. Science. 2022 Oct 14;378(6616):160-8.
6. Le Bihan D, Urayama SI, Aso T, Hanakawa T, Fukuyama H. Direct and fast detection of neuronal activation in the human brain with diffusion MRI. Proceedings of the National Academy of Sciences. 2006 May 23;103(21):8263-8.
7. Bai R, Stewart CV, Plenz D, Basser PJ. Assessing the sensitivity of diffusion MRI to detect neuronal activity directly. Proceedings of the National Academy of Sciences. 2016 Mar 22;113(12):E1728-37.
8. Rudrapatna US, van der Toorn A, van Meer MP, Dijkhuizen RM. Impact of hemodynamic effects on diffusion-weighted fMRI signals. Neuroimage. 2012 May 15;61(1):106-14.
9. Miller KL, Bulte DP, Devlin H, Robson MD, Wise RG, Woolrich MW, Jezzard P, Behrens TE. Evidence for a vascular contribution to diffusion FMRI at high b value. Proceedings of the National Academy of Sciences. 2007 Dec 26;104(52):20967-72.
10. Hodono S, Polimeni J, Cloos M, Detection of fast responses in diffusion fMRI of the human visual cortex through reduced vascular contamination, Proceedings of the Joint Annual Meeting ISMRM-ESMRMB, 2022; 2115.
11. Penny WD, Friston KJ, Ashburner JT, Kiebel SJ, Nichols TE, editors. Statistical parametric mapping: the analysis of functional brain images. Elsevier; 2011.5.
12. M.W. Woolrich, B.D. Ripley, J.M. Brady and S.M. Smith. Temporal Autocorrelation in Univariate Linear Modelling of FMRI Data. NeuroImage 14:6(1370-1386) 2001.6.
13. Goense JB, Logothetis NK. Laminar specificity in monkey V1 using high-resolution SE-fMRI. Magnetic resonance imaging. 2006 May 1;24(4):381-92.
Figures
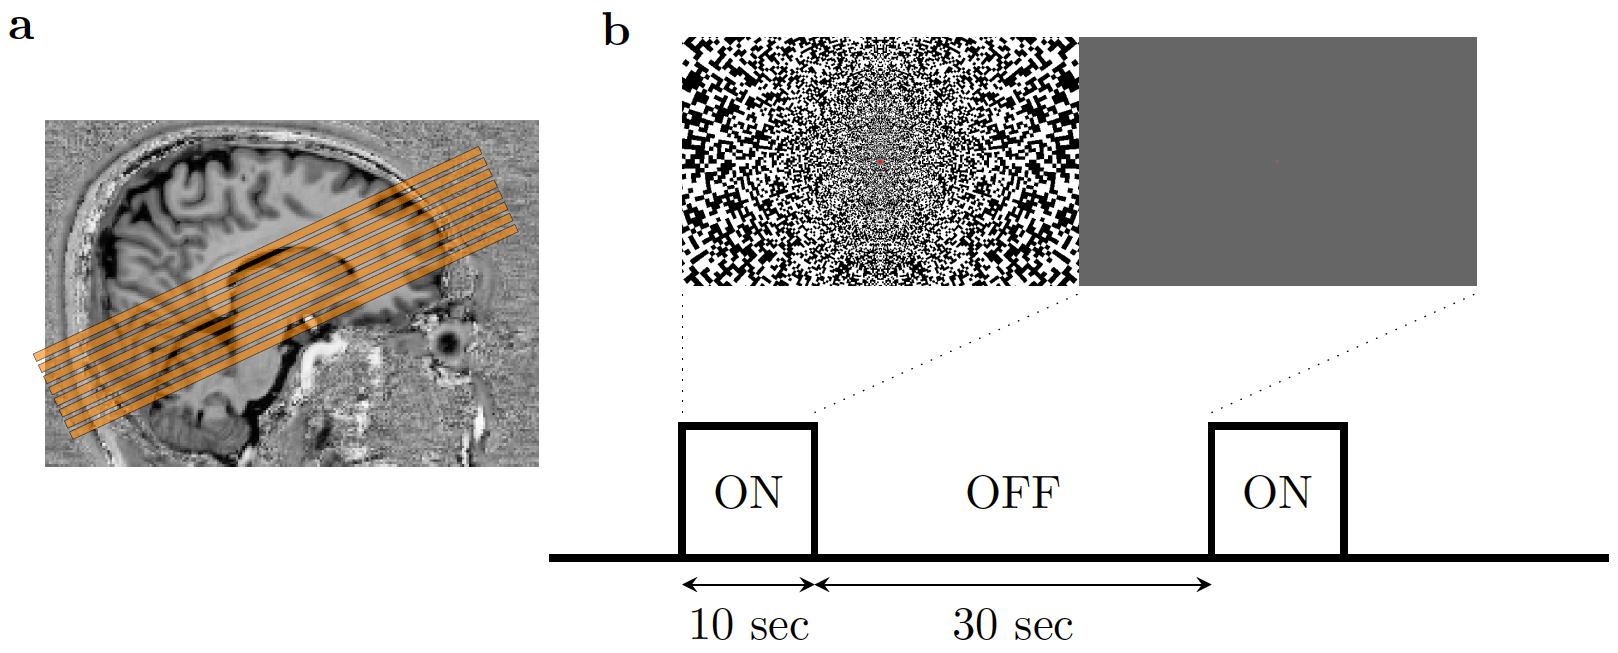
Figure 1. (a) Slices placement during (D)fMRI scans. The slices were placed to cover the calcarine sulcus. (b) Illustration of experimental paradigm and the visual stimulus. The noise pattern flickered at 8Hz. Within 1 run, the ‘on’ and ‘off’ blocks were repeated 12 times.
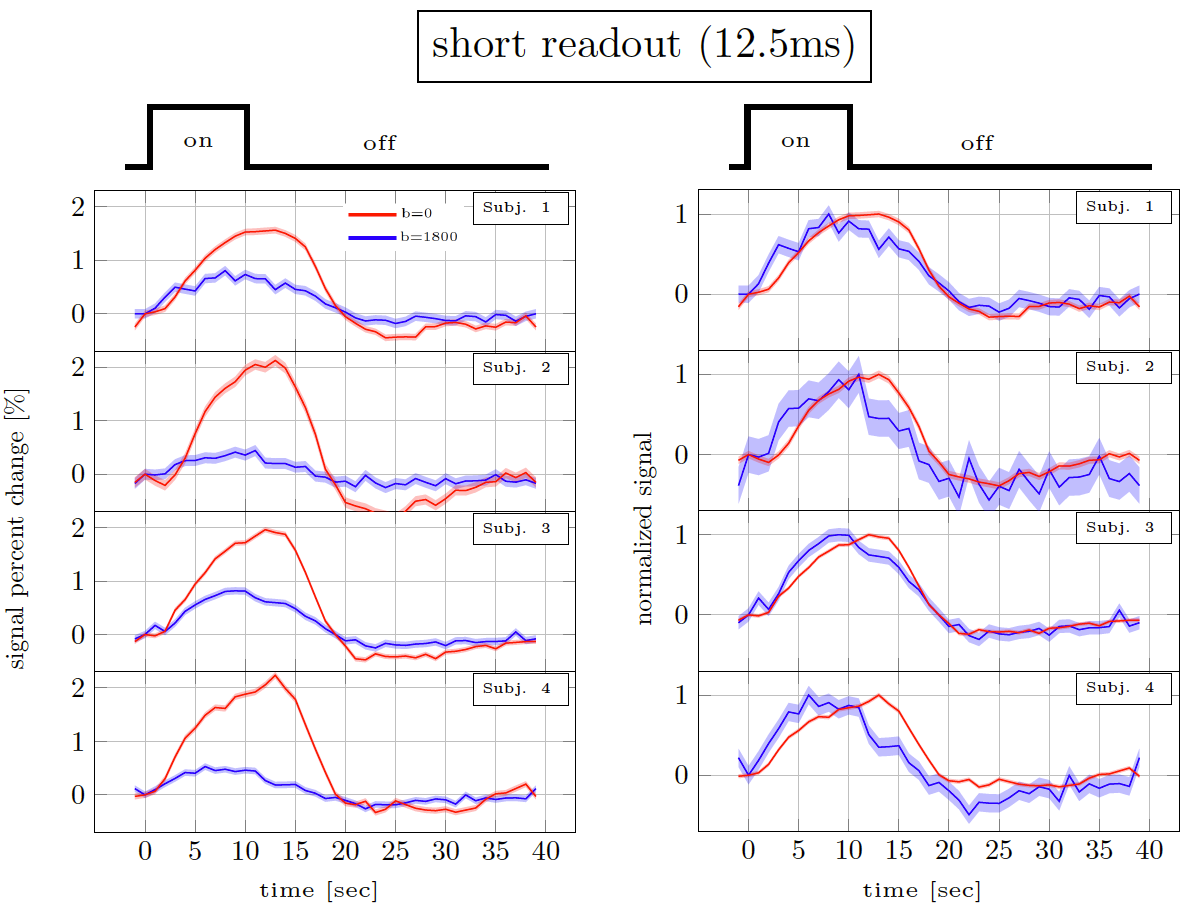
Figure 2. Short readout results10. Percent signal changes in individual subjects estimated from DfMRI and TRSE-BOLD data. The shaded areas represent confidence intervals of the signal change (across voxels, trails and runs). The left panel shows the % signal change. The right panel shows the same curves normalised to have the same amplitude.
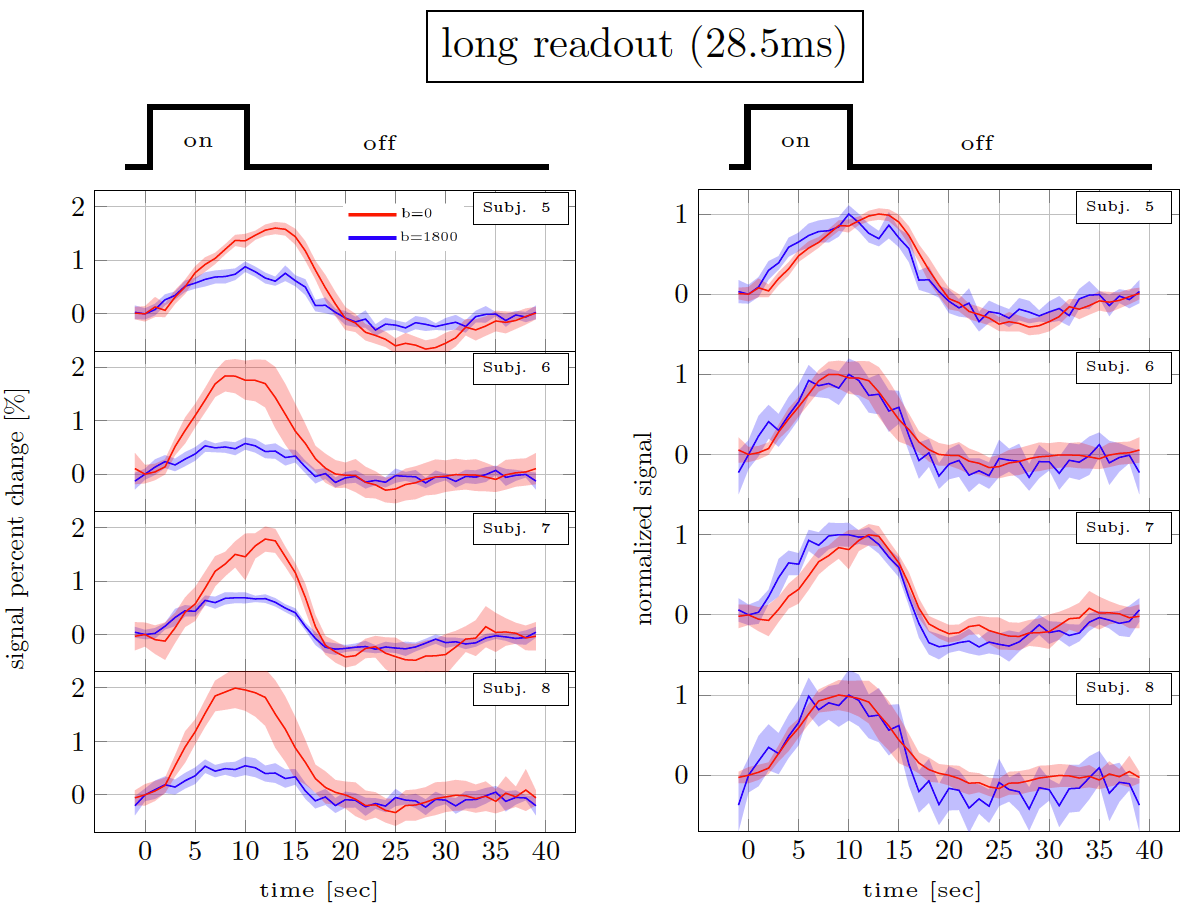
Figure 3. Long readout results. Percent signal changes in individual subjects estimated from DfMRI and TRSE-BOLD data. The shaded areas represent confidence intervals of the signal change (across voxels, trails and runs). The left panel shows the % signal change. The right panel shows the same curves normalised to have the same amplitude.
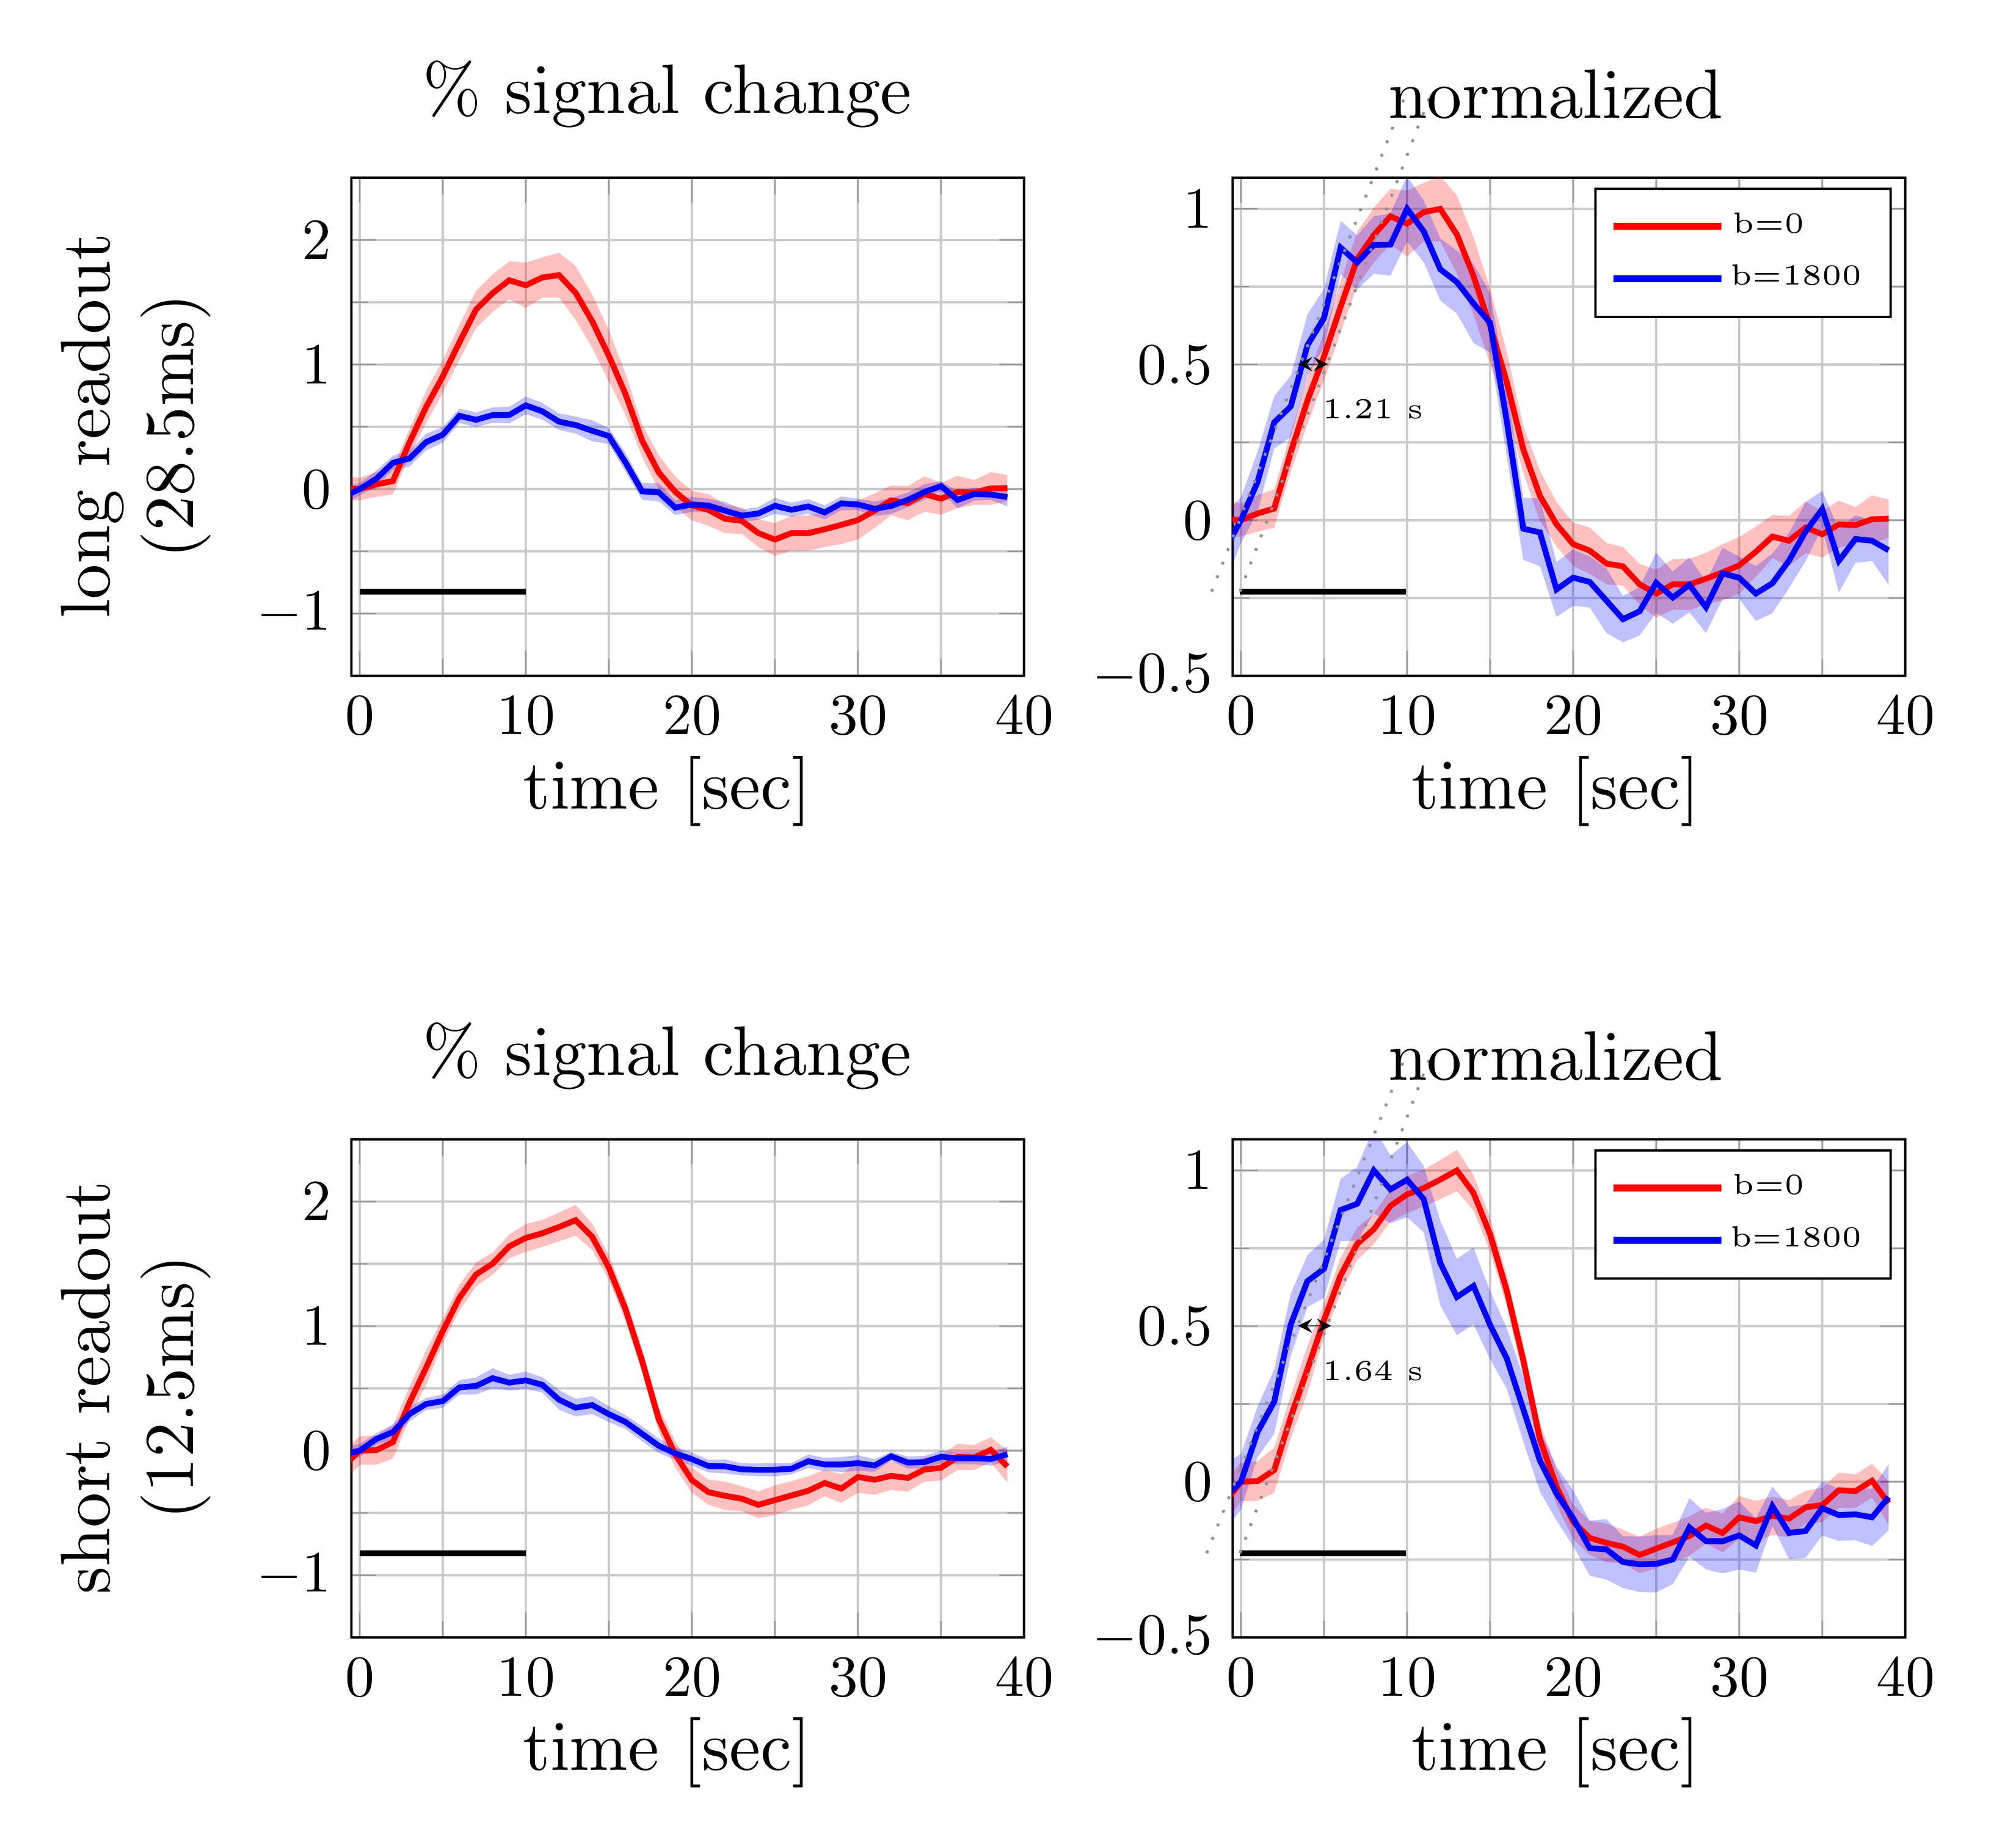
Figure 4. Percent signal changes averaged across subjects were estimated from diffusion and twice refocused spin echo datasets (left). The shaded areas represent the confidence interval (across trails and subjects, after averaging voxels and runs). Both mean signal curves were normalized to their respective maximum values (right). The difference in signal onset time was estimated from the distance between two linear fits (dotted lines) at half of the maximum. The error bars on the onset time difference were estimated from width of the confidence intervals at the half maximum.
DOI: https://doi.org/10.58530/2023/1270