1268
Short single pulse optogenetic fMRI mapping of downstream targets in thalamo-cortical pathways1Laboratory of Biomedical Imaging and Signal Processing, The University of Hong Kong, Hong Kong SAR, China, 2Department of Electrical and Electronic Engineering, The University of Hong Kong, Hong Kong SAR, China, 3Department of Diagnostic Radiology, Li Ka Shing Faculty of Medicine, The University of Hong Kong, Hong Kong SAR, China, 4School of Biomedical Sciences, Li Ka Shing Faculty of Medicine, The University of Hong Kong, Hong Kong SAR, China
Synopsis
Keywords: fMRI (task based), fMRI (task based)
Short single pulse stimulation is advantageous to map the downstream neural targets compared to pulse train stimulation because it can minimize the excessive neural synchronization and avoid numerous series of complex neural events. It is desirable for fMRI studies to investigate the properties of neural circuits via delivering single pulse stimulation. However, the subtle BOLD responses evoked by short stimuli are hard to detect due to the sensitivity issue. Here, we employed fMRI to examine the long-range downstream targets of the somatosensory thalamus with 10ms single pulse stimulation. A model-free fMRI analysis was utilized to visualize the spatiotemporal activity propagation.Introduction
A short single pulse (i.e., electrical or optogenetic) stimulus activates a localized population of neurons1 and is a widely adopted approach in neuroscience2-5. Single pulse stimulation is advantageous compared to repetitive pulse train stimulations as it minimizes excessive synchronization of the target neural population and avoids numerous series of complex neural events caused by adaptation, feedforward, and/or feedback interactions6-8. As such, it constitutes the simplest form of stimulation that can map downstream neural target(s) when compared to pulse train stimulations, which is more desirable for fMRI examination of the properties of neural circuits9-13. At present, block-designed paradigms with longer stimulus duration (1-30s) have remained the workhorse for fMRI studies10-16. The challenge of using very short stimuli is the low sensitivity in detecting BOLD responses due to the weak evoked BOLD responses. Studies, however, have shown that fMRI voxels with subtle hemodynamic responses can be detected with massive averaging and/or with appropriate and versatile fMRI analysis models17,18.Here, we demonstrate that mapping downstream neural targets along long-range pathways is feasible with a single 10ms optogenetic stimulation pulse presented at the rodent somatosensory-specific ventroposterior medial thalamus (VPM)19 in combination with fMRI.
Method
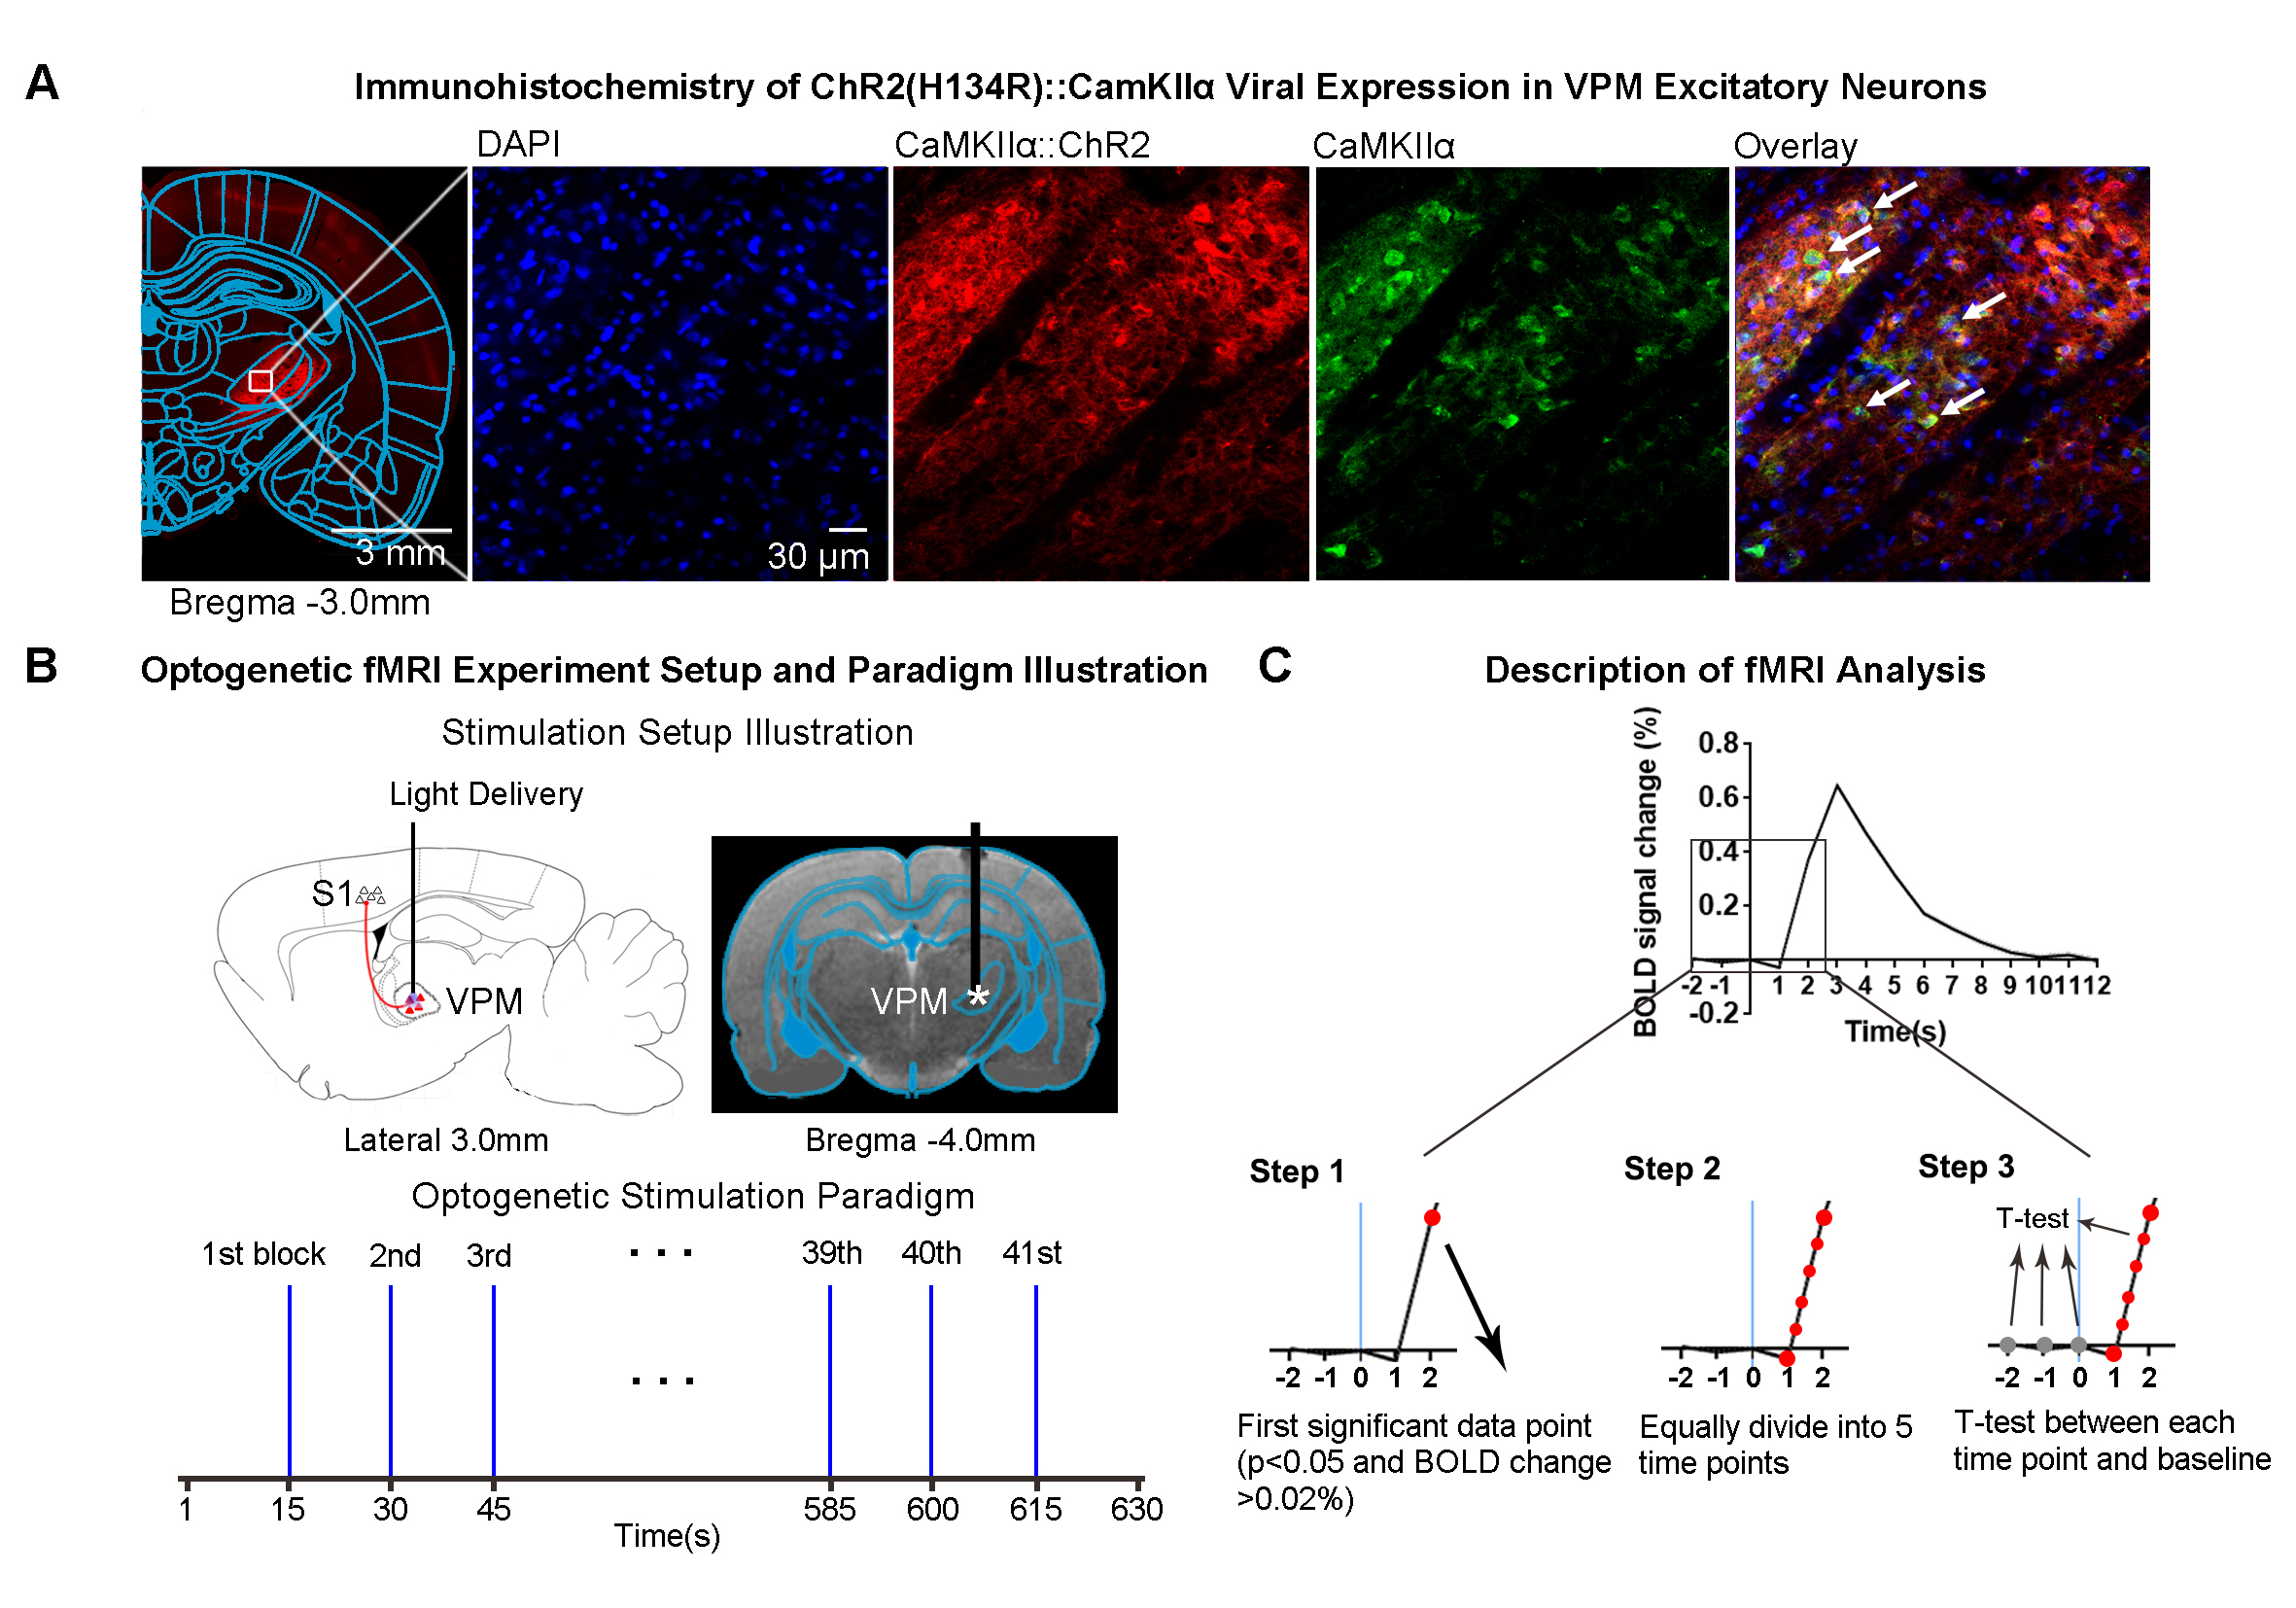
Animal preparation and optogenetic stimulation: 3μl AAV5-CaMKIIα::ChR2(H134R)-mCherry was injected to the center of VPM (-3.6mm posterior to Bregma, +3.0mm medial-lateral right hemisphere, -6.2mm from surface of dura) of adult SD rats (200-250g, male, 6-7 weeks old, n=4). Four weeks after injection, rats were implanted with an opaque optical fiber cannula (d=450μm). Blue light (wavelength=473nm, pulse width=10ms, pulse-to-pulse interval=15s, 40mW/mm2) was presented to animals expressing ChR2 (Figure 1B). Each fMRI scan had 41 single pulse stimulations, and each animal underwent 17 fMRI scans in a typical experiment.fMRI acquisition and analysis: fMRI data were acquired on 7T Bruker scanner using GE-EPI (FOV=32×32mm2, matrix=64×64, α=56°, TE/TR=20/1000ms, and 16 contiguous slices with 1mm thickness). Standard fMRI preprocessing, co-registration and averaging of 68 fMRI scans from 4 animals were performed before coherence analysis20 was applied to identify significant BOLD responses (p<0.01). 2788 BOLD signal profiles corresponding to 2788 stimulation blocks in total were extracted for each atlas-defined ROIs. Paired-sample t-test was performed between baseline (3 data points before stimulation) and subsequent data points after stimulus. Significant data points were identified when p<0.05 and BOLD signal change >0.02%/<-0.02% (i.e., >4 SEM above/below baseline; Figure 1C). The BOLD signal profile was then equally divided into 5 time points (0.2s resolution) between the first identified significant data point and the preceding data point. T-test between baseline and each of the five time points was utilized to determine whether BOLD amplitude was significantly above/below baseline. Note that we chose 0.2s as it struck a balance between BOLD specificity and sensitivity in detecting statistically significant BOLD response amplitudes across the five time points.
Results
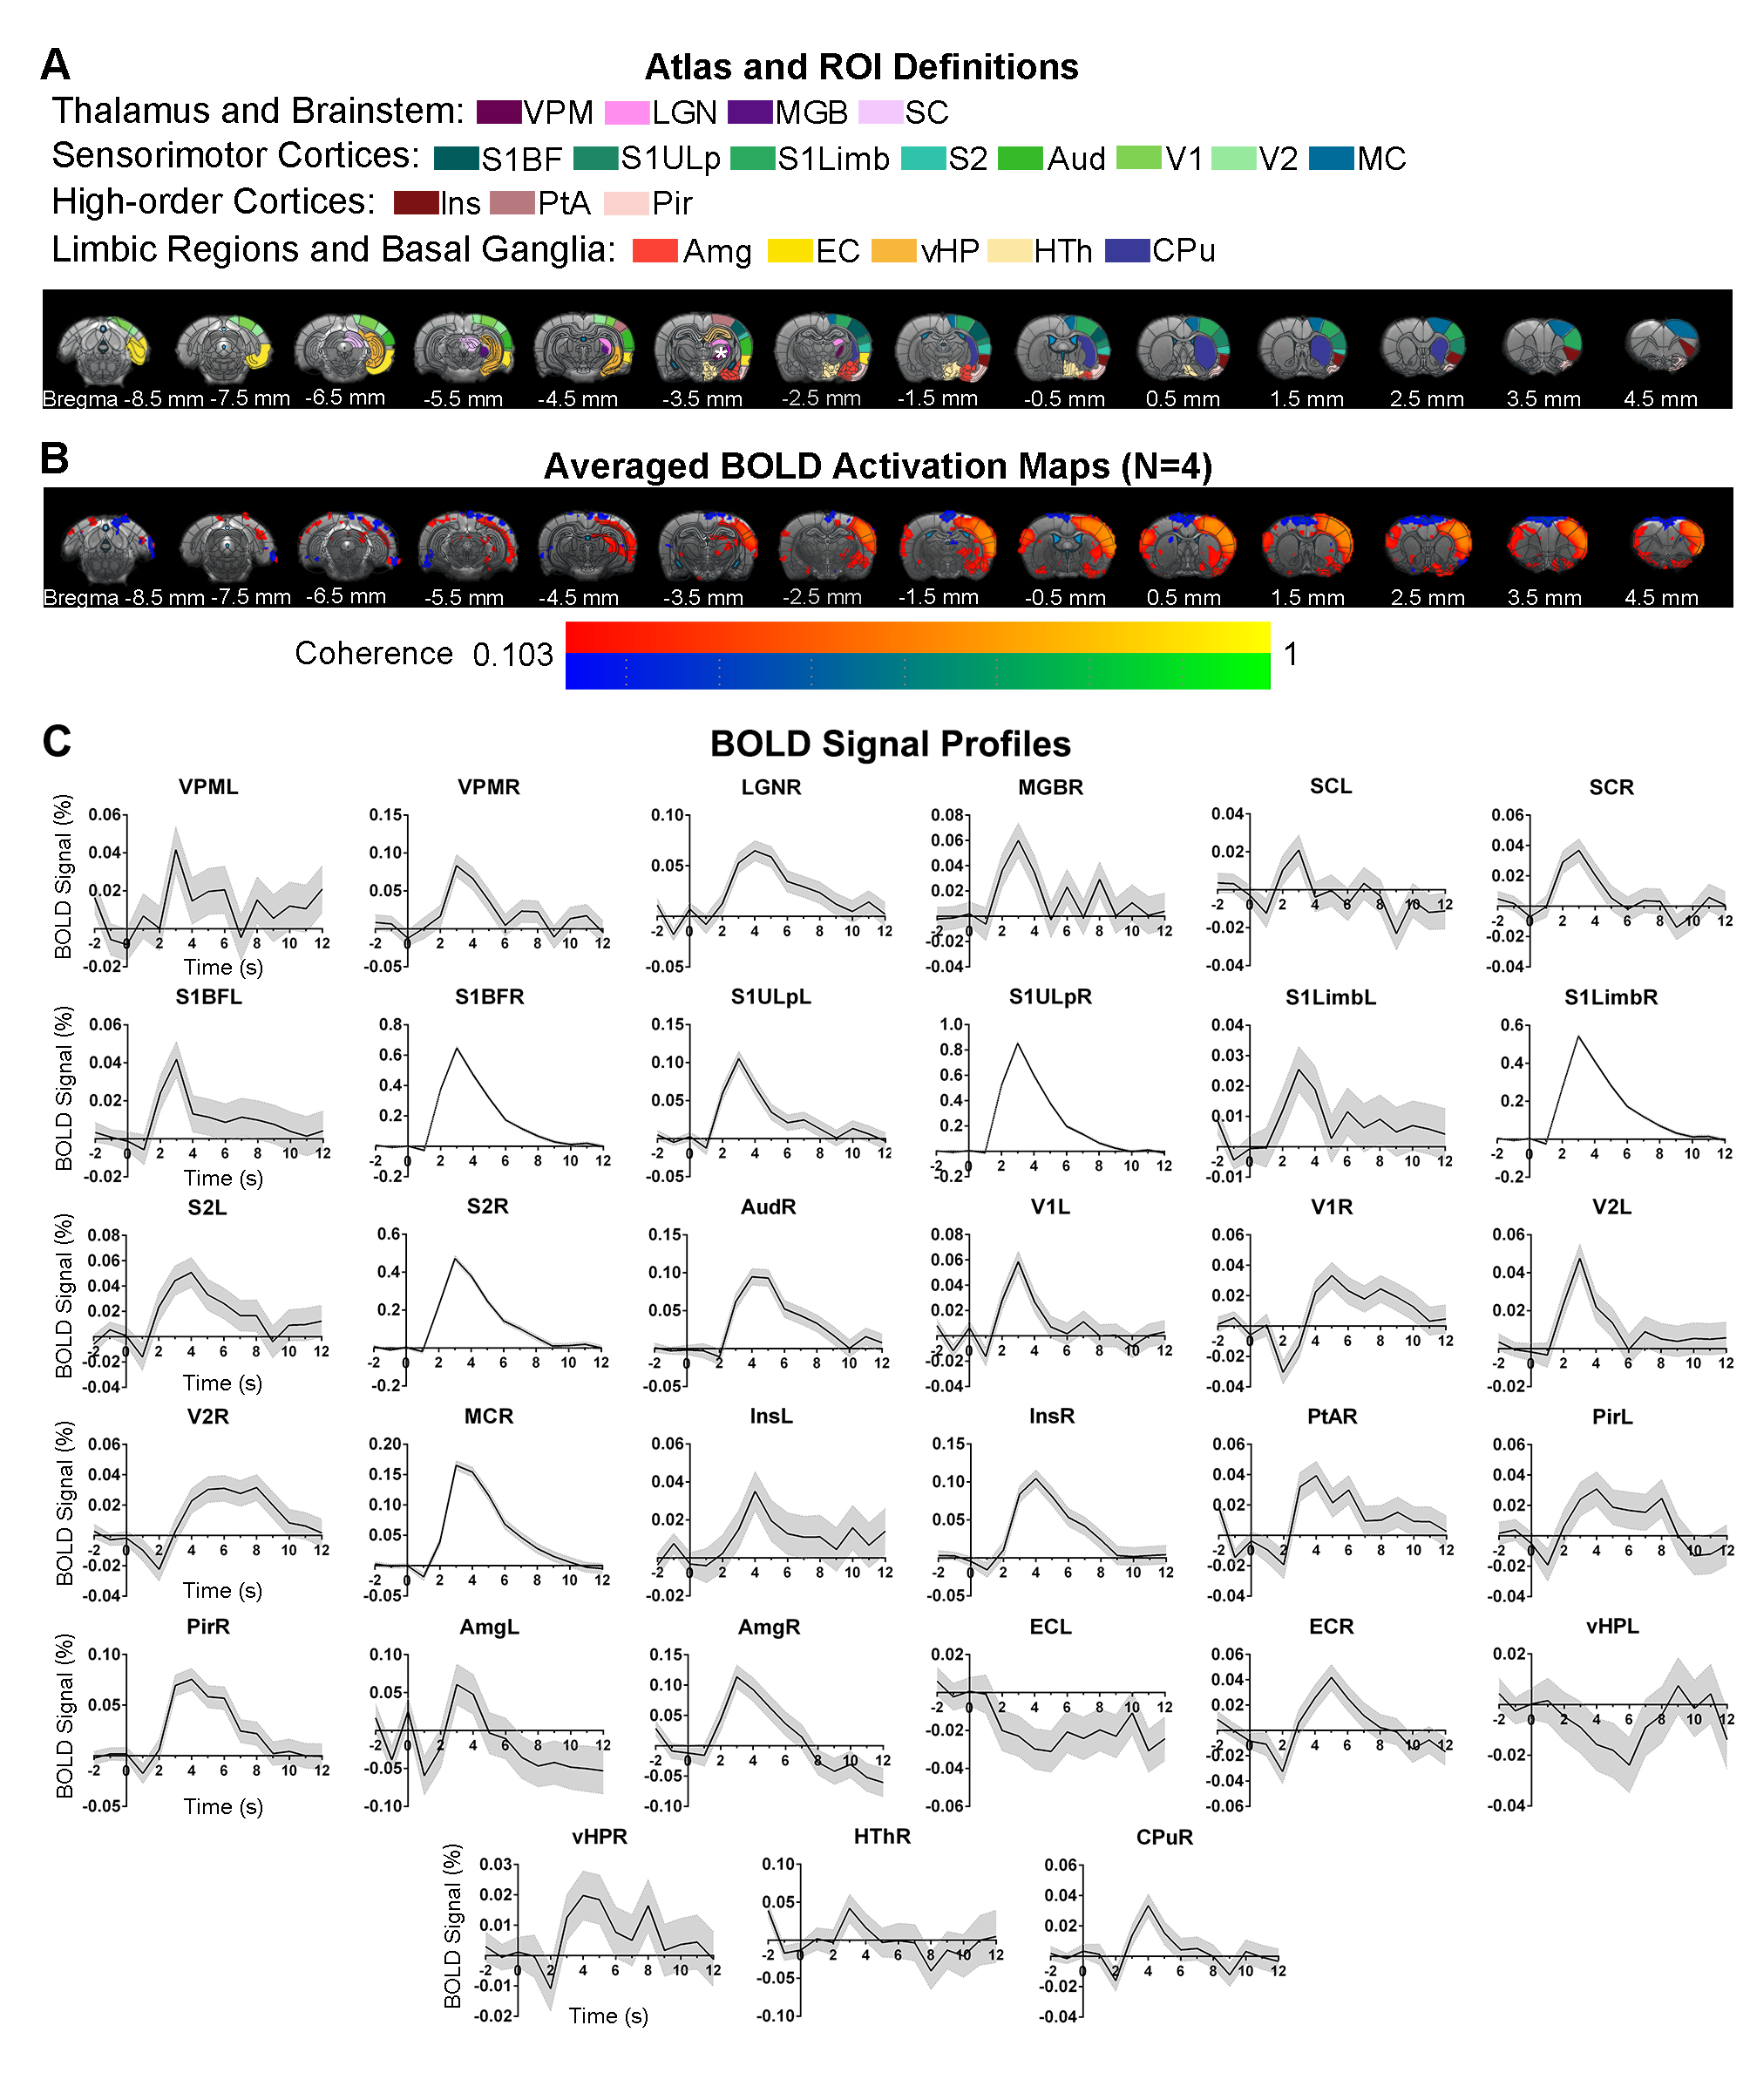
Brain-wide activations upon single-pulse optogenetic stimulation of VPM:Optogenetic single-pulse stimulation of VPM evoked BOLD responses as expected in somatosensory regions, including ipsilateral VPM, and bilateral primary somatosensory barrel field (S1BF), limb (S1Limb), upper lip area (S1ULp) and secondary somatosensory (S2) cortices (Figure 2). Additionally, we also observed BOLD activations primarily in the ipsilateral hemisphere at other sensorimotor regions such as the visual (i.e., lateral geniculate nucleus, LGN, superior colliculus, SC, and visual cortex, V1&V2); auditory (i.e., medial geniculate body, MGB, and auditory cortex, Aud) and motor system (i.e., motor cortex, MC, and caudate putamen, CPu). Interestingly, we found activations at higher-order cortices associated with cognition such as bilateral insular (Ins) and piriform cortex (Pir), and ipsilateral parietal cortex (PtA); and limbic regions, including bilateral amygdala (Amg), entorhinal cortex (EC), and ipsilateral ventral hippocampus (vHP) and hypothalamus (HTh).
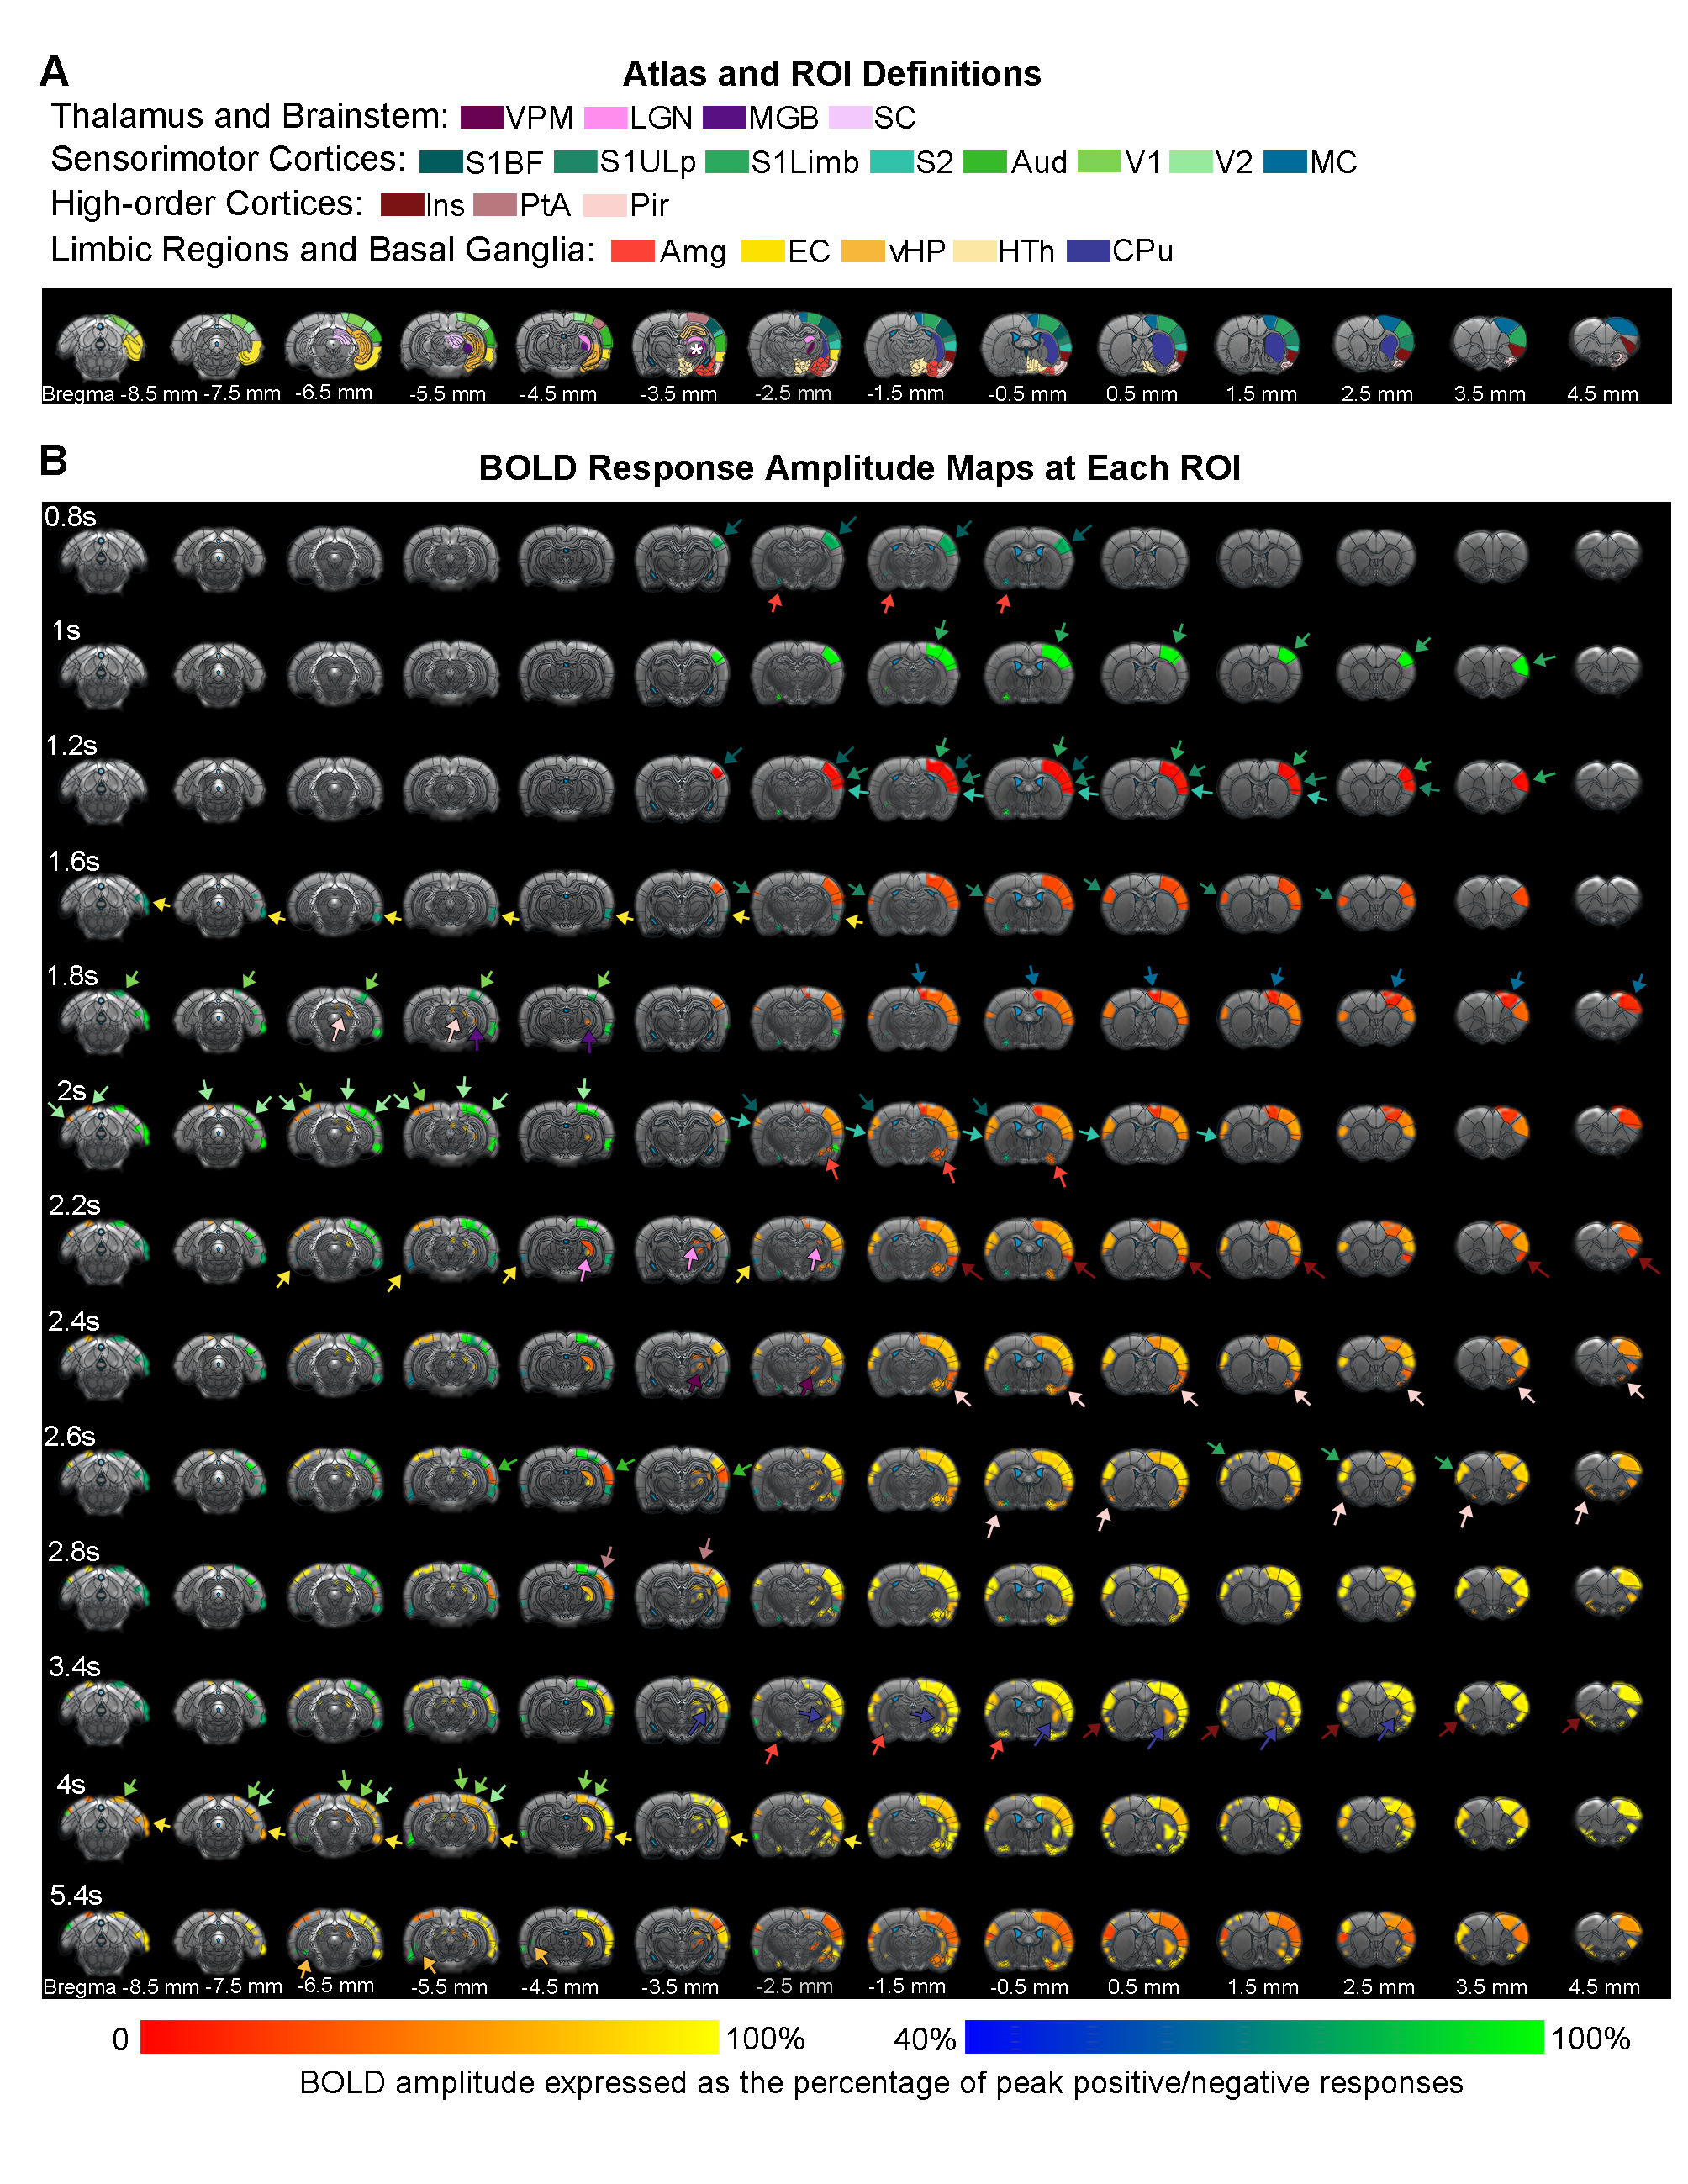
In the sensorimotor cortex, the single-pulse-evoked signal propagated to ipsilateral S1BF first (0.8s), followed by ipsilateral S1Limb (1s), S1ULp (1.2s), S2 (1.2s), contralateral S1 (1.6s), ipsilateral MC (1.8s), ipsilateral and contralateral VC (1.8s and 2s), and ipsilateral Aud (2.6s) (Figure 3).
The overall observed BOLD signal arrived slowly at limbic and striatal regions compared to primary somatosensory cortex. Responses at the higher-order cortices were observed 2.2s after stimulus in ipsilateral Ins, Pir, PtA, and contralateral Pir, and Ins.
Discussion and Conclusion
Our findings demonstrate that fMRI can detect brain-wide neural activity response with the presentation of a short 10ms single optogenetic stimulation pulse. The inferred onset time of BOLD responses (Figure 3) corroborates the documented sequence of neural activation in the sensorimotor cortex from the thalamus in previous electrophysiology studies by us and others9,21. For example, the feedforward input from VPM first reaches ipsilateral S1, and spreads sequentially to contralateral S1, ipsilateral VC, and contralateral VC. However, the long onset delay at the stimulated region (i.e., ipsilateral VPM) likely resulted from suboptimal BOLD responses due to signal dropout caused by optical fiber and compounded by lower SNR at subcortical regions. More importantly, subsequent to ipsilateral S1BF response, activations at limbic, striatal, and high-order cortical regions indicate that VPM is directly associated to taste perception22,23 (i.e., Pir, Amg, HTh, and Ins), cognition24,25 (i.e., EC and vHP), sensory learning26,27 (i.e, MC and striatum), and pain28,29 (i.e., Ins, PtA, and S2). Our preliminary work here describes the simplest form of stimulation to examine long-range downstream targets of various brain regions.Acknowledgements
This work was supported in part by Hong Kong Research Grant Council (HKU17112120, HKU17127121, HKU17127022 and R7003-19F to E.X.W., and HKU17103819, HKU17104020 and HKU17127021 to A.T.L.L.), Lam Woo Foundation, and Guangdong Key Technologies for AD Diagnostic and Treatment of Brain (2018B030336001) to E.X.W..References
1. Valentin, A., et al. Responses to single pulse electrical stimulation identify epileptogenesis in the human brain in vivo. Brain 125, 1709-1718 (2002).
2. Halassa, M.M., et al. Selective optical drive of thalamic reticular nucleus generates thalamic bursts and cortical spindles. Nat Neurosci 14, 1118-1120 (2011).
3. Bartho, P., et al. Ongoing network state controls the length of sleep spindles via inhibitory activity. Neuron 82, 1367-1379 (2014).
4. Bitzenhofer, S.H., et al. Layer-specific optogenetic activation of pyramidal neurons causes beta-gamma entrainment of neonatal networks. Nat Commun 8, 14563 (2017).
5. Wilmerding, L.K., Yazdanbakhsh, A. & Hasselmo, M.E. Impact of optogenetic pulse design on CA3 learning and replay: A neural model. Cell Rep Methods 2, 100208 (2022).
6. Akam, T., Oren, I., Mantoan, L., Ferenczi, E. & Kullmann, D.M. Oscillatory dynamics in the hippocampus support dentate gyrus-CA3 coupling. Nat Neurosci 15, 763-768 (2012).
7. Bitzenhofer, S.H., et al. Layer-specific optogenetic activation of pyramidal neurons causes beta-gamma entrainment of neonatal networks. Nat Commun 8, 14563 (2017).
8. Fernandez, L.M.J., et al. Cortical afferents onto the nucleus Reticularis thalami promote plasticity of low-threshold excitability through GluN2C-NMDARs. Sci Rep 7, 12271 (2017).
9. Leong, A.T.L., Wang, X., Wong, E.C., Dong, C.M. & Wu, E.X. Neural activity temporal pattern dictates long-range propagation targets. Neuroimage 235, 118032 (2021).
10. Leong, A.T., et al. Long-range projections coordinate distributed brain-wide neural activity with a specific spatiotemporal profile. Proc Natl Acad Sci U S A 113, E8306-E8315 (2016).
11. Chan, R.W., et al. Low-frequency hippocampal-cortical activity drives brain-wide resting-state functional MRI connectivity. Proc Natl Acad Sci U S A 114, E6972-E6981 (2017).
12. Weitz, A.J., Lee, H.J., Choy, M. & Lee, J.H. Thalamic Input to Orbitofrontal Cortex Drives Brain-wide, Frequency-Dependent Inhibition Mediated by GABA and Zona Incerta. Neuron 104, 1153-1167 e1154 (2019).
13. Leong, A.T.L., et al. Optogenetic fMRI interrogation of brain-wide central vestibular pathways. Proc Natl Acad Sci U S A 116, 10122-10129 (2019).
14. Liang, Z., et al. Mapping the functional network of medial prefrontal cortex by combining optogenetics and fMRI in awake rats. Neuroimage 117, 114-123 (2015).
15. Albaugh, D.L., et al. Functional Magnetic Resonance Imaging of Electrical and Optogenetic Deep Brain Stimulation at the Rat Nucleus Accumbens. Scientific reports 6, 31613 (2016).
16. Grandjean, J., et al. A brain-wide functional map of the serotonergic responses to acute stress and fluoxetine. Nat Commun 10, 350 (2019).
17. Gonzalez-Castillo, J., et al. Whole-brain, time-locked activation with simple tasks revealed using massive averaging and model-free analysis. Proc Natl Acad Sci U S A 109, 5487-5492 (2012).
18. Boido, D., et al. Mesoscopic and microscopic imaging of sensory responses in the same animal. Nat Commun 10, 1110 (2019).
19. El-Boustani, S., et al. Anatomically and functionally distinct thalamocortical inputs to primary and secondary mouse whisker somatosensory cortices. Nat Commun 11, 3342 (2020).
20. Lee, J.H., et al. Global and local fMRI signals driven by neurons defined optogenetically by type and wiring. Nature 465, 788-792 (2010).
21. Sherman, S.M. Thalamus plays a central role in ongoing cortical functioning. Nature Neuroscience 19, 533-541 (2016).
22. Veldhuizen, M.G., et al. Identification of an Amygdala-Thalamic Circuit That Acts as a Central Gain Mechanism in Taste Perceptions. J Neurosci 40, 5051-5062 (2020).
23. Roy, D.S. Inhibitory Central Amygdala Outputs to Thalamus Control the Gain of Taste Perception. J Neurosci 40, 9166-9168 (2020).
24. Kweon, H., et al. Excitatory neuronal CHD8 in the regulation of neocortical development and sensory-motor behaviors. Cell Rep 34, 108780 (2021).
25. Li, R., et al. Temporal Lobe Epilepsy Shows Distinct Functional Connectivity Patterns in Different Thalamic Nuclei. Brain Connect 11, 119-131 (2021).
26. Yonk, A.J. & Margolis, D.J. Traces of Learning in Thalamocortical Circuits. Neuron 103, 175-176 (2019).
27. Aronoff, R., et al. Long-range connectivity of mouse primary somatosensory barrel cortex. Eur J Neurosci 31, 2221-2233 (2010).
28. Lim, M., Jassar, H., Kim, D.J., Nascimento, T.D. & DaSilva, A.F. Differential alteration of fMRI signal variability in the ascending trigeminal somatosensory and pain modulatory pathways in migraine. J Headache Pain 22, 4 (2021).
29. Orenius, T.I., et al. The interaction of emotion and pain in the insula and secondary somatosensory cortex. Neuroscience 349, 185-194 (2017).
Figures