1267
Whole Body Mouse EPR Oxygen Imaging of Implanted Beta Cell Replacement Devices
Mrignayani Kotecha1, Navin Viswakarma1, Safa Hameed1, Eliyas Siddiqui1, Feya Epel1, Cherie Stabler2, Minglin Ma3, and Boris Epel4
1Oxygen Measurement Core, O2M Technologies, LLC, Chicago, IL, United States, 2Department of Biomedical Engineering, University of Florida, Gainesville, IL, United States, 3Cornell University, Ithaca, NY, United States, 4Radiation and Cellular Oncology, The University of Chicago, Chicago, IL, United States
1Oxygen Measurement Core, O2M Technologies, LLC, Chicago, IL, United States, 2Department of Biomedical Engineering, University of Florida, Gainesville, IL, United States, 3Cornell University, Ithaca, NY, United States, 4Radiation and Cellular Oncology, The University of Chicago, Chicago, IL, United States
Synopsis
Keywords: Quantitative Imaging, Electron Paramagnetic Resonance, Oxygen Imaging, EPR imaging, Type I diabetes, cell encapsulation devices
Beta-cell replacement therapy remains the only approach with a clinical proof-of-concept that demonstrates long-term insulin independence can be achieved in type 1 diabetic (T1D) patients. The major challenge for beta cell replacement devices is to keep cells viable by avoiding hypoxia until vascularization is established. We hypothesize that by performing oxygen imaging and controlling the oxygenation of the devices early on, we can achieve better survival of beta cells and, consequently, better T1D reversal. EPROI is a quantitative oxygen imaging method that was used for obtaining pO2 maps in three different beta cell replacement devices in this study.Target Audience
All members of the magnetic resonance community.Purpose
The present work aims to develop and optimize the framework for whole-body mouse oxygen imaging and utilize it to assess implanted beta cell replacement devices.Synopsis
Beta-cell replacement therapy remains the only approach with a clinical proof-of-concept that demonstrates long-term insulin independence can be achieved in type 1 diabetic (T1D) patients. The major challenge for beta cell replacement devices is to keep cells viable by avoiding hypoxia until vascularization is established. We hypothesize that by performing oxygen imaging and controlling the oxygenation of the devices early on, we can achieve better survival of islets and, consequently, better T1D reversal.Materials and Methods
All partial oxygen pressure (pO2) maps were acquired using O2M’s small animal oxygen imager, JIVA-25 (Figure 1) which works on the principles of pulse electron paramagnetic resonance oxygen imaging (EPROI) 1,2. JIVA-25 provides three-dimensional pO2 maps with high spatial, temporal, and pO2 resolution. For reporting oxygen concentration, JIVA-25 uses injectable trityl radical OX071 with relaxation rates R1 linearly related to the absolute pO2. JIVA-25 is fitted with an animal monitoring and heating system and beds with position fiducials for registration (Figure 1B-C) (2). Devices: Three devices were analyzed in this study (a) commercially available immune-isolating membrane, TheraCyte 3, (b) oxygen generating OxySite 4, and (c) inverse breathing encapsulation device (iBED) 5. The devices were either acellular or loaded with 500 IEQ rat islets. Mice and islets: Animal experiments were performed under an approved protocol from UIC’s IACUC. Devices were implanted in 8-week-old C57BL/6J males in the subcutaneous region at the dorsal side. Freshly isolated islets from Sprague Dawley rats were used for experiments with islets. Trityl injection: Trityl OX071 was administered either intravenously (i.v.) or intraperitoneally (i.p.). MRI:Anatomical T2w MRI experiments were performed using a 9.4T instrument located UIC’s RRC facility. EPROI: pO2 maps were obtained using pulse IRESE sequence 1. 654 equal solid angle projections were acquired with maximum gradient of 15 mT/m and an isotropic field of view of 4.24 cm. Images were reconstructed using filtered back projection algorithm. MRI images were registered with pO2 maps using a custom-built MATLAB program.Results and Discussion
Figure 2 shows the change in mean pO2 over 4 weeks for acellular control and active OxySite devices (n = 4 per group) implanted subcutaneously in non-diabetic mice. The active device contains CaO2, which reacts with water to generate oxygen 4. The average pO2 showed active device had statistically higher pO2compared to the control until week four. At week four, all harvested constructs were engulfed with soft tissue which may have led to a drop in pO2 level in active constructs. Figure 3 shows data from a pilot pO2 imaging study with active and control iBED devices (n = 2 per group) for four weeks. The average pO2 was higher in the active group until week three compared to the control. Visually, more soft tissue with new blood vessels were observed in the control group after the devices were harvested at week four, which correlates with the increase in oxygen level in the control group at week four. Figure 4 shows the mean pO2 as a function of time for TheraCyte devices (n = 3) encapsulated with 500 IEQ rat islets implanted subcutaneously in non-diabetic mice. Retrieved devices showed more adherent fibrotic tissue in mouse 2 compared to the mouse 1 and 3, explaining lower pO2 in mouse 2. In a pilot experiment with STZ induced diabetic mice model, control OxySite loaded with 500 IEQ of rat islets were also imaged. Figure 5 shows a representative pO2 maps at day 1 after implantation in an animal. Lower pO2 in the device is indicative of active cells.Conclusions
We developed and optimized whole-body mouse oxygen imaging of implanted devices and performed proof-of-concept experiments with three different devices. This study is a precursor of future study that will involve diabetic animals and large sample size to correlate the device pO2 with the device performance.Acknowledgements
JDRF 3-SRA-2020-883-M-B grant to O2M (PI: Kotecha).References
(1) Epel et al., J. Mag Reson. 280:149-157, 2017. (2) Oxygen Imaging Instrument, US patent serial No. 29/811,661; Animal Temperature Control Apparatus and Methods Thereof, US Patent application, serial no. 29/814,816 and 63/277,344; Assignee: O2M Technologies, LLC; (3) https://theracyte.com. (4) Coronel et al., Biomaterials, 129:139-151, 2017. (5) Wang et al., Sci. Adv. Eabd5835, 2021.Figures
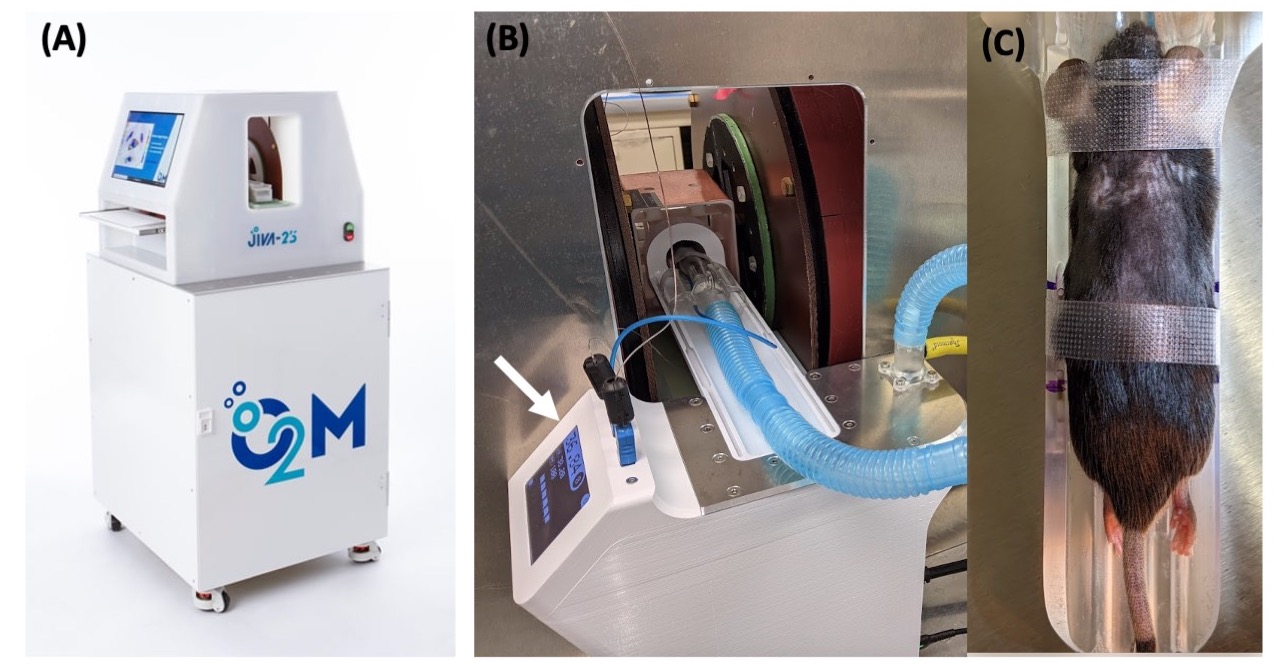
Figure 1: (a) JIVA-25 preclinical oxygen imager used in the experiments, (B) a mouse being imaged, the arrow shows animal heating and monitoring system, (C) an animal bed with position fiducials for registration of images with MRI.
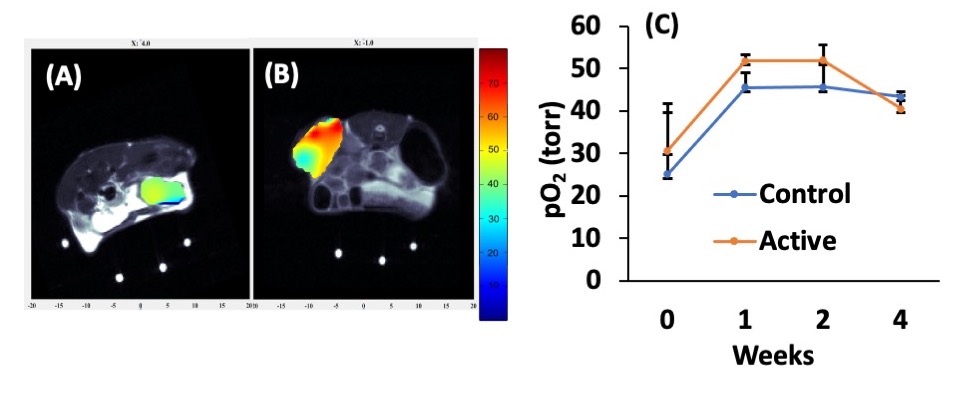
Figure 2: Representative pO2 maps of (A) control and (B) active acellular OxySite devices overlayed on MRI. (C) Weekly average pO2 values.
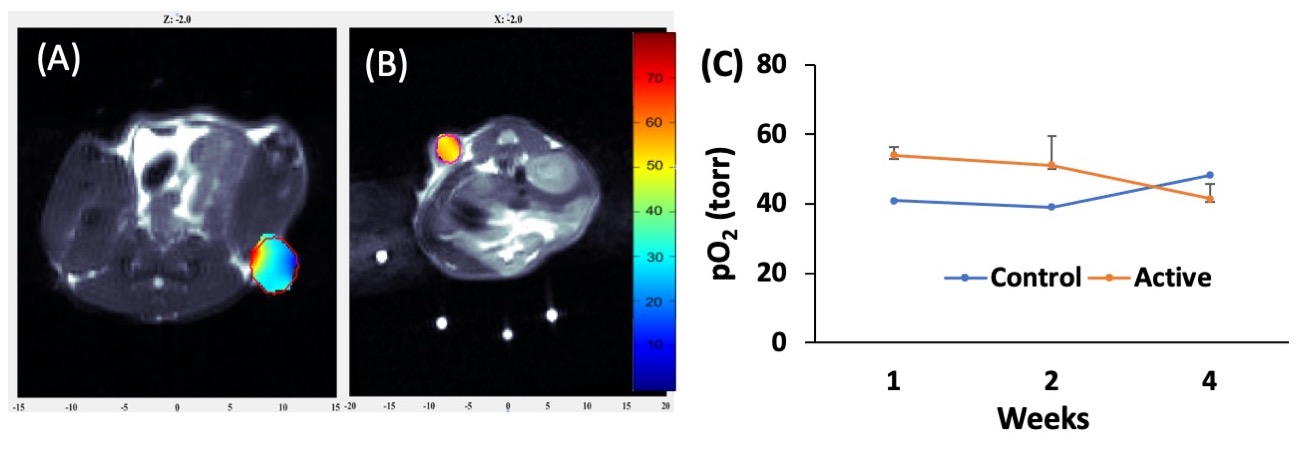
Figure 3: Representative pO2 maps of acellular control (A) and active (B) iBED devices. (C) Weekly average pO2 values.
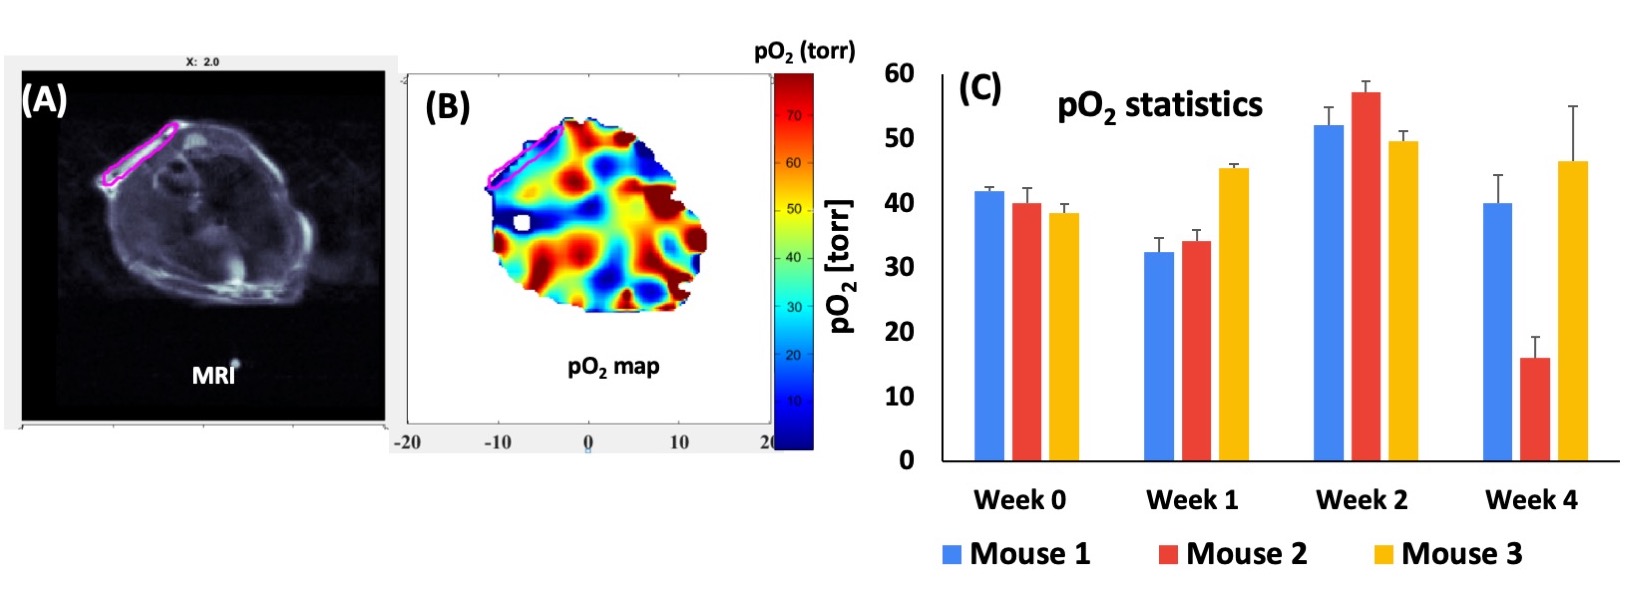
Figure 4: A representative MRI (A) and a pO2 map (B) of an islet loaded TheraCyte, (C) the change in pO2 as a function of time.
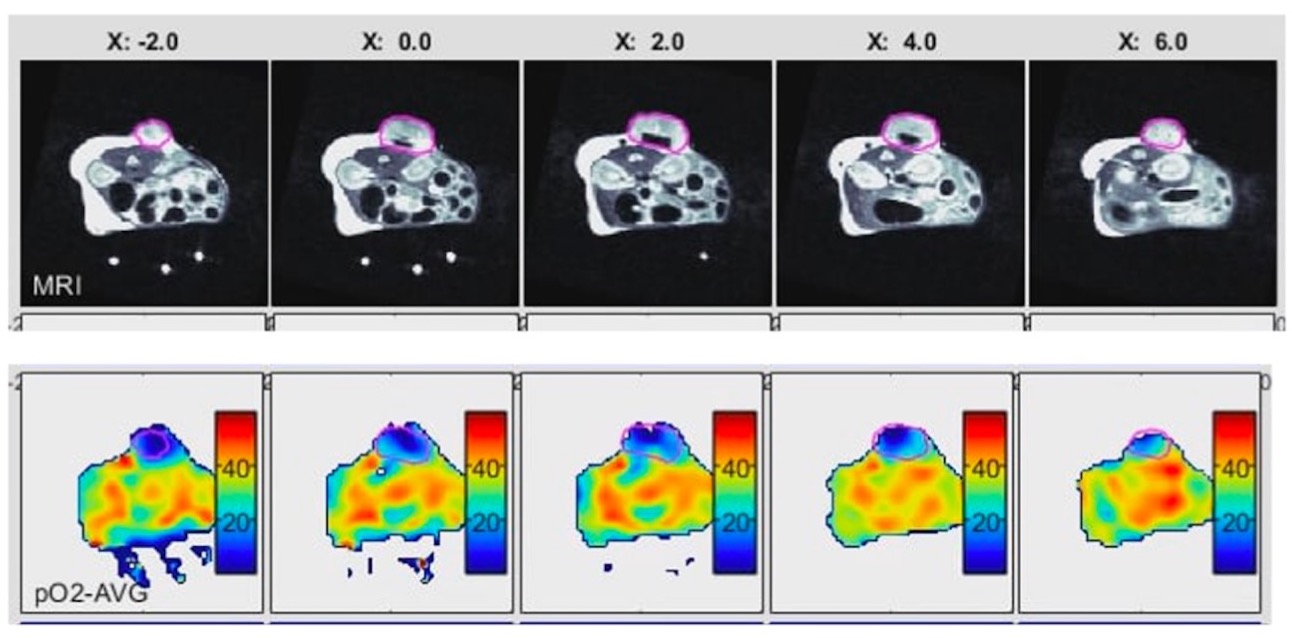
Figure 5: Axial slices of MRI (upper panel) and EPROI (bottom panel) of a control OxySite device loaded with 500 IEQ rat islets at day 1 after implantation. The device is clearly hypoxia at day 1 indicating active cells.
DOI: https://doi.org/10.58530/2023/1267