1266
Evaluation of tumor physiology after single-fraction irradiation in a mouse model of pancreatic ductal adenocarcinoma using mpMRI
Ramesh Paudyal1, James Rusell1, Eve LoCastro1, Carl C. Lekaye1, Joseph O. Deasy1, John L. Humm1, and Amita Shukla-Dave1,2
1Medical Physics, Memorial Sloan Kettering Cancer Center, New York, NY, United States, 2Radiology, Memorial Sloan Kettering Cancer, New York, NY, United States
1Medical Physics, Memorial Sloan Kettering Cancer Center, New York, NY, United States, 2Radiology, Memorial Sloan Kettering Cancer, New York, NY, United States
Synopsis
Keywords: Quantitative Imaging, Preclinical
Pancreatic ductal adenocarcinoma (PDAC) is the leading cause of cancer deaths worldwide. Quantitative multiparametric magnetic resonance imaging (mpMRI) allows for measuring the tumor's physiological characteristics, such as cellularity and vascularity/permeability. This study aimed to evaluate tumor physiology using mpMRI after single-fraction irradiation in a mouse model. The results demonstrated the changes in the functional status of mpMRI metrics. They were validated with in vivo histology markers of tumor perfusion (Hoechst 33342) and tissue morphology (Hematoxylin and eosin staining).Purpose
The stroma, a hallmark of pancreatic ductal adenocarcinoma (PDAC), forms a mechanistic barrier to effective drug delivery 1. Multiparametric (mp) magnetic resonance imaging (MRI), including diffusion-weighted (DW)- and dynamic contrast-enhanced (DCE)-MRI, exhibits the potential to assess tumor physiology in a mouse model of PDAC 2-4. Significant changes in relative apparent diffusion coefficient (ADC, surrogate of tumor cellularity) and volume transfer constant (Ktrans, surrogate of tumor vascularity/permeability) values one day after a single fraction of irradiation have been reported in animal models of cerebral tumors5,6. The present study aimed to evaluate the changes in tumor vascularity and cellularity within 20 hours after a single fraction of irradiation (10 Gy) using mpMRI in a mouse model of PDAC.Methods
Animals and Tumor Models: All animal procedures were approved by the Institutional Animal Care and Use Committee (IACUC) of Memorial Sloan Kettering Cancer Center. Tumors were established by injecting 2×10⁵ KPC 4662 subcutaneously into the right shoulder region of athymic mice (n=5). The cells were originally derived from a murine pancreatic tumor, genotype Pdx1-Cre; LSL KRASG12D; Trp53R172H/wt7. The mpMRI was performed 10-12 days after tumor inoculation. MRI data were acquired before (pre-treatment [Tx]) and within 20 hours after irradiation (post-Tx).MRI Data Acquisition: DW and DCE, followed by the T2-weighted MRI acquisition, were performed on a 7.0 T (Bruker BioSpin MRI GmbH). DW images were acquired with 7 b-values with TR/TE = 1500/ 20.12 ms, NS = 8-10; MS = 192x96, NA =1, NS=6, slice thickness=0.8 mm8. DCE-MRI images were acquired using a FLASH sequence (TR/TE=54.63/1.29 ms, NA=1, NS=6, flip angle (FA)=15°, MS=132×106). After acquiring 20 precontrast images, 0.1 mL of contrast agent was injected at a constant rate via a tail vein catheter8. Four TR values, i.e., 100, 200, 800, and 2000 ms, were used for T10 mapping, and other scanning parameters were the same as mentioned above.
Irradiation: Tumor-bearing mice were locally irradiated with a dose of 10 Gy administered by a dedicated small animal radiotherapy device (Precision X-Ray Inc, Madison, CT)9. Treatment was delivered using a photon beam (225 kV, 13 mA, 3 mm Cu), with a dose rate of approximately 3 Gy/min when using a 10 mm diameter collimator. Mice received continuous isoflurane gas anesthesia (2% isoflurane, 1l/minute in air). Histology: Tumor-bearing mice were injected intravenously with 0.1 ml Hoechst 33342 (10 mg/ml in saline) and euthanized by CO2 inhalation after 1 minute. Tumors were removed, frozen in OCT, and sectioned at 10 um thickness. Fluorescent images of unfixed sections were acquired using an Olympus microscope, where blue fluorescence indicates the presence of perfused vessels. Sections were subsequently stained with hematoxylin and eosin (H&E) and reimaged on brightfield.
Image Analysis: Using ITK-SNAP, regions of interest (ROIs) were manually contoured on DW- and DCE-MRI images8. The DW data were fitted to a monoexponential model (i.e., ADC (mm2/s) and intravoxel incoherent motion (IVIM) model (i.e., true and pseudo diffusion coefficients (D and D* [mm2/s]) and perfusion fraction (f). The arterial input function (taken from the neck carotid artery) was incorporated into the time course of tissue concentration data to estimate Ktrans [min-1], ve, and vp10. The mpMRI metrics values at pre-Tx and post-Tx were compared from the same mice using the paired t-test. A P-value ≤0.05 was considered statistically significant.
Results
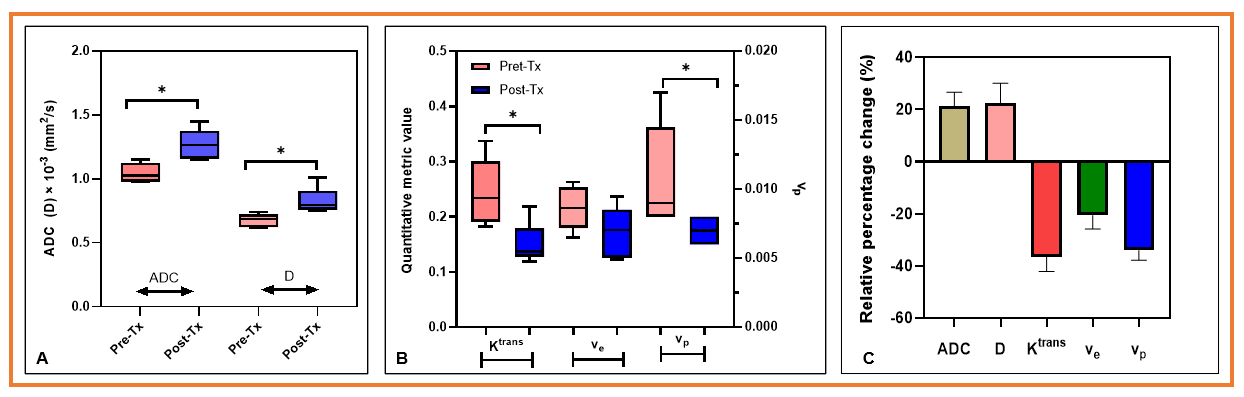
The post-Tx ADC and D values increased significantly from pre-TX (P=0.02 for ADC and P=0.04 for D, Figure 1A). Mean pre-Tx Ktrans and vp values were higher than the post-Tx (P=0.042 for Ktrans and P= 0.048 for vp, Figure 1B). D*, f, and ve exhibited a tendency towards substantial differences but were insignificant (P>0.05). The relative percentage change (%) of quantitative metric values is shown in Figure 1C. Quantitative metrics values from DW and DCE-MRI data are given in Table 1. Parametric maps of ADC, D, and Ktrans exhibited a decrease in tumor cellularity and showed reduced vessel permeability after irradiation (Figures 2 and 3). The in vivo histology markers Hoechst 33342 and H&E stained images showed that the tumors have heterogeneous perfusion and tissue morphologies (Figure 4).Discussion
Mean post-Tx ADC and D values differed from the pre-Tx by 21% and 22% after a single 10 Gy irradiation dose. In other studies on experimental PDAC tumors and a MEK inhibitor, changes in ADC correlate with tumor apoptosis2. In the present study, Ktrans, ve, and vp reduced by 37%, 20%, and 34%, respectively, consistent with Brown et al. results in a rat brain tumor after a single fraction 20 Gy stereotactic radiosurgery6, indicating radiation attributed to microvasculature destruction6. Cao et al. demonstrated that the DCE-MRI-derived metrics could reveal the sustained effect of combination drug treatment (PEGPH20+ gemcitabine)4. Tumor functional status and heterogeneity exhibited by the parametric maps are validated by in vivo histology markers of tumor vasculature (Hoechst 33342) and tissue morphology (H&E staining).Conclusion
The mpMRI-derived metrics exhibited the potential to evaluate early changes in tumor physiology (i.e., cellularity and vascularity) in response to irridation in a mouse model of PDAC.Acknowledgements
We acknowledge funding support from NCI R01 CA194321.References
1. Orth M, Metzger P, Gerum S, et al. Pancreatic ductal adenocarcinoma: biological hallmarks, current status, and future perspectives of combined modality treatment approaches. Radiation Oncology. 2019/08/08 2019;14(1):141. doi:10.1186/s13014-019-1345-6 2. Trajkovic-Arsic M, Heid I, Steiger K, et al. Apparent Diffusion Coefficient (ADC) predicts therapy response in pancreatic ductal adenocarcinoma. Sci Rep. Dec 6 2017;7(1):17038. doi:10.1038/s41598-017-16826-z 3. Vohra R, Park J, Wang Y-N, et al. Evaluation of pancreatic tumor development in KPC mice using multi-parametric MRI. Cancer Imaging. 2018;18(1):1-11. 4. Cao J, Pickup S, Clendenin C, et al. Dynamic Contrast-enhanced MRI Detects Responses to Stroma-directed Therapy in Mouse Models of Pancreatic Ductal Adenocarcinoma. Clin Cancer Res. Apr 1 2019;25(7):2314-2322. doi:10.1158/1078-0432.Ccr-18-2276 5. Larocque MP, Syme A, Yahya A, Wachowicz K, Allalunis-Turner J, Fallone BG. Temporal and dose dependence of T2 and ADC at 9.4 T in a mouse model following single fraction radiation therapy. Med Phys. Jul 2009;36(7):2948-54. doi:10.1118/1.3147258 6. Brown SL, Nagaraja TN, Aryal MP, et al. MRI-tracked tumor vascular changes in the hours after single-fraction irradiation. Radiation research. 2015;183(6):713-721. 7. Winograd R, Byrne KT, Evans RA, et al. Induction of T-cell Immunity Overcomes Complete Resistance to PD-1 and CTLA-4 Blockade and Improves Survival in Pancreatic Carcinoma. Cancer Immunol Res. Apr 2015;3(4):399-411. doi:10.1158/2326-6066.Cir-14-0215 8. Paudyal R, Russell R, Wolansky I, et al. Tumor microvasculature and microenvironment characterization in mouse models of pancreatic ductal adenocarcinoma using multiparametric MRI. 2022:2666. 9. Seed TM, Xiao S, Manley N, et al. An interlaboratory comparison of dosimetry for a multi-institutional radiobiological research project: Observations, problems, solutions and lessons learned. International Journal of Radiation Biology. 2016/02/01 2016;92(2):59-70. doi:10.3109/09553002.2015.1106024 10. Tofts PS, Brix G, Buckley DL, et al. Estimating kinetic parameters from dynamic contrast‐enhanced T1‐weighted MRI of a diffusable tracer: standardized quantities and symbols. Journal of Magnetic Resonance Imaging: An Official Journal of the International Society for Magnetic Resonance in Medicine. 1999;10(3):223-232.Figures
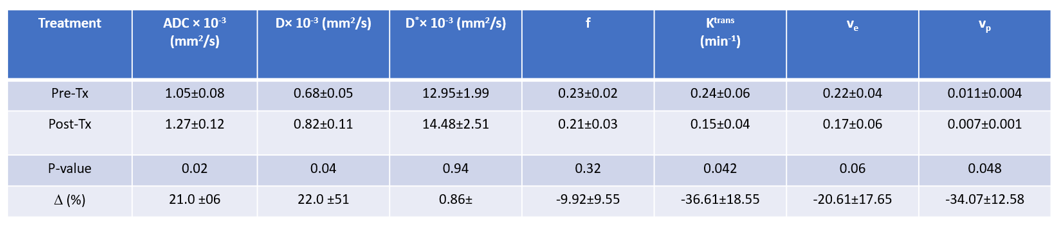
Table 1. The quantitative metrics values from
DW- and DCE- MRI data modeling
Figure
1. Box plot comparing mean metric vales between pre-Tx and post-Tx within 20 hours. (A) ADC and D values (P=0.02 for ADC ad P = 0.04 for D). (B). Mean Ktrans,
ve, and vp. Ktrans and vp
were significantly different between pre-Tx and post-Tx (P=0.04 for Ktrans and
P=0.048 for vp). ve showed a borderline significance (P=0.08). (C). Bar plot exhibiting
the relative percentage changes in mean metric values for ADC, D, Ktrans, ve, and vp between pre-Tx and post-Tx within 20
hours. Animals were treated with a dose of 10 Gy using a small animal X-ray
micro-irradiator system.
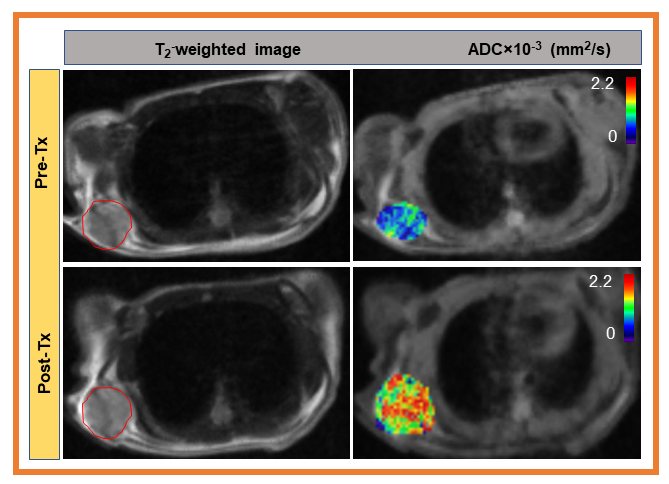
Figure 2. Left column: Representative pre-Tx and post-Tx
T2 weighted MR images from mouse models of pancreatic ductal
adenocarcinoma (red circle showing the tumor lesion). Middle column: pre-Tx and post-Tx ADC maps,
and Right column: pre-Tx and post-Tx D maps. ADC and D maps are overlaid on DW
images (b=0 s/mm2). ADC and D parametric maps exhibit the changes in
tumor cellularity after 10 Gy irradiation within 20 hrs.
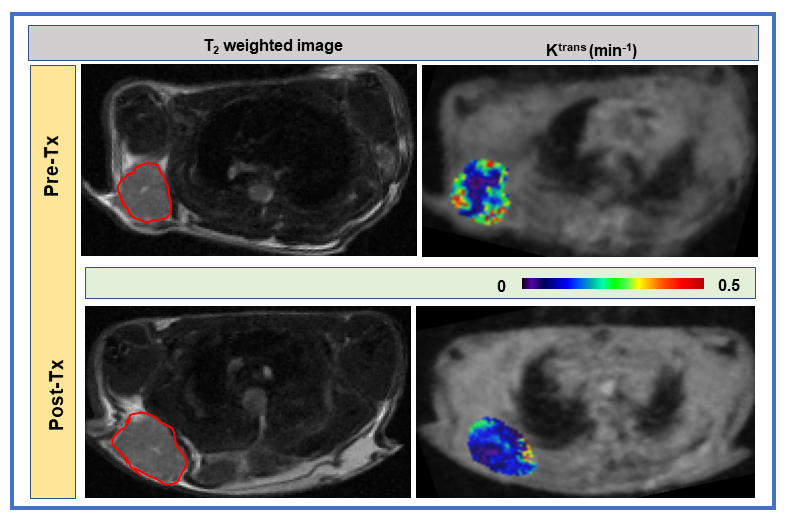
Figure 3. Left column: Representative pre-Tx
and post-Tx T2 weighted images from mouse models of pancreatic
ductal adenocarcinoma. Right column: Pre-Tx and post-Tx Ktrans maps overlaid
on pre-contrast T1 weighted dynamic image. Representative maps
depicting the decrease of vessel
permeability with 10 Gy irridation.
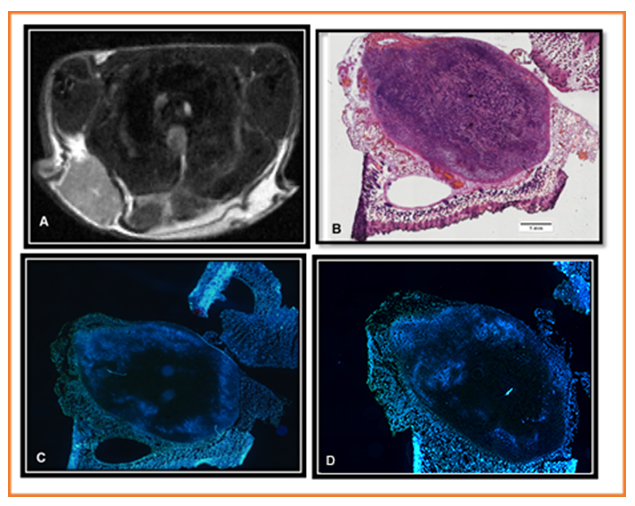
Figure 4. (A) Post T2 weighted image (B) Hematoxylin Eosin stain of a section from the
tumor, scale bar = 1 mm (C) Hoechst image showing perfused vessels from the
same depth as section (B) and (D) Hoechst image from the same tumor separated
from (C) by 400 uM. The tumor shows a consistent lack of central perfusion. Animals
were treated with a dose of 10 Gy using a small animal X-ray micro-irradiator
system.
DOI: https://doi.org/10.58530/2023/1266