1265
Assessment of Rotator Cuff Muscle Fat and Fibrosis Using Quantitative UTE Magnetization Transfer Imaging and Modeling
Arya A Suprana1,2, Qingbo Tang1,3, Elisabeth Orozco3,4, Hyungseok Jang1, Saeed Jerban1, Jiang Du1,2,5, Yajun Ma1, and Eric Y Chang1,5
1Department of Radiology, University of California, San Diego, La Jolla, CA, United States, 2Department of Bioengineering, University of California, San Diego, La Jolla, CA, United States, 3Research Service, VA San Diego Healthcare System, San Diego, CA, United States, 4Department of Orthopedic Surgery, University of California, San Diego, La Jolla, CA, United States, 5Radiology Service, Veterans Affairs San Diego Health Care System, San Diego, CA, United States
1Department of Radiology, University of California, San Diego, La Jolla, CA, United States, 2Department of Bioengineering, University of California, San Diego, La Jolla, CA, United States, 3Research Service, VA San Diego Healthcare System, San Diego, CA, United States, 4Department of Orthopedic Surgery, University of California, San Diego, La Jolla, CA, United States, 5Radiology Service, Veterans Affairs San Diego Health Care System, San Diego, CA, United States
Synopsis
Keywords: Quantitative Imaging, Muscle
At present, there is a lack of available tools to non-invasively evaluate rotator cuff muscle fibrosis. Prior studies have suggested that magnetization transfer measurements may be useful for quantifying collagen when acquired with an ultrashort echo time technique. However, the increased presence of fat after muscle injury may confound these measurements. In this study, a rat model of chronic massive rotator cuff tearing was used with UTE-T1 and UTE-MT mapping without and with fat suppression to show that muscle collagen and fibrosis could be quantified.Introduction
The rotator cuff is the primary stabilizer of the glenohumeral joint and disruption leads to abnormal joint kinematics, deterioration of function, and progression towards osteoarthritis. In clinical practice, MRI is the gold standard for the assessment of muscle quality after rotator cuff tendon tearing, but the evaluation is qualitative and limited to descriptions of atrophy and fatty infiltration. Rotator cuff muscle fibrosis predicts a poor outcome, and in cases where surgical repair of the cuff tendon is indicated, can cause substantial difficulty or entirely preclude a successful reduction. Unfortunately, at present, there is a lack of available tools to non-invasively assess muscle fibrosis. Quantitative MRI has been investigated as a potential tool for muscle evaluation. Specifically, T1 mapping has been used to monitor muscle fatty infiltration and quantitative magnetization transfer (MT) has been investigated for use in the lower extremity muscles 1-3. Recently, ultrashort echo time (UTE) MT imaging with two-pool modeling has been applied to the rotator cuff tendons, demonstrating an excellent correlation with collagen content 4. The UTE acquisition permits high signal evaluation of short T2 structures, including tendon and fibrotic regions. Challenges in the quantification of magnetization transfer exist in the presence of fat, and fat-suppression methods may have to be employed 3, 5. To our knowledge, evaluation of the rotator cuff muscles after injury with T1 mapping and MT imaging without and with fat suppression has not been previously performed. We hypothesize that quantitative UTE MRI with fat suppression can detect fibrosis in the rotator cuff muscles.Methods
Our experiment was approved by the Institutional Animal Care and Use Committee. A rat model of chronic massive rotator cuff tearing was adapted, which is known to induce muscle collagen and fibrosis 6. In brief, twelve 13-week-old Lewis rats underwent right supraspinatus and infraspinatus tenotomies with the removal of the distal 2-3 millimeters of the tendons. A thin silicone implant was placed over the greater tuberosity to prevent spontaneous tendon healing. At 20 weeks post-injury, in vivo, MR imaging of both rotator cuff muscles (injured as well as uninjured sides for internal control) was performed on a 3T MRI scanner (Bruker BioSpec 3T, Billerica, MA) using an 82 mm rat body volume coil for transmission and a 30 mm surface coil for the reception. The following sequences were performed: A) Axial oblique T1-weighted (TR/TE=522/13ms) and T2-weighted (TR/TE=2022/60ms) fat-suppressed (FS) RARE (0.2x0.2x2mm resolution), B) UTE-T1 mapping without and with chemical fat-suppression (TR/TE=12/0.026ms, FAs=4/8/12/16°, 0.5mm isotropic resolution, scan time ~5 mins per acquisition), and C) UTE-MT mapping without and with chemical fat-suppression (MT preparation with a Fermi shaped pulse with 500/1500° FAs and frequency offsets of 2/5/10/20/50 kHz, TR/TE=4/0.026ms, FA=7°, 0.5mm isotropic resolution, scan time ~3 mins per acquisition). A board-certified musculoskeletal (MSK) radiologist with 11 years of experience measured the cross-sectional areas (CSAs) of the muscles in the short axis, generated a ratio of the CSAs of injured/uninjured sides, and applied the Goutallier classification on the RARE images. A Ph.D. student, trained by an MSK radiologist to identify the boundaries of the muscles, drew regions of interest (ROIs) around the muscles, and T1 values and macromolecular fraction (MMF) values from two-pool modeling were calculated using MATLAB code. Paired t-tests were used to evaluate the differences in the groups and p<0.05 was considered significant.Results and Discussion
Figure 1 shows an example of muscle degeneration in the rat model of chronic massive rotator cuff tear. Overall, the mean CSA ratios of the injured/uninjured sides were 0.68 for the supraspinatus and 0.7 for the infraspinatus, indicating significant atrophy and success of the model. The mean Goutallier grade was 1.0 for the supraspinatus and 1.8 for the infraspinatus, indicating that the infraspinatus muscle was more degenerated. Figure 2A shows representative images of the four quantitative sequences (T1, MT, without or with fat suppression). Figure 2B shows the specified ROIs. Figure 3 shows the T1 and MT fitting curves within the ROIs specified in figure 2B. In Figure 1, a drastic difference between the injured side and the uninjured side can be seen in the infraspinatus region. In both of the non-FS images, bright signals are present in the right infraspinatus but are absent in the left infraspinatus region. In the FS images, there are no perceivable signal differences between the injured and uninjured sides. A summary of the mean T1 and MT values in the 12 rats is listed in Table 1. A general trend of lower T1 value on the injured side can be observed in all specified ROIs. A lower T1 value in the injured muscle on non-FS images is consistent with fatty infiltration, while a lower T1 value on FS images would be suggestive of fibrosis, but the differences between groups did not reach significance in our limited sample size. However, the MMF values from the UTE-MT with FS sequence in the injured infraspinatus muscle were significantly higher than in the uninjured side (10.9±0.8% vs 10.1±0.5%, p-value = 0.007), suggestive of higher collagen content and fibrosis.Conclusion
The macromolecular fraction obtained from the UTE-MT sequence with fat suppression may be helpful to evaluate rotator cuff muscle collagen content and fibrosis after tendon injury.Acknowledgements
The authors acknowledge grant support from the Veterans Affairs Clinical Science and Biomedical Laboratory R&D (I01CX001388, I01BX005952, and I01CX000625) and National Institutes of Health (R01AR068987, R01AR062581, R01AR075825, K01AR080257, R01AR079484, R01AR078877, and R21AR075851).References
1. Yang Y, Qiu L, Gu X, et al. Monitoring Rotator Cuff Muscle Fatty Infiltration Progression by Magnetic Resonance Imaging T1 Mapping. Am J Sports Med. 2022 Mar;50(4):1078-1087 2. Sinclair CDJ, Samson RS, Thomas DL, et al. Quantitative Magnetization Transfer in In Vivo Healthy Human Skeletal Muscle at 3T. Magn Reson Med. 2010 Dec;64(6):1739-48 3. Li K, Dortch RD, Kroop SF, et al. A rapid approach for quantitative magnetization transfer imaging in thigh muscles using the pulsed saturation method. Magn Reson Imaging. 2015 Jul;33(6):709-17 4. Guo T, Ma YJ, High R, et al. Assessment of an in vitro model of rotator cuff degeneration using quantitative magnetic resonance and ultrasound imaging with biochemical and histological correlation. Eur J Radiol. 2019 Dec;121:108706. 5. Li K, Dortch RD, Welch EB, et al. Multi-parametric MRI characterization of healthy human thigh muscles at 3.0 T - relaxation, magnetization transfer, fat/water, and diffusion tensor imaging. NMR Biomed. 2014 Sep;27(9):1070-84. 6. Liu X, Manzano G, Kim HT, Feeley BT. A rat model of massive rotator cuff tears. J Orthop Res. 2011 Apr;29(4):588-95Figures
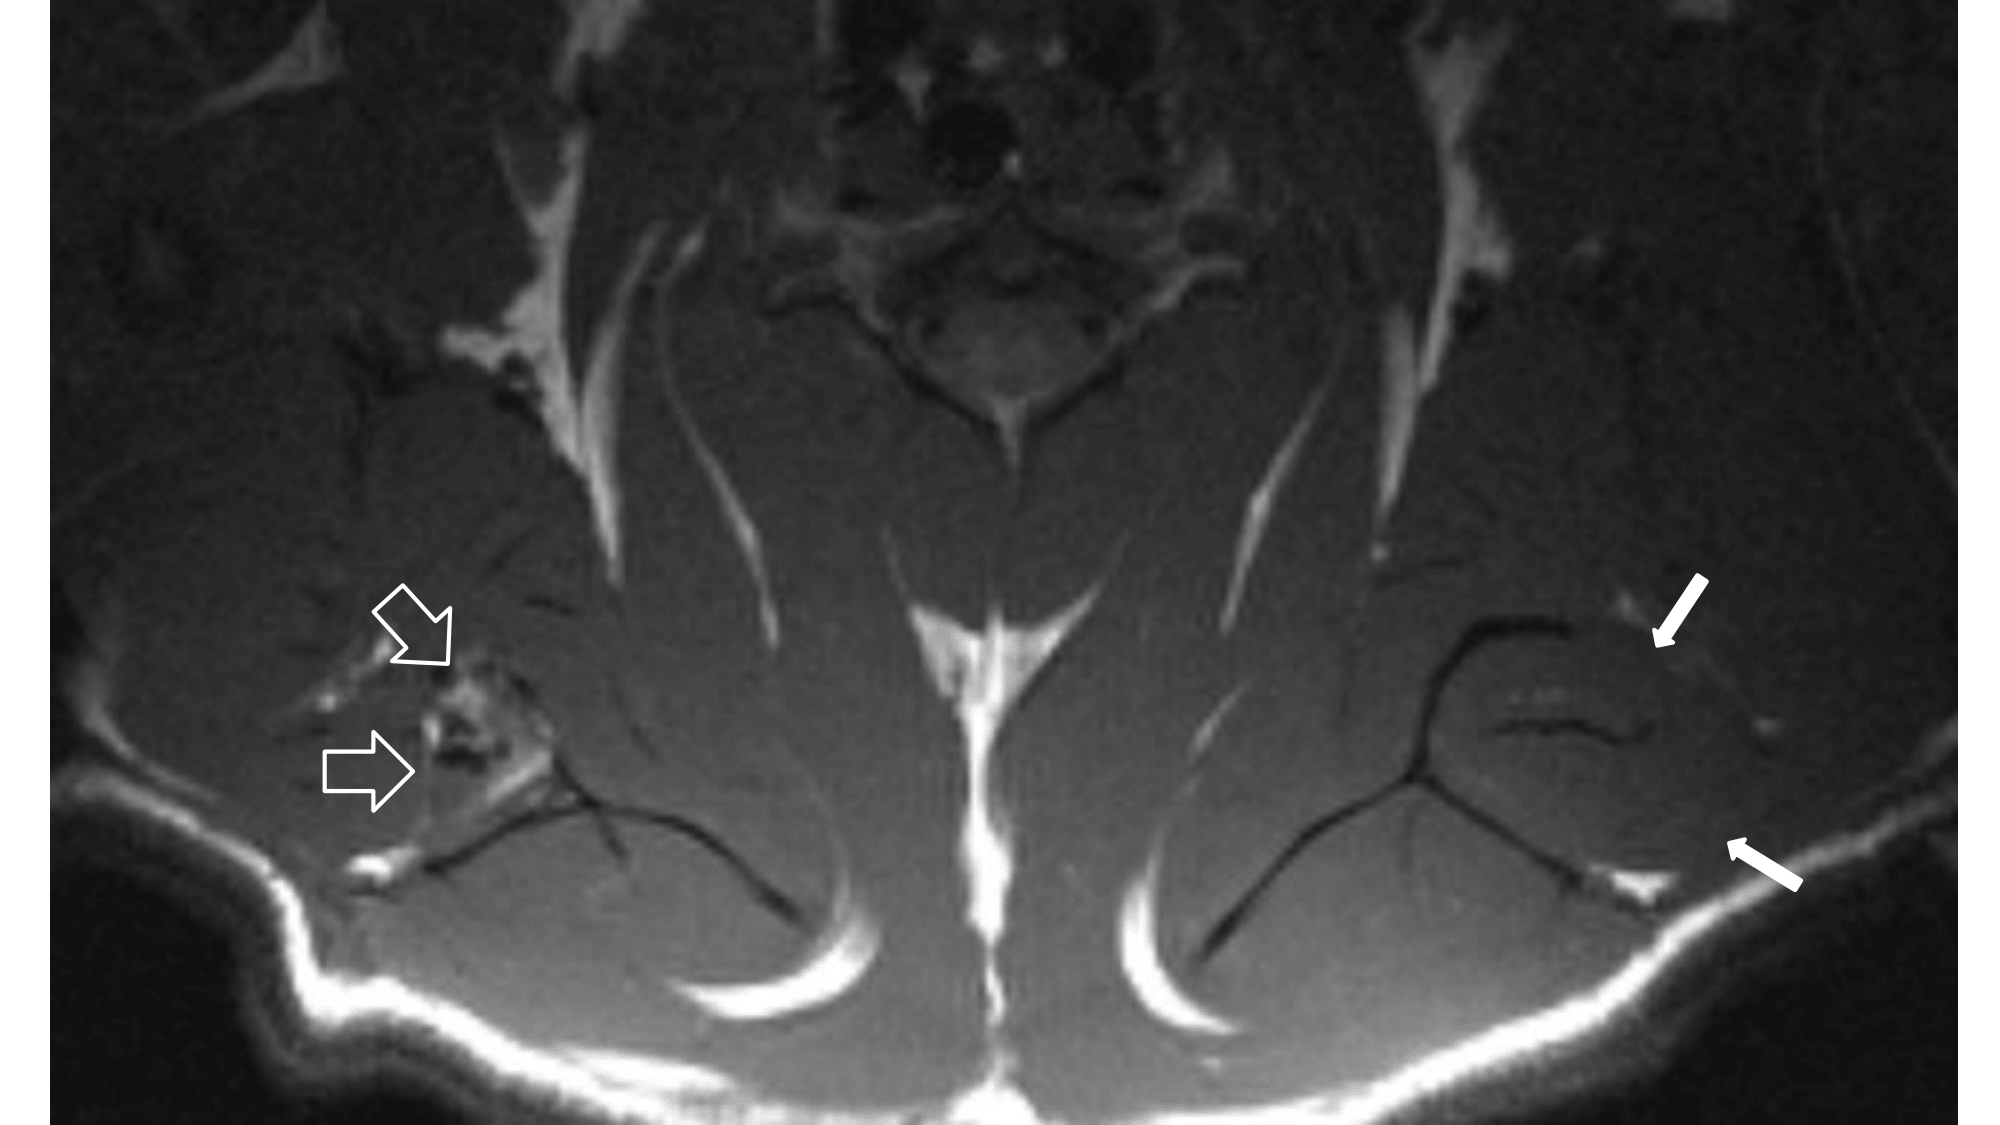
Figure 1. Axial
oblique T1-weighted RARE image shows the atrophic right rotator cuff with fatty
infiltration of the infraspinatus muscle (open arrows). In comparison, the left
infraspinatus muscle is normal in bulk and signal (arrows)
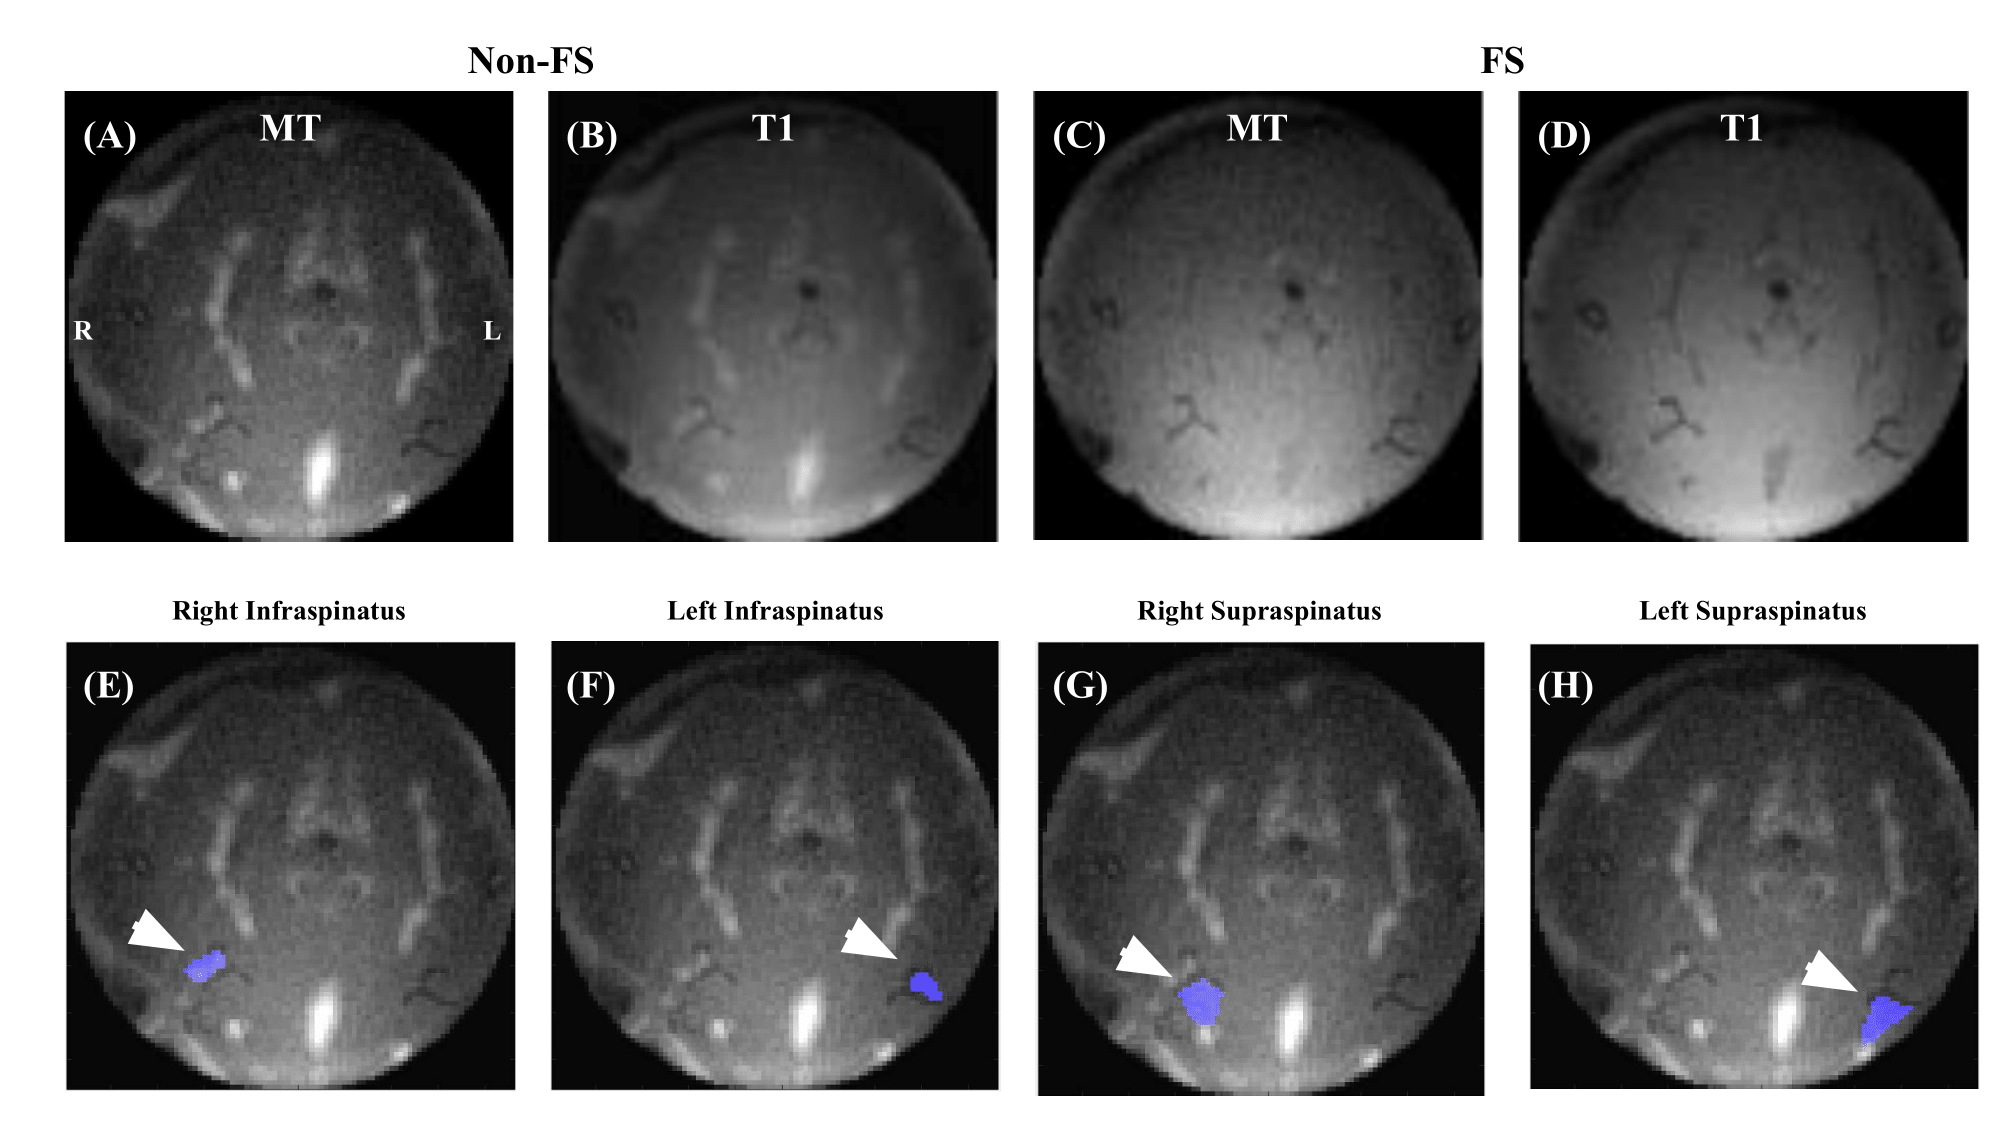
Figure 2. (A)
Representative images from Non-FS (i, ii) or FS (iii, iv) T1(ii, iv) and MT (i,
iii) sequences. (B) Representative ROI (arrowheads) of the left/right
infraspinatus and supraspinatus.
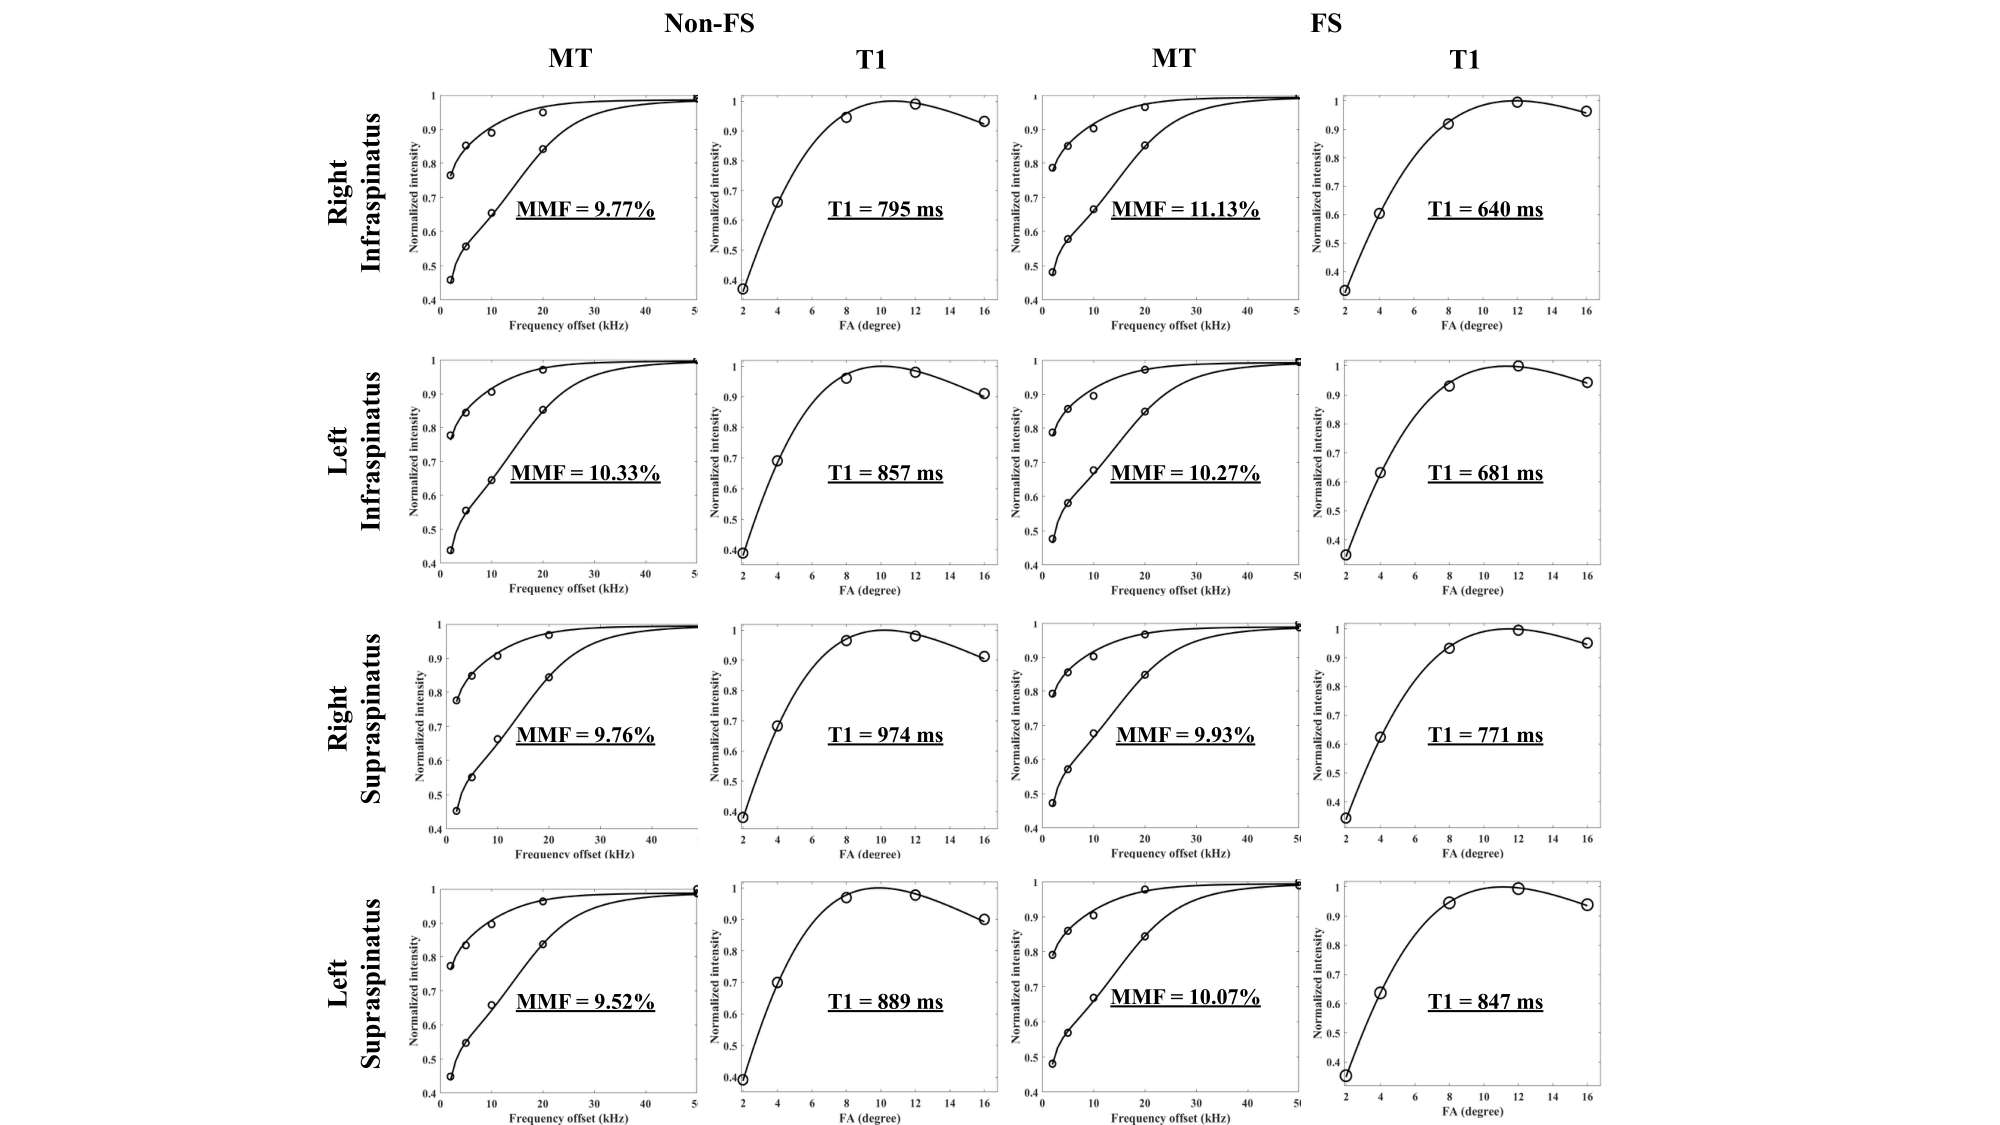
Figure 3.
Representative T1/MT fitting curves at the ROI specified in figure 2B.
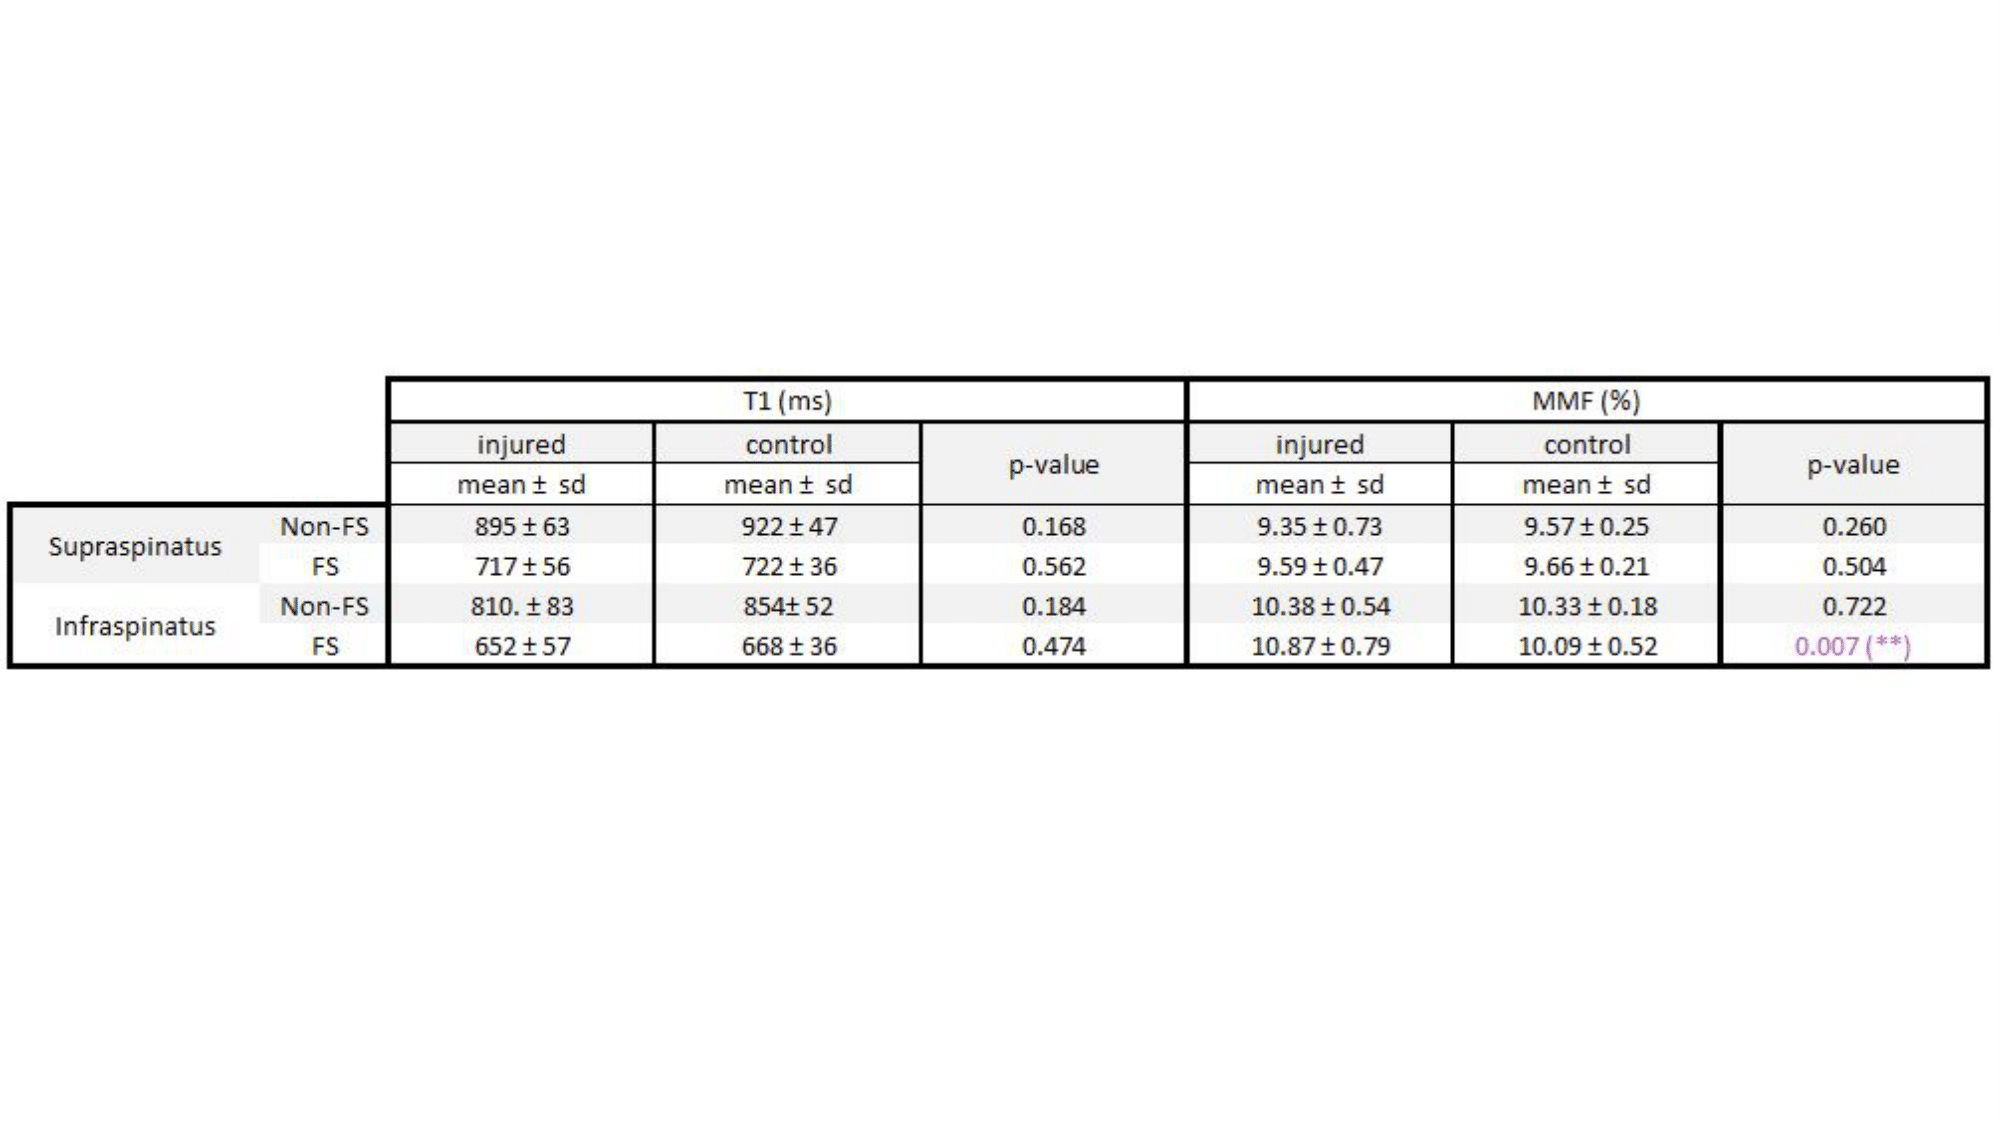
Table
1. Summary of average T1 and MMF values of different
sample groups at the specified ROIs. (**) p-value < 0.010
DOI: https://doi.org/10.58530/2023/1265