1263
Fast macromolecular proton fraction imaging based on spin-lock1Department of Imaging and Radiology, The Chinese University of Hong Kong, Hong Kong SAR, Hong Kong, 2Illuminatio Medical Technology Limited, Hong Kong SAR, Hong Kong, 3Peking University Shenzhen Hospital, Shenzhen, China
Synopsis
Keywords: Quantitative Imaging, Magnetization transfer
Macromolecular proton fraction (MPF) represents the relative amount of semi-solid macromolecules involved in magnetization transfer with free water protons. In this work, we reported a novel MPF quantification method based on spin-lock for rapid MPF mapping. The total scan time for 3D brain MPF measurement can be achieved within five minutes. We demonstrated the proposed method via simulation, phantom and in vivo experiments.Introduction
Magnetization transfer (MT) involves protons of mobile water and protons with semi-solid macromolecules1. Macromolecular proton fraction (MPF) is one of the key parameters in quantitative MT (qMT) model2, which represents the relative amount of macromolecules involved in magnetization exchange with free water protons. Several methods have been proposed to quantify MPF3–6. Recently, a novel MPF imaging method based on spin-lock (SL), termed MPF-SL, was proposed6. Here we reported a novel acquisition approach for fast MPF quantification based on spin-lock which can achieve significantly reduced scan time compared to MPF-SL. We demonstrated our fast MPF-SL method via simulation, phantom and in vivo experiments.Methods
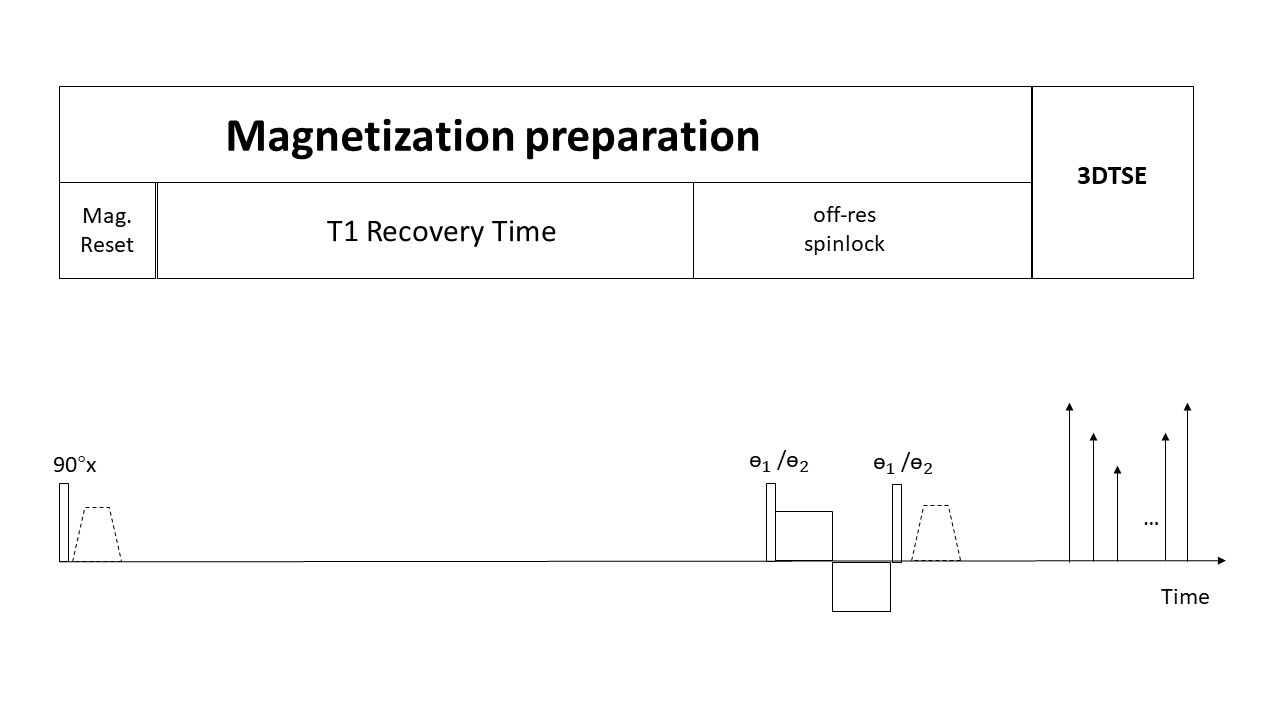
MPF contrast using MPF-SL approach can be obtained from the difference of two groups of off-resonance spin-lock R1ρ with certain SL amplitude ω1 and frequency offset Δω6: $$Rmpfsl = R1ρ(ω1(2),Δω(2))-R1ρ(ω1(1),Δω(1))$$under the condition of $$Δω(2)/ω1(2)=Δω(1)/ω1(1); Δω(i) »ω1(i)(i=1,2)$$. The magnetization during SL can be expressed as:M=Minie-R1ρTSL+M0R1cosθ/R1ρ(1-e-R1ρTSL), where Mini is initial magnetization before SL, M0 is the equilibrium magnetization, R1(=1/T1) is the longitudinal relaxation rate of water protons, TSL is time of spin-lock, and θ=atan(ω1/Δω) . As a magnetization reset RF pulse is commonly applied for nulling magnetization at the beginning of a SL pulse sequence, Mini can be expressed as Mini=M0(1-e-R1T1rec), where T1rec is recovery time after magnetization reset RF pulse.
By applying T1rec>T1 under the conditions of MPF-SL listed above, we can have: M0(1-e-R1T1rec)e-R1ρTSL»M0R1cosθ/R1ρ(1-e-R1ρTSL).
Accordingly, the SL signal equation can be simplified to a mono-exponential model: M≈Minie-R1ρTSL. As a result, MPF contrast can be obtained by only 2 acquisitions: $$Rmpfsl = R1ρ(ω1(2),Δω(2))-R1ρ(ω1(1),Δω(1))=-log(M(2)/M(1)) /TSL$$
We demonstrate our approach in brain applications. Figure 1 shows the sequence diagram. Following the ω1 and Δω selection principles in MPF-SL approach6, the SL parameters to quantify brain MPF are selected as: TSL 50 ms; ω1(i) 100 Hz and 500 Hz; Δω(i) 800 Hz and 4000 Hz for i = 1;2, respectively.
For the simulation study, Bloch-McConnell simulation was performed to investigate Rmpfsl using our proposed method as a function of MPF for brain tissue7.
All MRI scans were conducted using a 3.0 T MRI scanner (Philips Achieva, Philips Healthcare, Best, Netherlands) equipped with a 8-channel head coil (Invivo Corp, Gainesville, USA). In addition, the SL parameters used for all MRI scans were same as those mentioned above for brain MPF measurement.
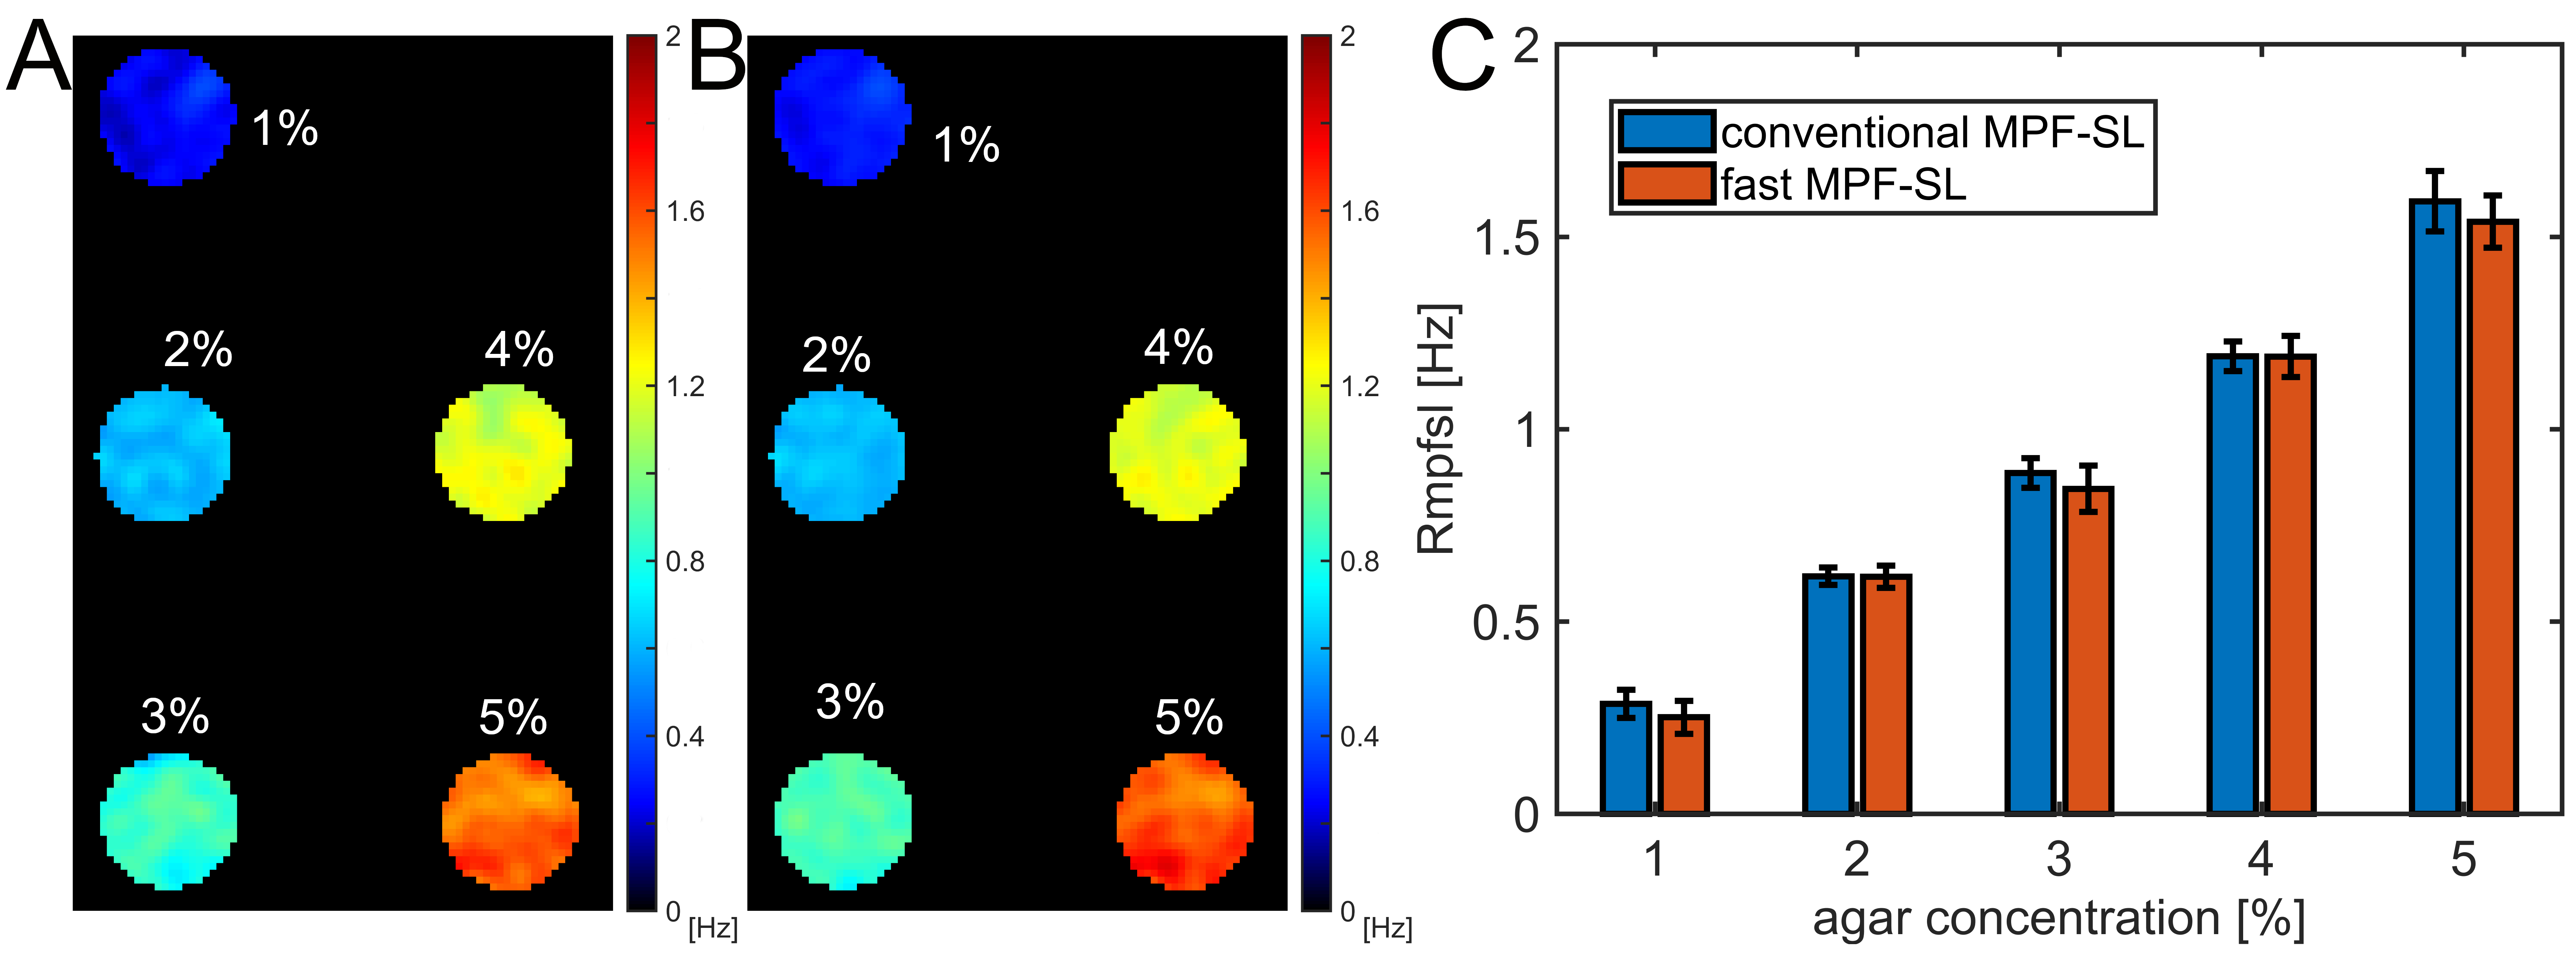
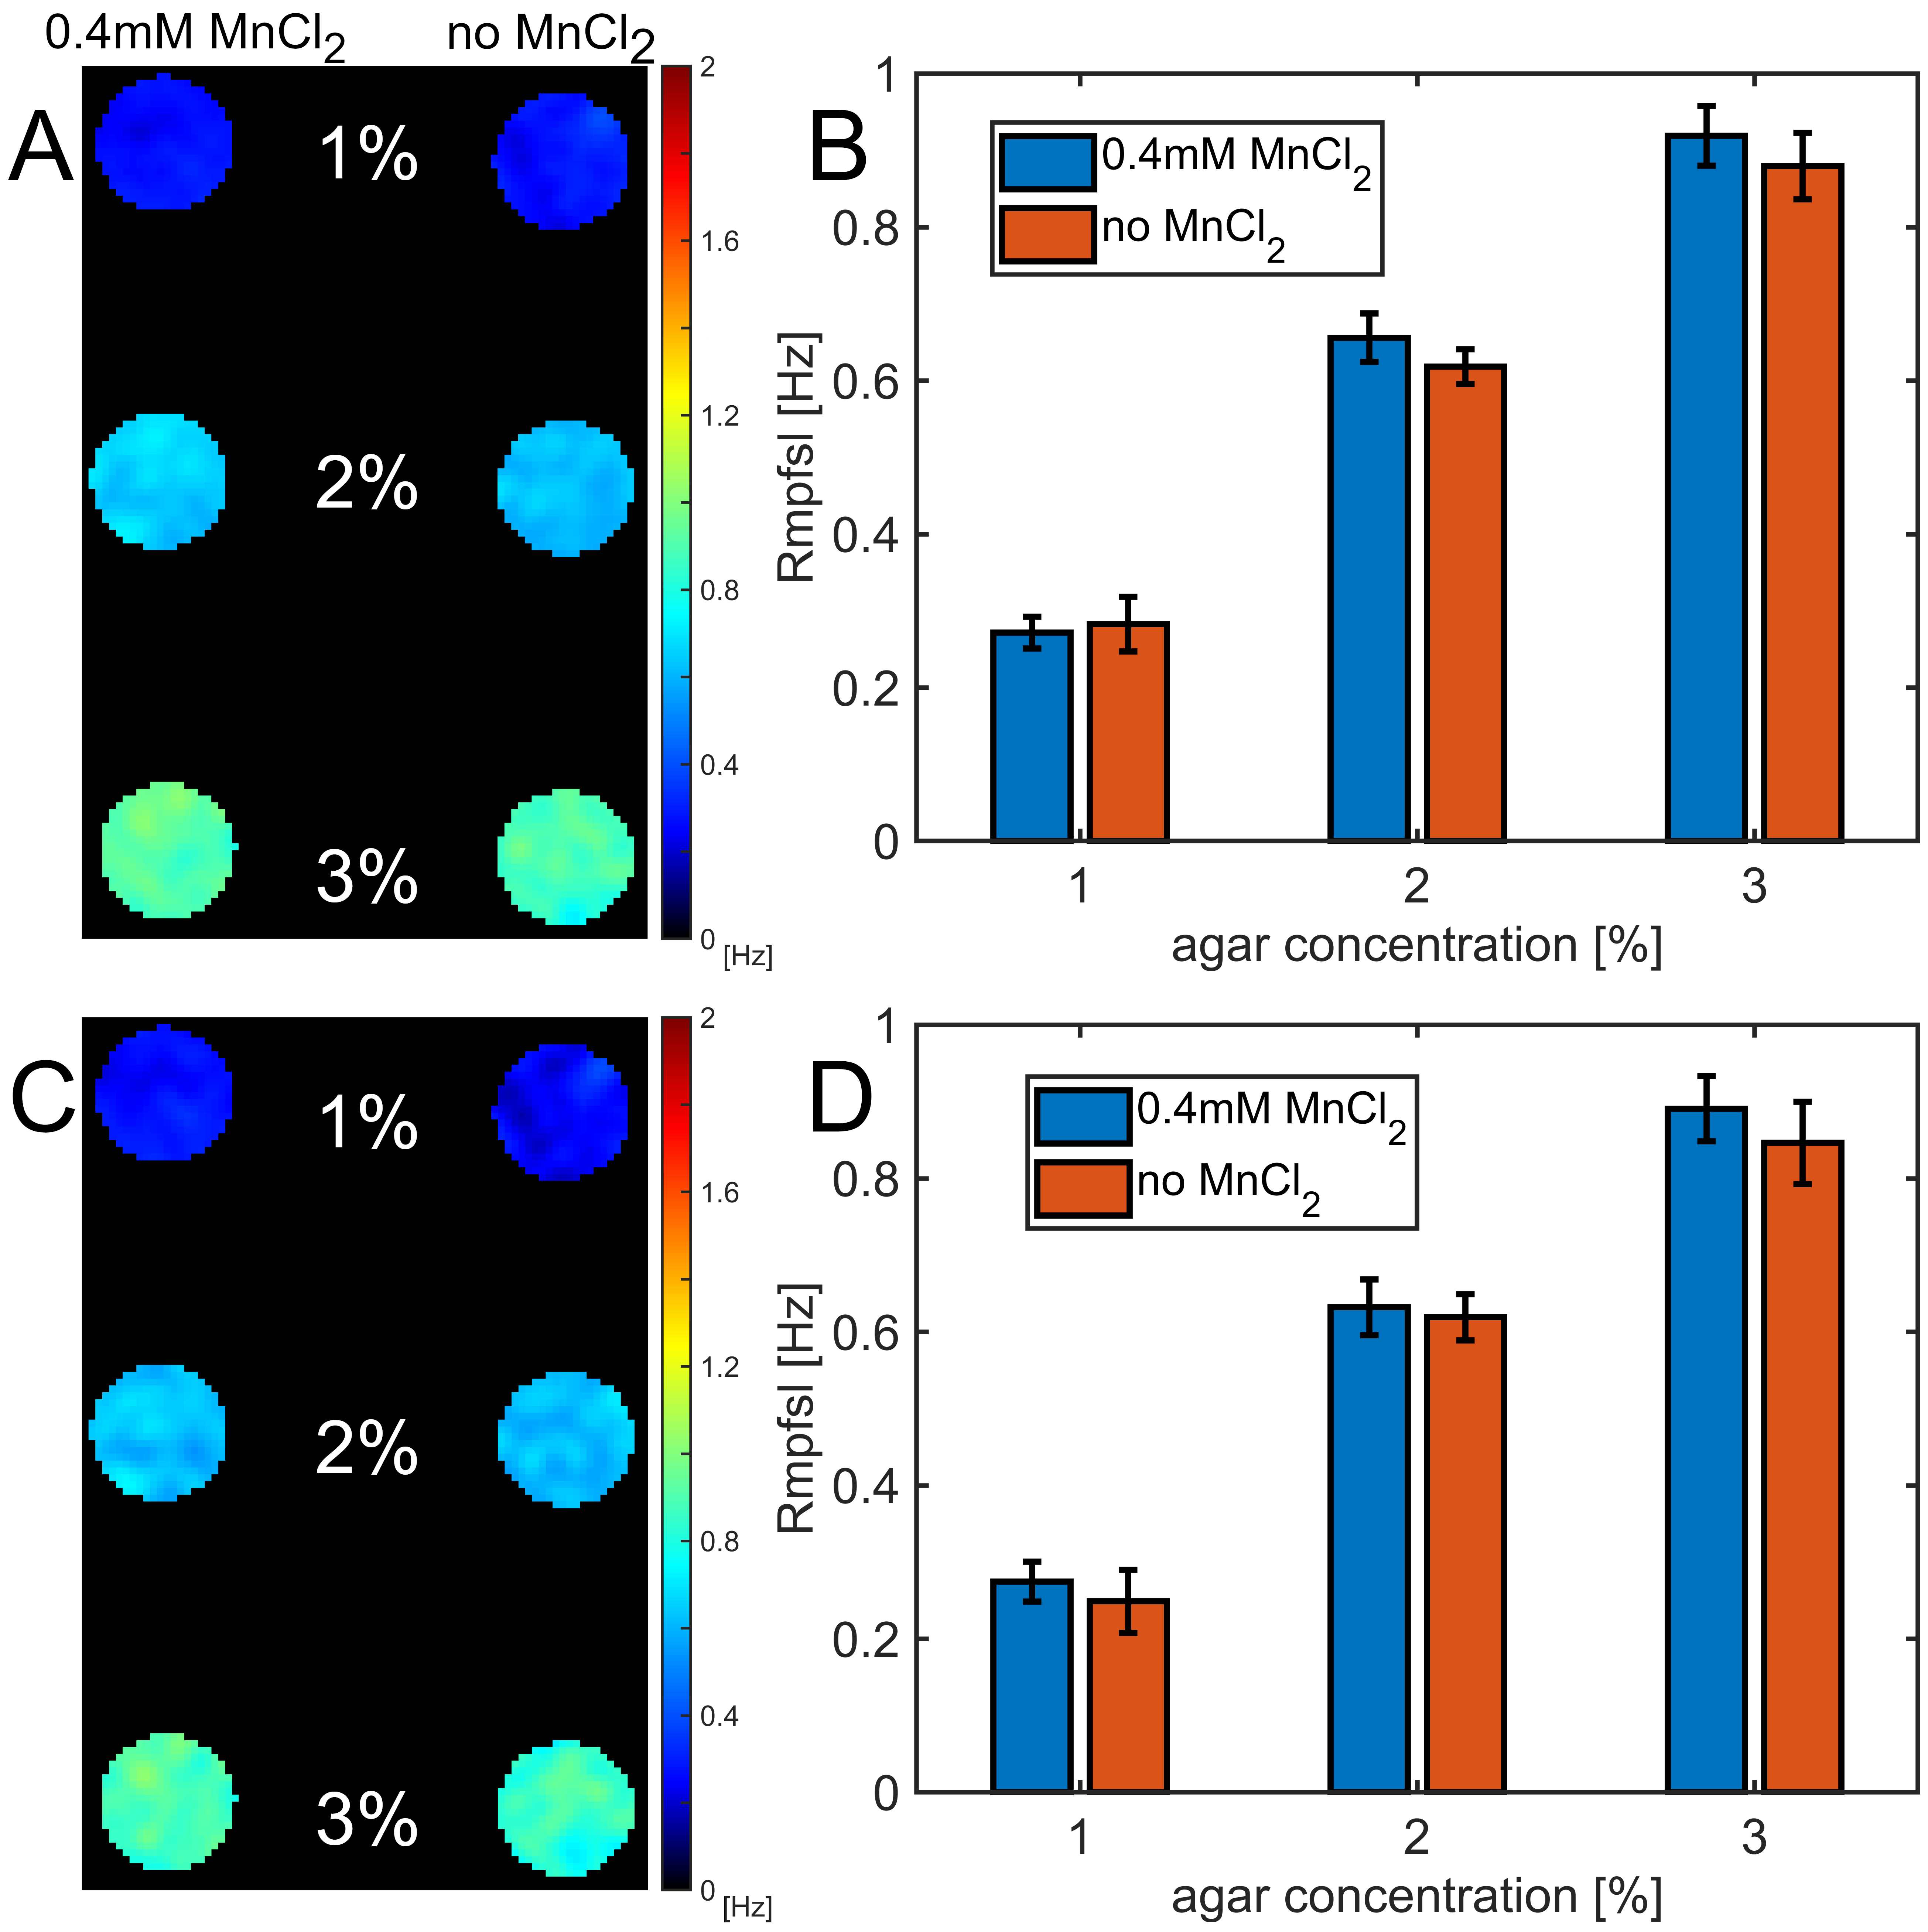
Two phantom experiments were performed. The first experiment was used to validate that our proposed fast MPF-SL approach is sensitive to MPF using five agarose phantoms with concentration from 1% to 5%. The second experiment was used to validate that the proposed fast MPF-SL method is insensitive to the relaxation of water protons using agarose phantoms with and without MnCl2 added. Imaging parameters of the fast MPF-SL method for these two phantom experiments include: resolution 2mm×2mm, slice thickness 7mm, TR/TE 2500/30 ms. Conventional MPF-SL method was also performed on phantom experiments to compare the MPF results.
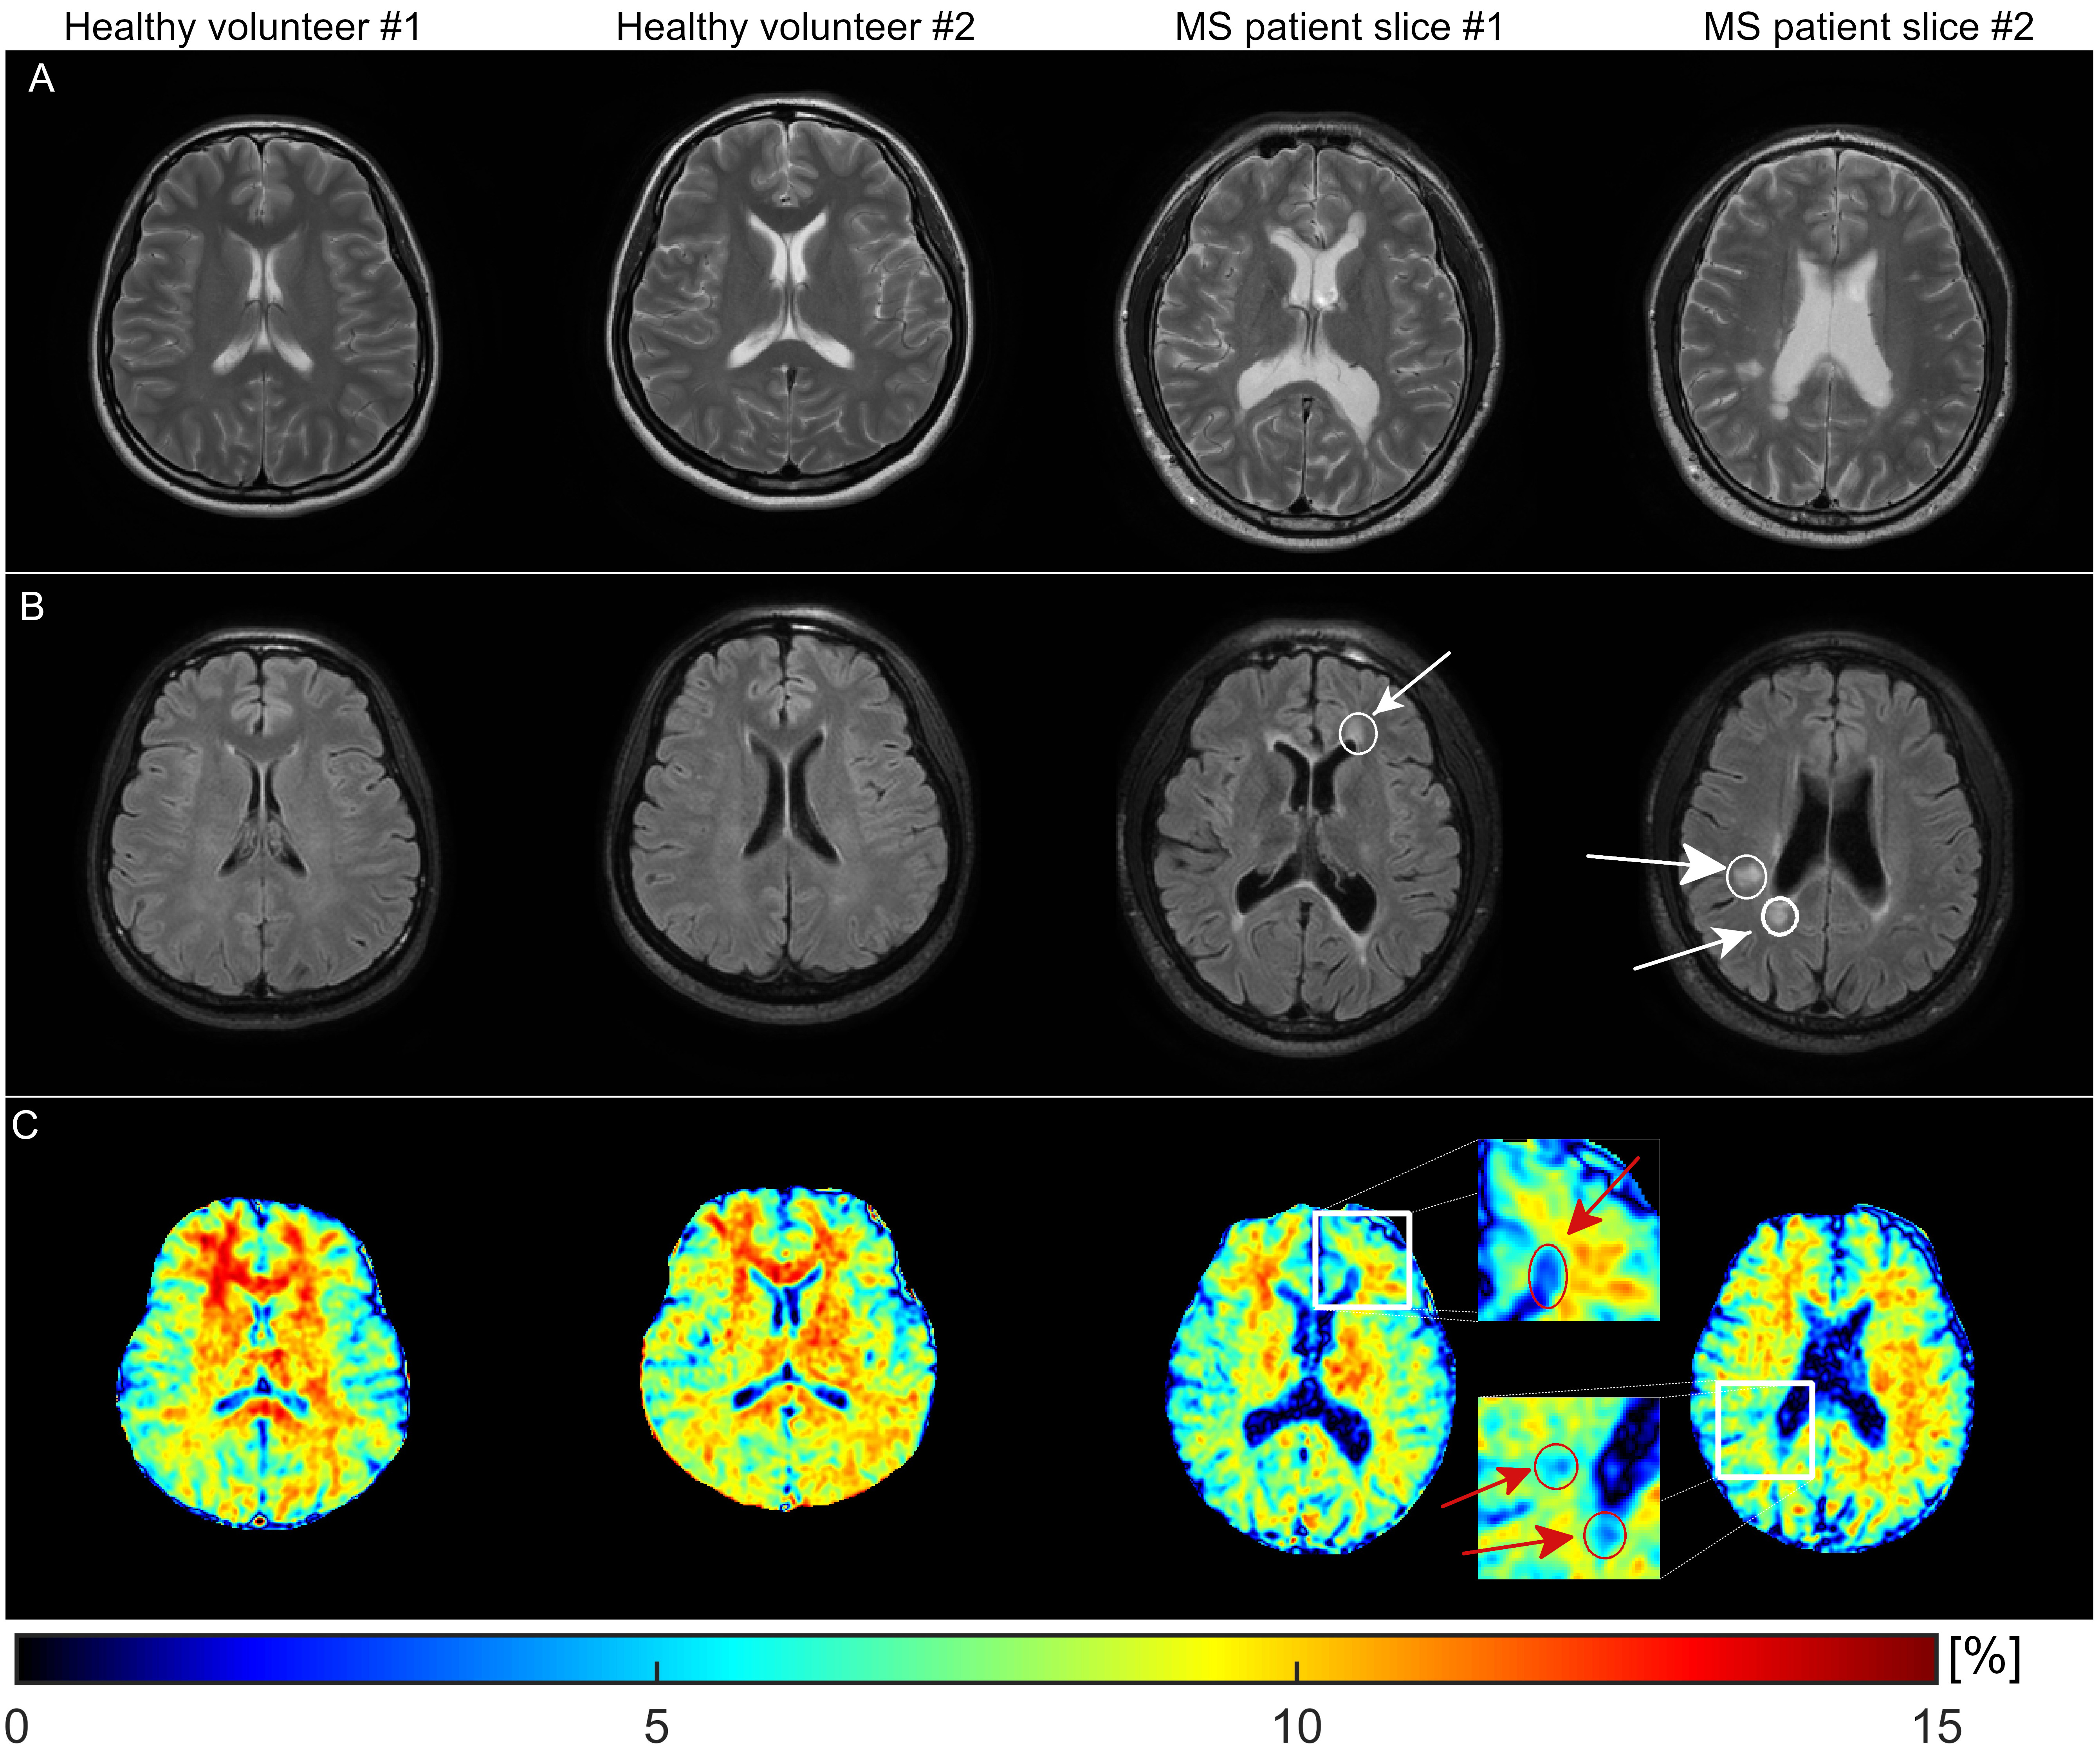
In vivo study was conducted after approval by local institutional review board. MRI data was collected from two healthy volunteers and one Relapsing-Remitting Multiple Sclerosis (RRMS) patient. Imaging parameters include: FOV 250 × 250 × 144mm3, resolution 1.5 ×1.5 ×4mm3, SENSE was used in two phase-encoding directions with acceleration factors 2 and 1. B1 map was collected to quantify MPF.
Results
Figure 2 shows the simulation results. It shows that Rmpfsl obtained by our proposed fast MPF-SL approach is approximately a linear function of MPF. Figure 3 shows the results from first phantom study. Note Rmpfsl obtained by the fast MPF-SL method increases with agarose concentration. Figure 4 shows the results from second phantom study. Note Rmpfsl results are comparable when the agarose concentration was same, regardless of MnCl2 concentration. Besides, Rmpfsl results are comparable when using conventional and fast MPF-SL method. Figure 5 shows the in vivo results. Note the MPF decreases at the lesions from the RRMS patient, which suggests the demyelination at these lesions. Compared to two healthy volunteers, the brain MPF value of this RRMS patient shows overall decreases.Discussion & Conclusion
We proposed a fast MPF imaging method based on spin-lock, and demonstrated it by simulation, phantom and in vivo experiments. In contrast to the conventional MPF-SL method, imaging data can be collected using only two acquisitions under reasonable assumptions. Compared to the saturation RF pulse based approaches, spin-lock based methods do not require acquisition of T1 map as prior knowledge for MPF calculation. Only a B1 map is needed in addition to imaging data to quantify MPF. The MPF measurement of the whole brain can be achieved within 5 minutes scan time using the proposed method. Future work includes further validation of this promising MPF mapping technique and evaluate its clinical applications in neuro diseases8 and beyond9.Acknowledgements
This study was supported by a grant from the Innovation and Technology Commission of the Hong Kong SAR (Project MRP/046/20X).References
[1] Wolff Steven D., Balaban Robert S.. Magnetization transfer contrast (MTC) and tissue water proton relaxation in vivo. Magnetic Resonance in Medicine. 1989;10(1):135-144.
[2] Henkelman R. Mark, Huang Xuemei, Xiang Qing-San, Stanisz G. J., Swanson Scott D., Bronskill Michael J.. Quantitative interpretation of magnetization transfer. Magnetic Resonance in Medicine. 1993;29(6):759-766.
[3] Yarnykh Vasily L.. Fast macromolecular proton fraction mapping from a single off-resonance magnetization transfer measurement. Magnetic Resonance in Medicine. 2012;68(1):166-178.
[4] Battiston Marco, Schneider Torben, Grussu Francesco, et al. Fast bound pool fraction mapping via steady-state magnetization transfer saturation using single-shot EPI. Magnetic Resonance in Medicine. 2019;82(3):1025-1040.
[5] Cronin Matthew J., Xu Junzhong, Bagnato Francesca, Gochberg Daniel F., Gore John C., Dortch Richard D.. Rapid whole-brain quantitative magnetization transfer imaging using 3D selective inversion recovery sequences. Magnetic Resonance Imaging. 2020;68:66-74.
[6] Hou Jian, Wong Vincent Wai-Sun, Jiang Baiyan, et al. Macromolecular proton fraction mapping based on spin-lock magnetic resonance imaging. Magnetic Resonance in Medicine. 2020;84(6):3157-3171.
[7] Stanisz Greg J., Odrobina Ewa E., Pun Joseph, et al. T1, T2 relaxation and magnetization transfer in tissue at 3T. Magnetic Resonance in Medicine. 2005;54(3):507-512.
[8] Kisel Alena A., Naumova Anna V., Yarnykh Vasily L. Macromolecular Proton Fraction as a Myelin Biomarker: Principles, Validation, and Applications. Frontiers in Neuroscience. 2022;16
[9] Hou Jian, Wong Vincent W.-S., Qian Yurui, et al. Detecting Early-Stage Liver FibrosisUsing Macromolecular Proton Fraction Mapping Based on Spin-Lock MRI: PreliminaryObservations. J Magn Reson Imaging. 2022
Figures