1262
Evaluation of Activity of Graves’ Orbitopathy by Multiparameter Orbital MRI1Department of Radiology, Peking University People’s Hospital, Beijing, China, 2Department of Endocrinology, Peking University People’s Hospital, Beijing, China, 3Philips Healthcare, Beijing, China, 4Department of Ophthalmology, Peking University People’s Hospital, Beijing, China
Synopsis
Keywords: Quantitative Imaging, MR Value
The evaluation in activity of Graves’ orbitopathy (GO) has important clinical significance for the treatment decision making and prognosis prediction for GO patients. Some previous studies have a limited comprehensive consideration that GO could involve almost entire orbital region, leading to complex changes in MR quantitative parameter, such as T1, T2, and fat fractions. In this study, we established a combined model including MRI quantitative parameters concerning multiple tissues of eyes and multiple sequences to distinguish active GO. And it was better than using a certain parameter alone to evaluate GO activity.Introduction
Graves’ Orbitopathy (GO) is an inflammatory autoimmune disease that is a common cause of protrusion of one or both eyes. The remodeling of the orbit that occurs with this disease can lead to many complications, including photophobia, eyelid retraction and even vision loss1. The activity of GO is usually assessed using a clinical activity score (CAS) 2, but it is mainly based on clinical symptoms and is highly subjective3. Recent studies illustrated quantitative magnetic resonance (MR) could be used to assess the activity of GO the examination, they focused on a specific orbital tissue, especially the extraocular muscles (EOMs). However, GO usually affects the entire intraorbital soft tissue in clinical practice. The aim of this study was to establish a diagnostic model for GO activity by the technology of T1 mapping,T2mapping and mDIXON Quant.Methods
Patients with GO were divided into those with active disease and inactive disease based on a CAS from May 2021 to March 2022. MRI examinations were performed on a 3.0 T system (Ingenia, Philips Healthcare, the Netherlands) with a 16-channel head coil. Sequences of conventional imaging, T1 mapping, T2 mapping, and mDIXON Quant were included. The scanning parameters of the MR sequences used are shown in Table 1. Width of eyes, T2 signal intensity ratio (SIR), T1 values, T2 values, and fat fraction of EOMs, as well as water fraction (WF) of orbital fat (OF) were measured by two senior radiologists (with >10 years of experience) who were blinded to the clinical information (Fig.2 A-F). Moreover, the measurements of width/thickness for 8 EOMs were then averaged and recorded (Fig.2 A-F). All data were analyzed using IBM SPSS statistical version 25.0 and MedCalc version 20. Differences in clinical and imaging characteristics were compared using independent sample t-tests, Mann–Whitney U tests, χ2 tests, or Fisher exact tests. Combined diagnostic model was constructed using logistic regression analysis. Receiver operating characteristic (ROC) analysis was used to test the diagnostic performance of the model. P value <0.05 was considered statistically significant.Results
A total of 68 patients (25 men, 43 women; age, 43.5 ± 13.1 years; range, 20-83 years) were enrolled in this study as shown in Fig.1. 27 patients(10 men, 17 women; age, 48.8 ± 12.4 years) had active GO and 41 (15 men, 26 women; age, 40.7 ± 12.8 years) had inactive GO. The mean CAS values were 3.22 ± 0.58 in the active group and 1.24 ± 0.80 in the inactive group. The thickness, SIR, T2 values, and FF of EOMs were significantly higher in patients with active GO than in those with inactive GO. However, there’s no significant difference between the groups in T1 values. T2 values of EOMs (p = 0.023) and the WF of OF (p = 0.048) were used as independent factors to distinguish between active and inactive GO. The combined model demonstrated a favorable diagnostic performance in identifying these two groups (AUC = 0.878), with a sensitivity of 88.89% and a specificity of 75.61% (Fig.3). There’re significant differences in AUCs between the combined model and models separately assessing the T2 values of EOMs (p = 0.019) or the WF of OF (p = 0.026).Discussion
The combined model including the T2 values of EOMs and the WF of OF had favorable accuracy in identifying active GO. Meanwhile, significant differences were observed between active and inactive GO, according to EOM thickness, SIR, and FF. The pathological characteristics of active GO mainly involve inflammatory edema between EOM fibers and lymphocyte infiltration4. However, inactive GO generally involves either orbital fibrosis and fat infiltration in the chronic phase5. These manifestations of inactive GO generally occur in the absence of inflammatory edema. Because an increase in water content may be reflected by an increase in T2 values6, the T2 value in active GO patients is expected to be higher than in inactive GO patients. In a previous study, the T2-weighted imaging SIR of OF was significantly positively correlated with CAS, indicating OF inflammation may reflect GO activity7. Because the T2 value of normal fat is obviously higher than that of muscle, the high T2 signal in orbital would be contributed more by fat than water 6. Then increased water content in OF may not be reflected by an increase in T2 values. The mDIXON Quant sequence was used to provide separation of water and fat on the same image, thus allowing us to observe a significant difference between active and inactive GO in the WF of OF. The WF of OF was therefore selected as one of the parameters included in the combined model for identifying active GO. We also observed no significant difference in T1 values between cohorts, which could be due to short duration.Conclusion
This study demonstrated active phase GO is associated with higher values of EOM thickness, SIR, and T2 and with higher values of WF of OF. Furthermore, the T2 value of EOMs and the WF of OF were able to distinguish between active and inactive GO in patients with disease of short duration, especially in the combined diagnostic model.Acknowledgements
No acknowledgement.References
1. Kamboj, A., Lause, M. & Kumar, P. Ophthalmic manifestations of endocrine disorders—endocrinology and the eye. Transl. Pediatr 6, 286–299 (2017).
2. Bartalena, L. et al. The 2016 European Thyroid Association/European Group on Graves’ Orbitopathy Guidelines for the Management of Graves’ Orbitopathy. Eur Thyroid J 5, 9–26 (2016).
3. Mawn, L. A. et al. Soft Tissue Metrics in Thyroid Eye Disease: An International Thyroid Eye Disease Society Reliability Study. Ophthalmic Plastic & Reconstructive Surgery 34, 544–546 (2018).
4. Taylor, P. N. et al. New insights into the pathogenesis and nonsurgical management of Graves orbitopathy. Nat Rev Endocrinol 16, 104–116 (2020).
5. Dolman, P. J. Grading Severity and Activity in Thyroid Eye Disease. Ophthalmic Plastic & Reconstructive Surgery 34, S34–S40 (2018).
6. Das, T., Roos, J. C. P., Patterson, A. J., Graves, M. J. & Murthy, R. T2-relaxation mapping and fat fraction assessment to objectively quantify clinical activity in thyroid eye disease: an initial feasibility study. Eye 33, 235–243 (2019).
7. Higashiyama, T., Iwasa, M. & Ohji, M. Quantitative Analysis of Inflammation in Orbital Fat of Thyroid-associated Ophthalmopathy Using MRI Signal Intensity. Sci Rep 7, 16874 (2017).
Figures
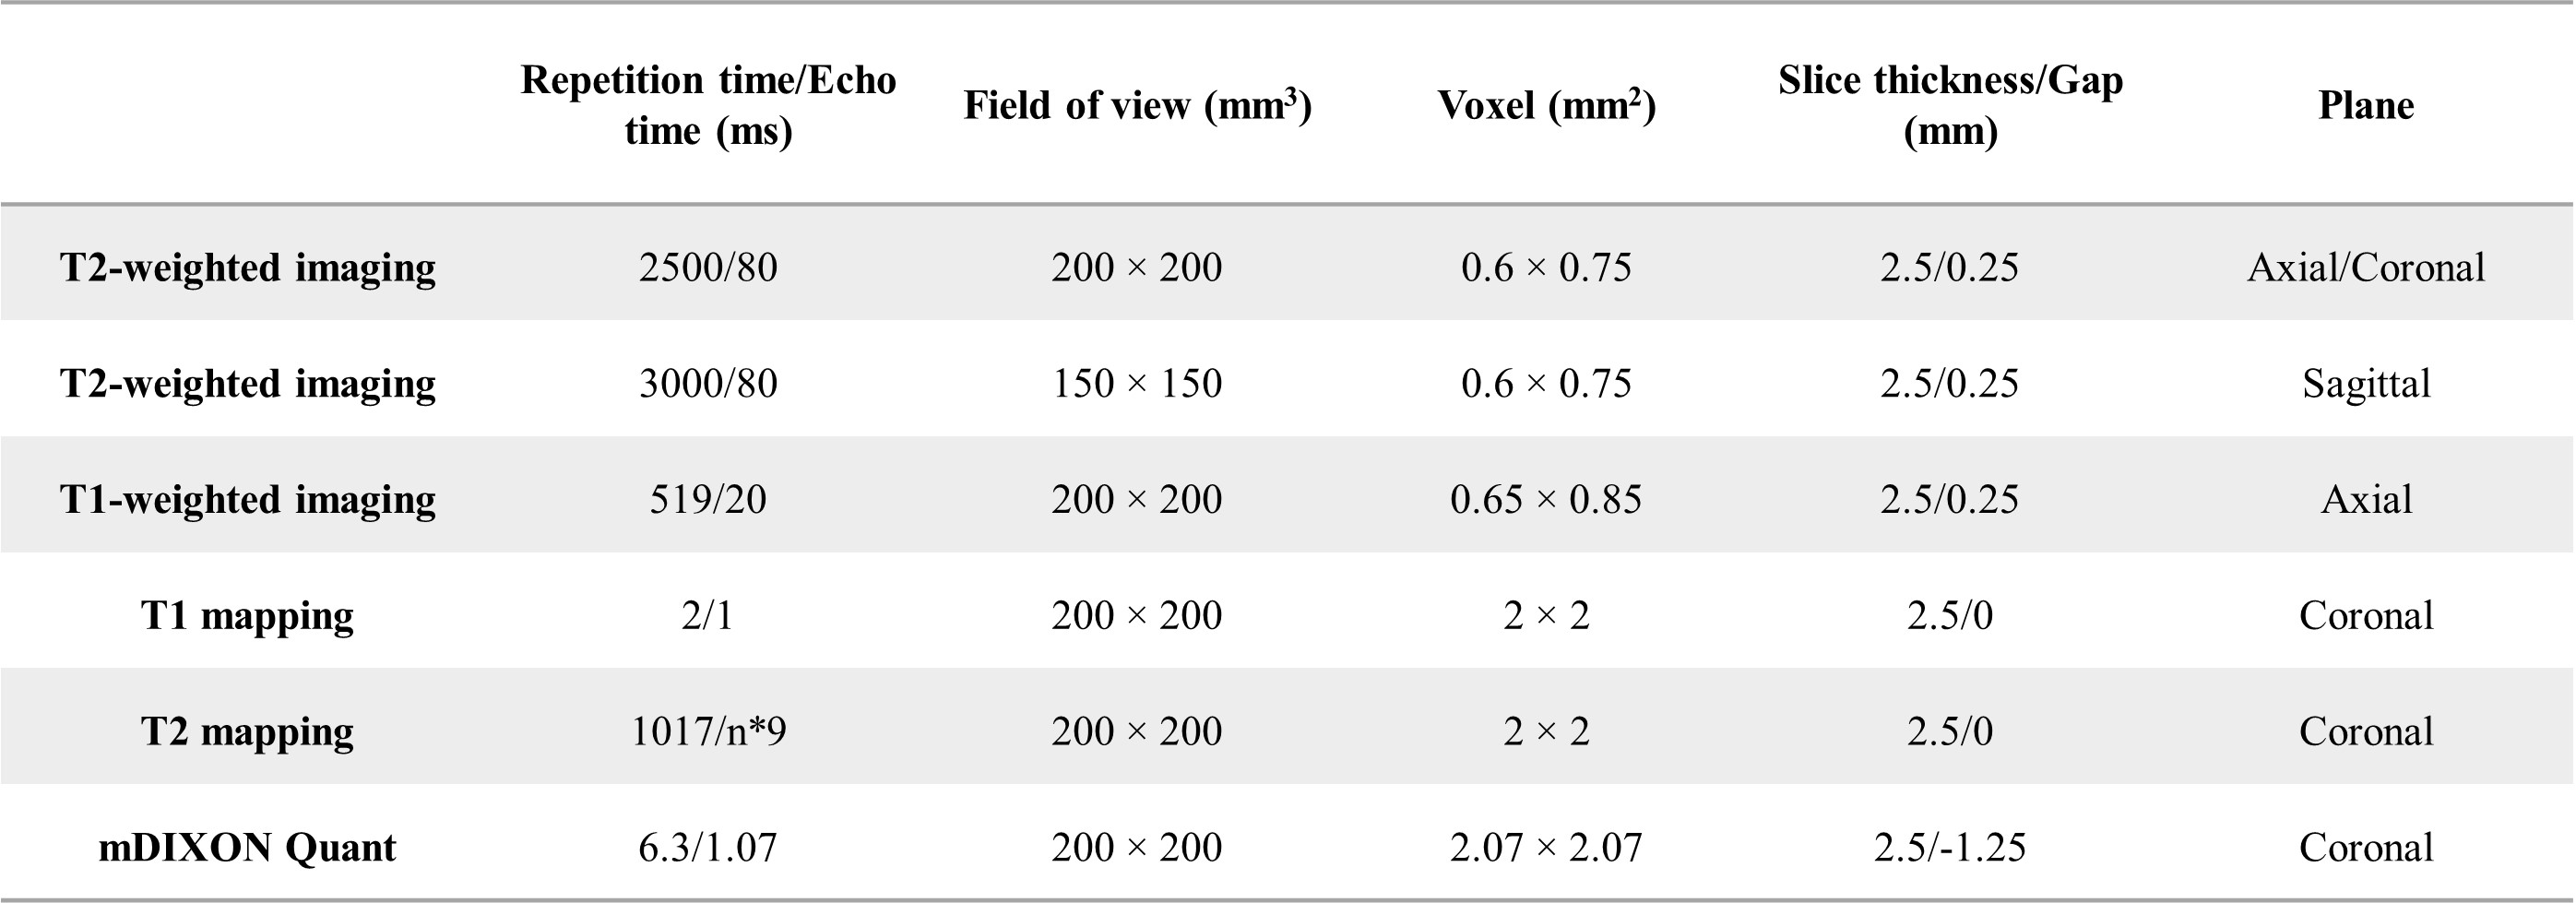
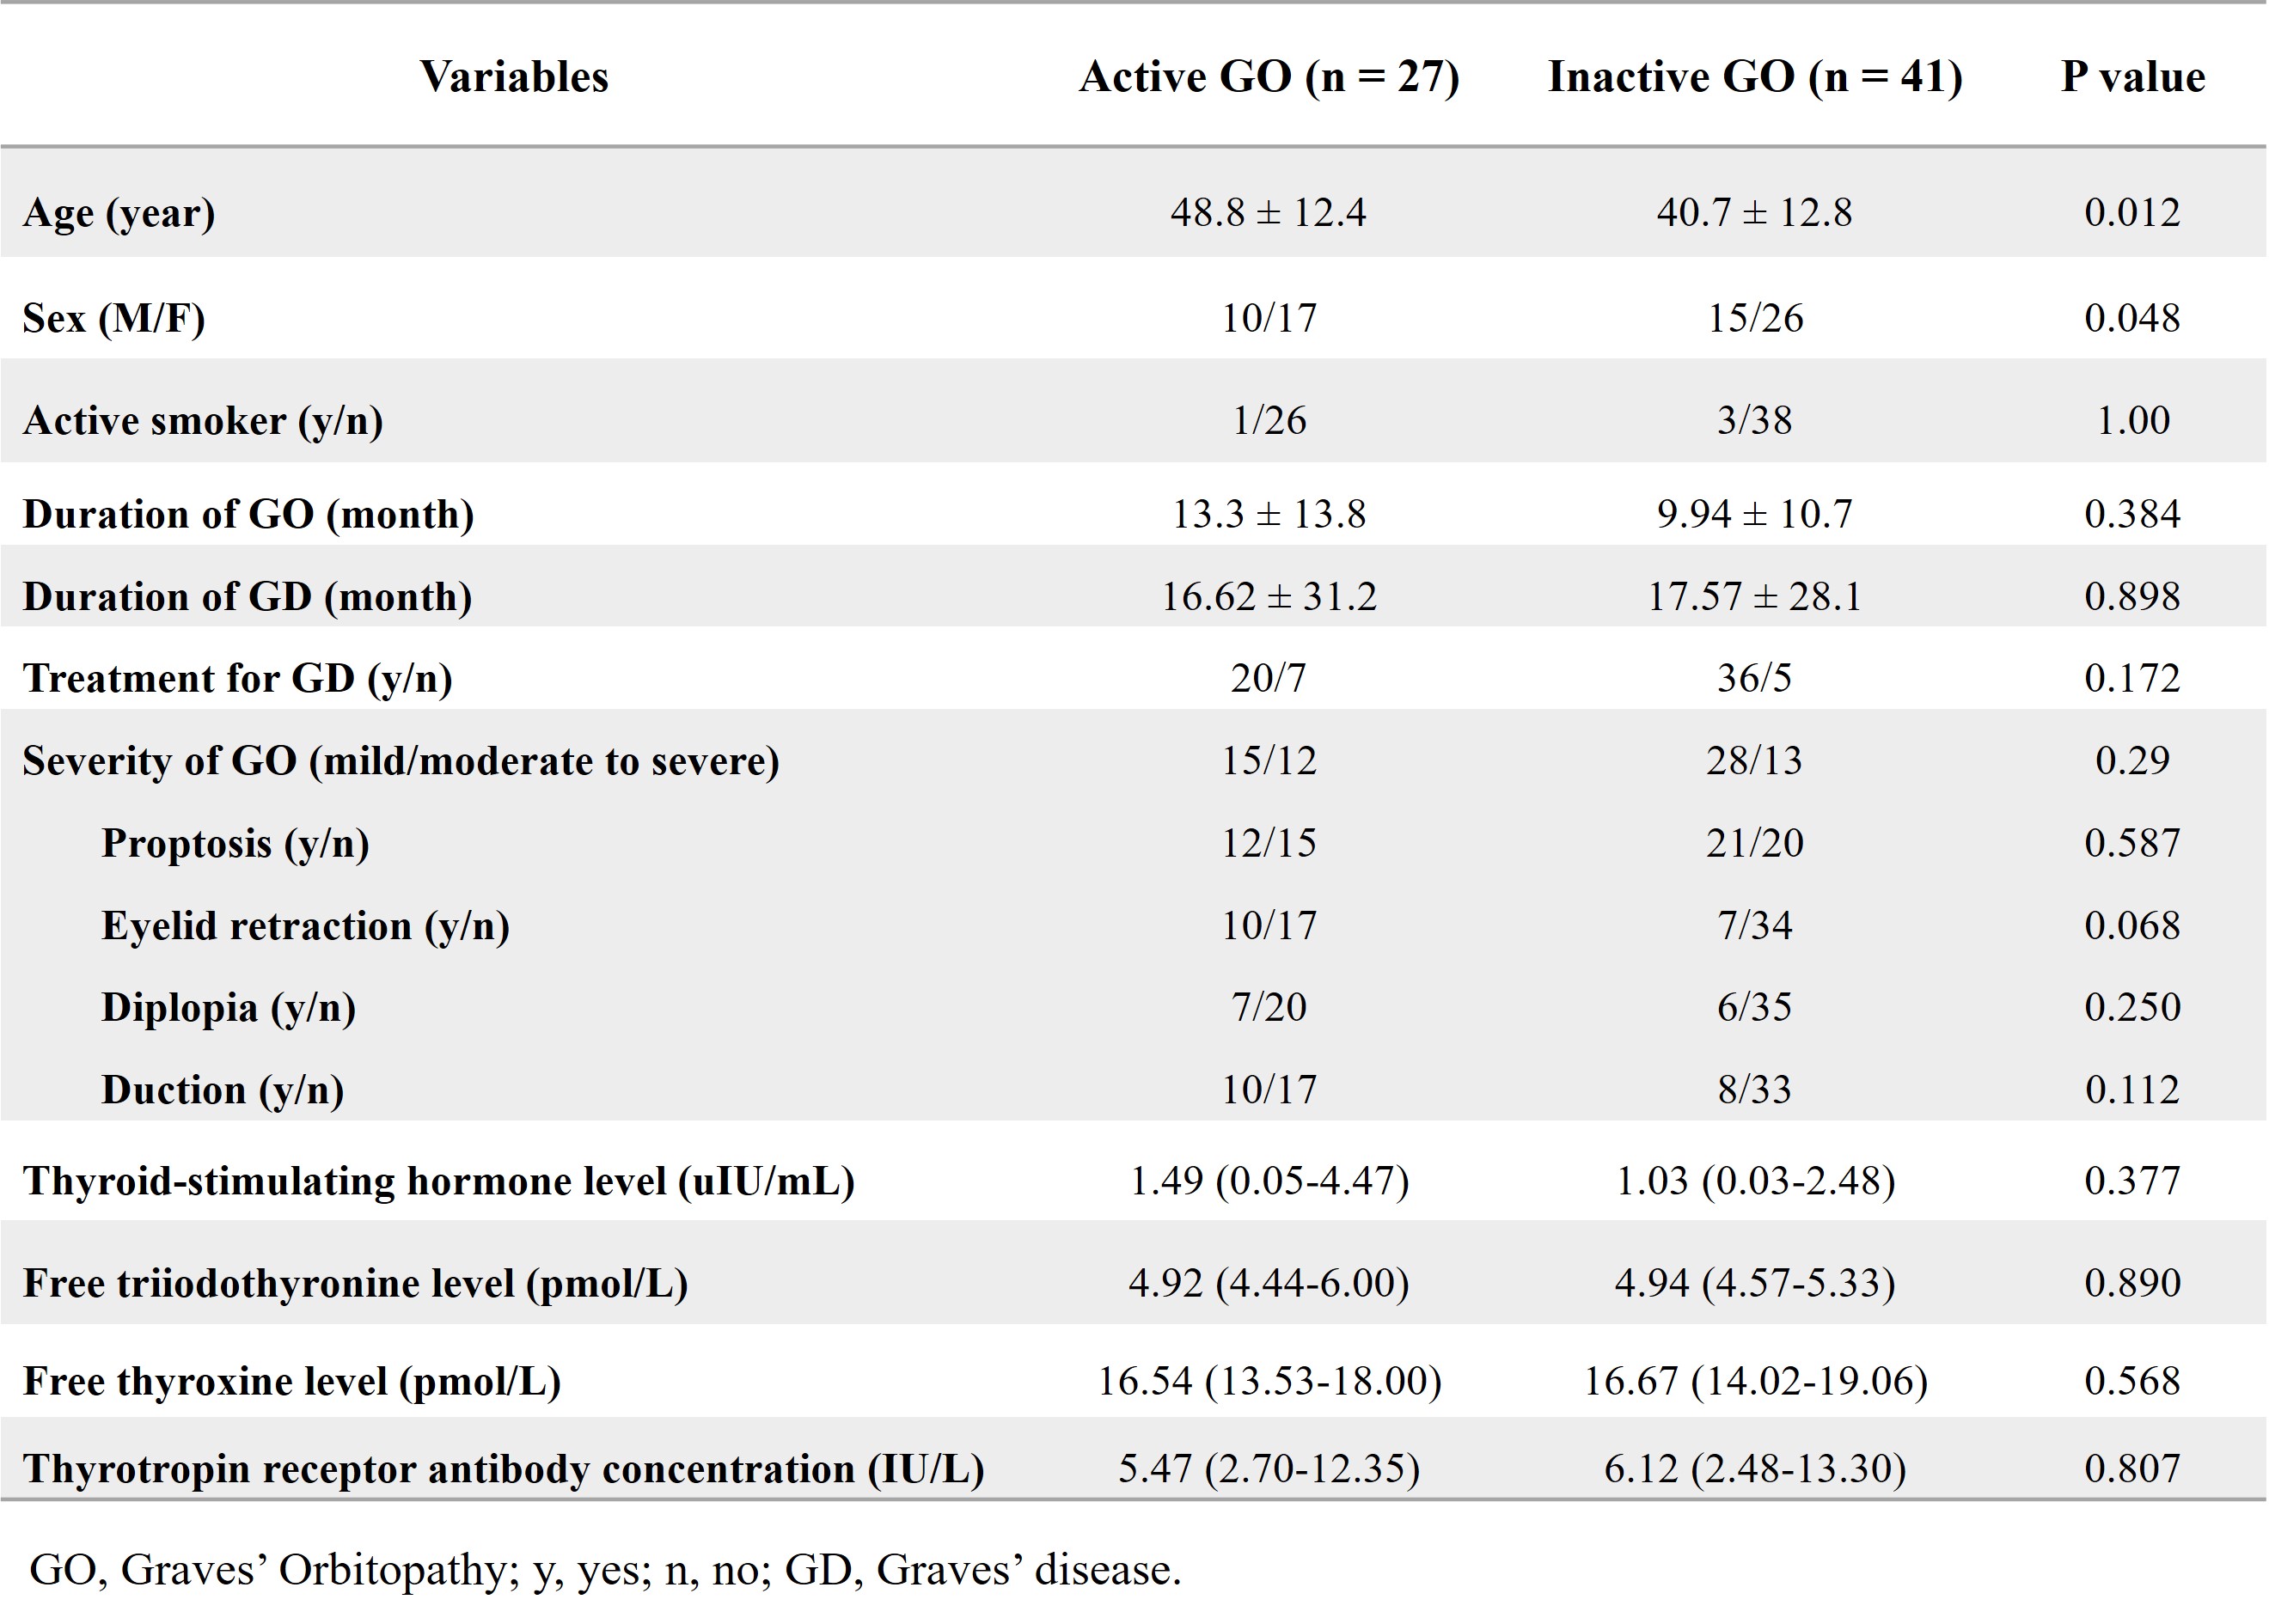
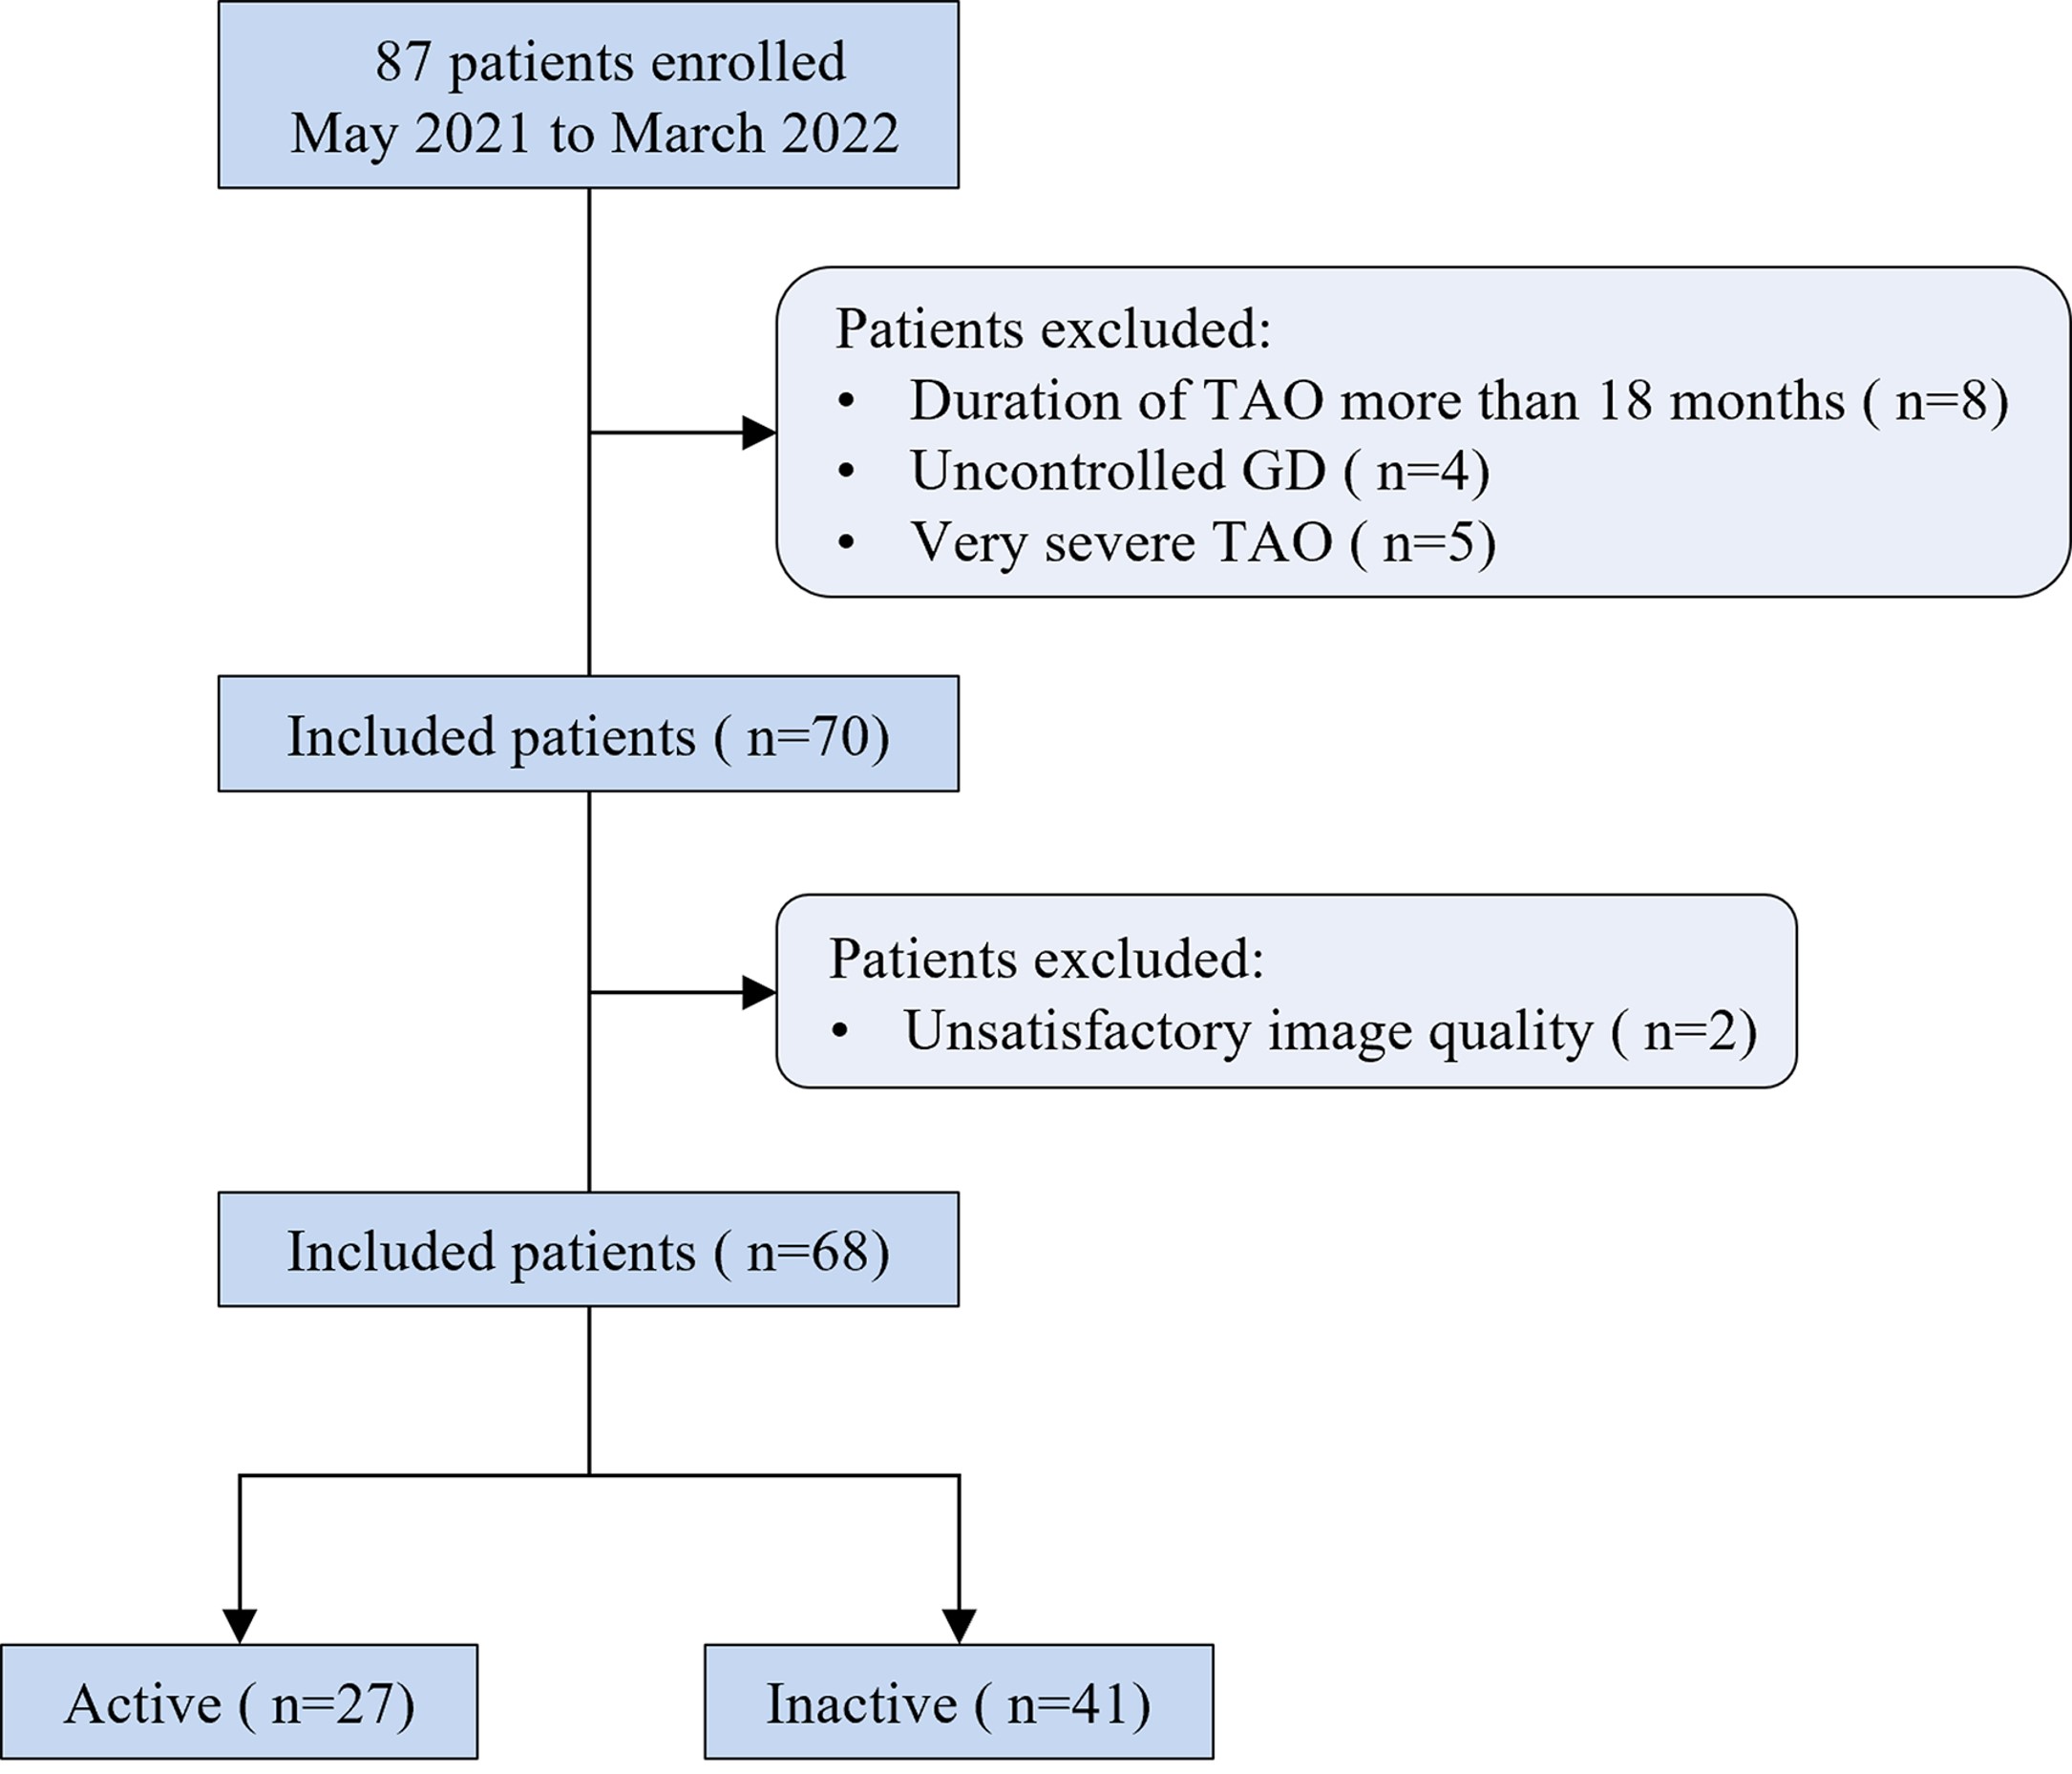
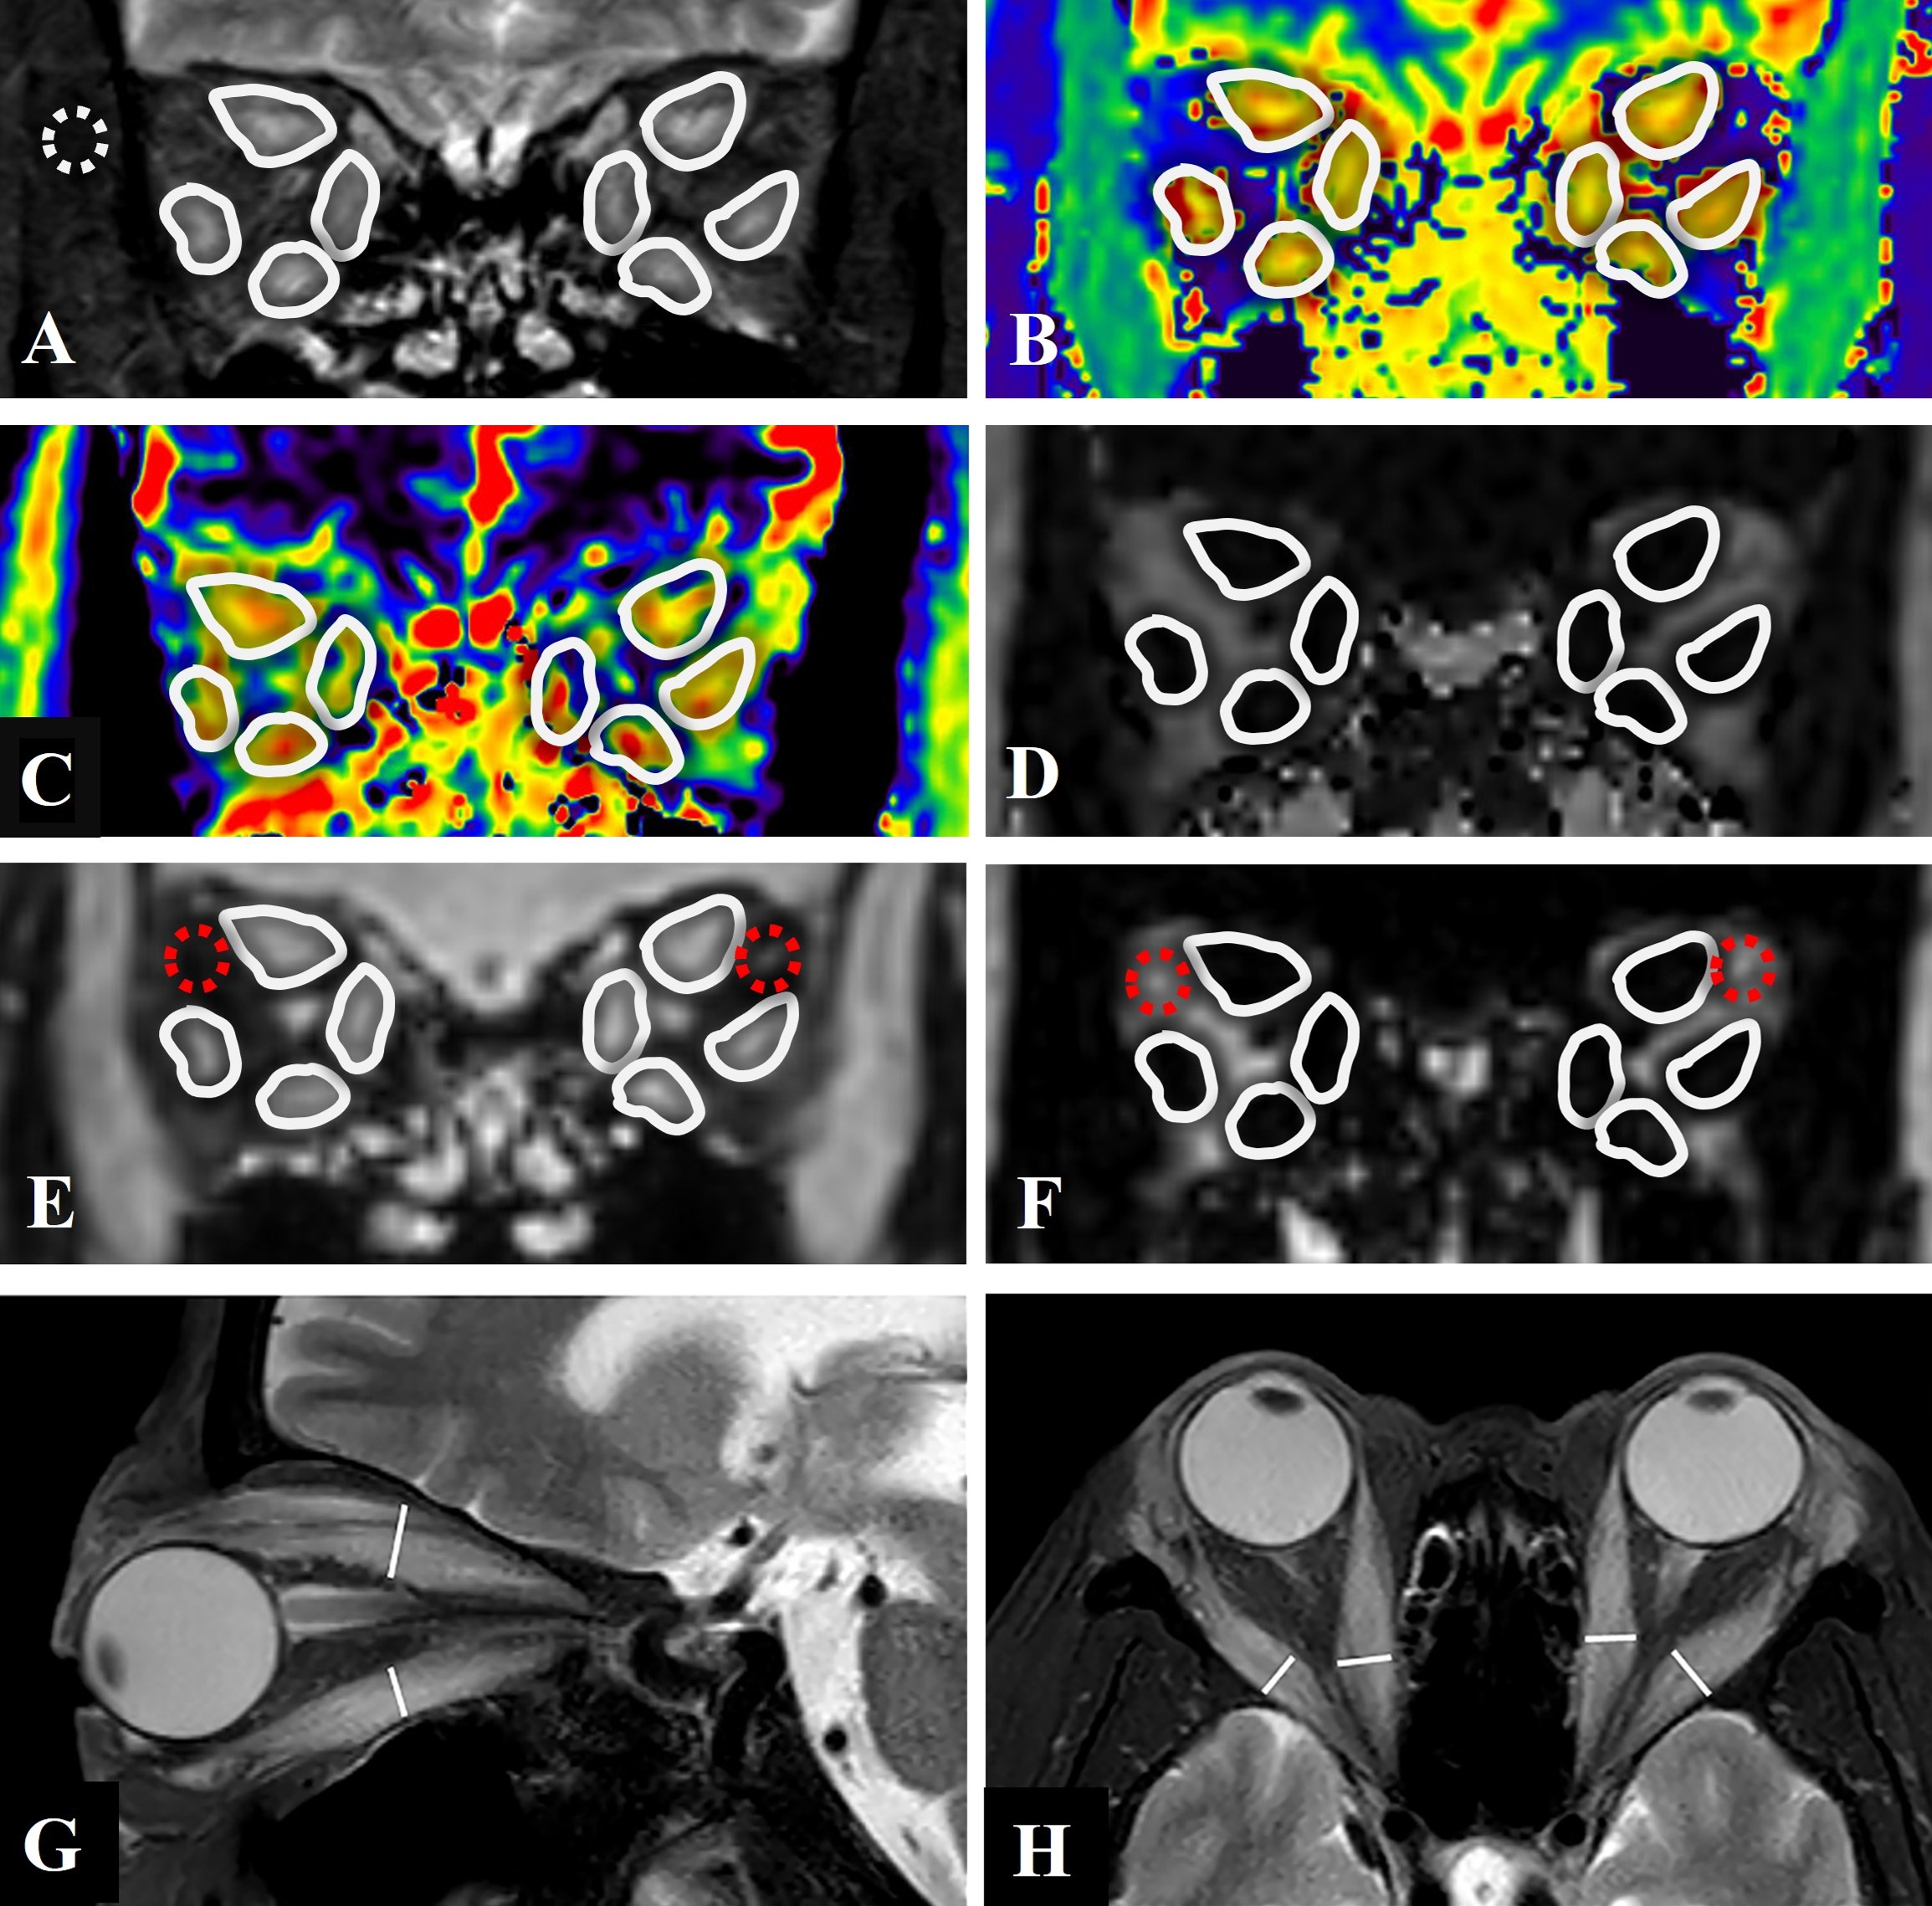
Figure 2:
(A-F): Images from a 60-year-old woman with Graves’ Orbitopathy (GO). ROIs were placement of 8 extraocular muscles (EOMs) on T2-weighted image with fat suppression (A), T1 mapping (B), T2 mapping (C) and mDIXON Quant sequences, including fat fraction (FF) (D), and water (E) and fat (F) phases are shown (white solid circles). ROIs of WF of orbital fat (E, F) (red dotted circles) and temporal muscle (a) (white dotted circle) were shown.
(G,H) Quantitative measurements of the width/thickness of 8 extraocular muscles on axial and coronal T2-weighted images with fat suppression.
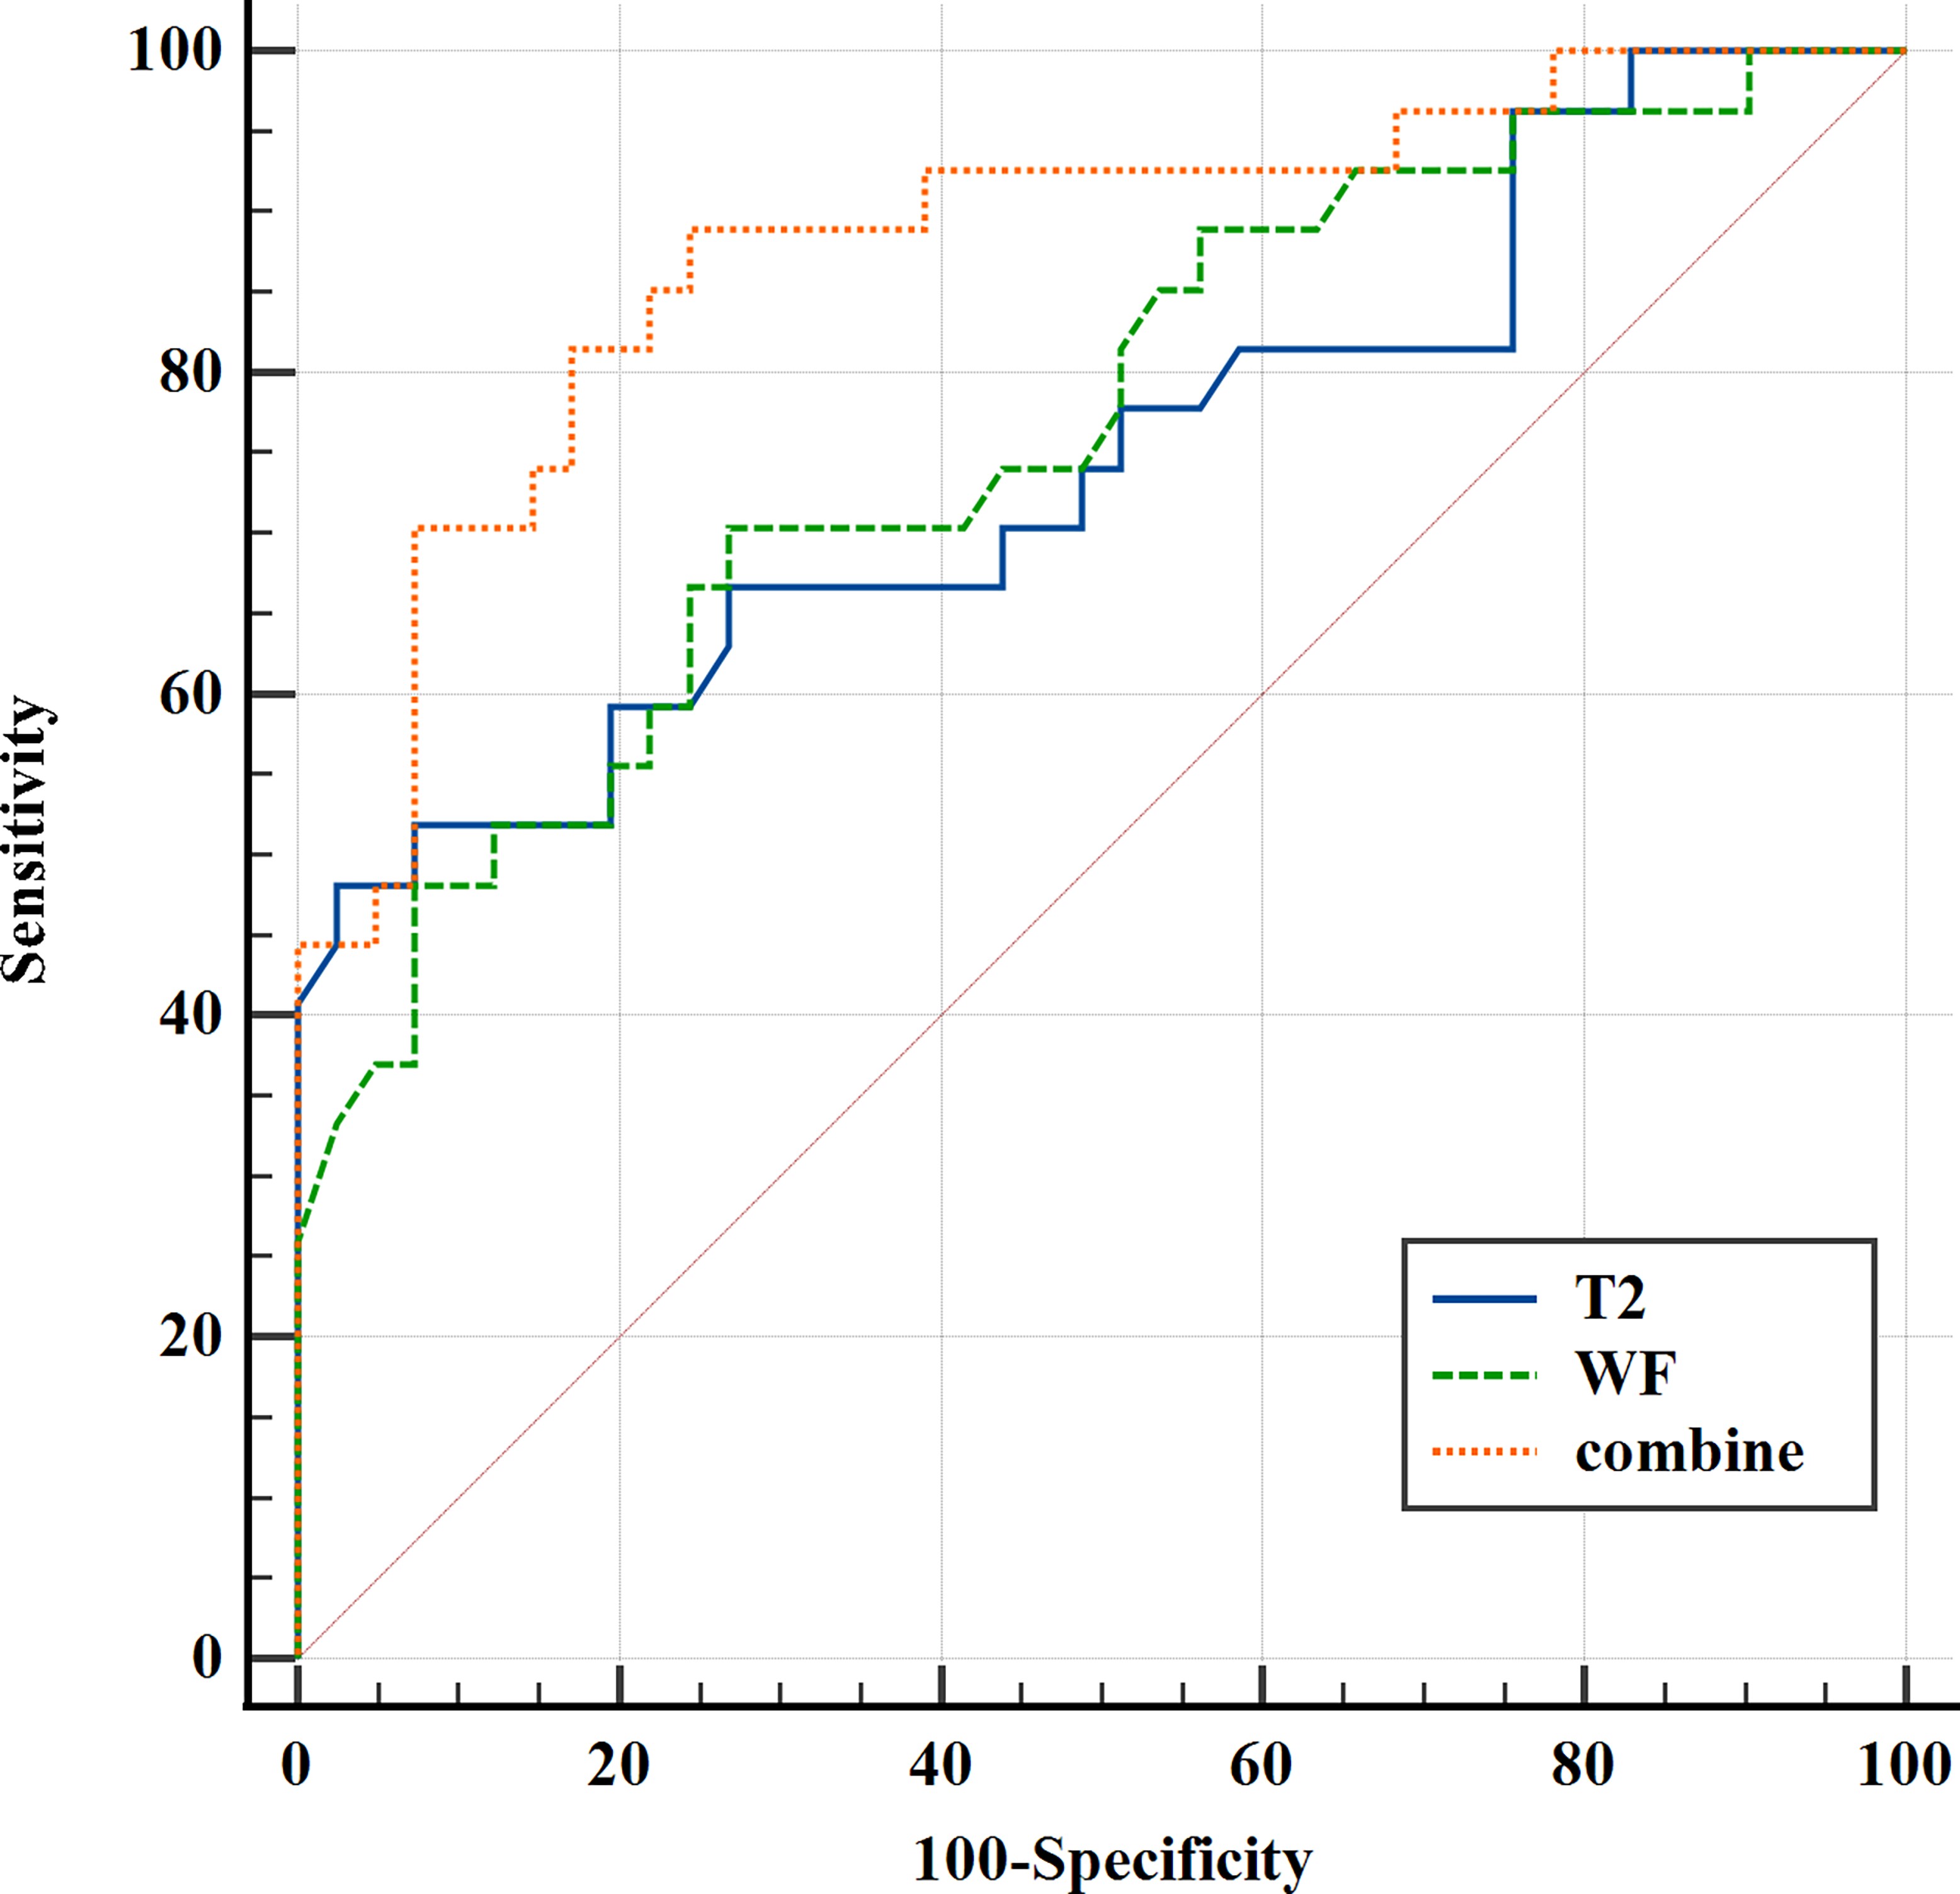
Figure 3:
ROC analysis results for each MRI parameter and for the combined model in identifying cases of active Graves’ Orbitopathy. The combined model demonstrated a favorable diagnostic performance in identifying these two groups (AUC = 0.878), with a sensitivity of 88.89% and a specificity of 75.61%.