1261
Quantitative multiparametric MRI describes neuromelanin-linked pathogenesis in the AAV-hTyr rat model of Parkinson’s disease1Sorbonne Université, Institut du Cerveau - Paris Brain Institute - ICM, Inserm, CNRS, APHP, Hôpital de la Pitié Salpêtrière, Paris, France, 2Center for NeuroImaging Research (CENIR), Paris, France, 3Aix Marseille Univ, CNRS, CRMBM, Marseille, France, 4Neurodegenerative Diseases Research Group, Vall d'Hebron Research Institute (VHIR), Autonomous University of Barcelona, Barcelona, Spain
Synopsis
Keywords: Quantitative Imaging, Multi-Contrast
Imaging of the neuromelanin (NM) has recently developed as a relevant biomarker of Parkinson’s disease (PD). Here, we present a longitudinal, quantitative, multiparametric study on the AAV-hTyr rat model of PD with NM accumulation in the right substantia nigra. Our protocol allowed to obtain NM-sensitive image, as well as R1, R2* and qMT in a single session. Longitudinal acquisition on AAV-hTyr rats showed inverted U-shaped curve of NM-MRI contrast-to-noise ratio, suggesting NM accumulation followed by neurodegeneration. R1, R2*, MPF and motor symptoms support this hypothesis. Our work may help to understand the pathogenesis of this PD model and identify biomarkers.Purpose
Parkinson’s disease (PD) is characterized by a preferential degeneration of the dopaminergic neurons of the substantia nigra (SN)1. Neuromelanin (NM) is a molecule that accumulates in these specific neurons during normal aging. While the role of NM in PD is poorly understood, recent imaging studies on PD patients have shown the interest of NM-sensitive MRI (NM-MRI) as a biomarker of PD2,3. Indeed, neurodegeneration leads to a reduction of the NM-MRI signal in the SN of PD patients4.The AAV-hTyr rat model is a recent model of PD with injection of viral vectors expressing human Tyrosinase, the rate-limiting enzyme of peripheral melanin synthesis, in the SN5. AAV-hTyr rats develop a parkinsonian syndrome including Lewy-bodies formation, neurodegeneration, and motor symptoms following NM accumulation.
In the present study, we performed longitudinal NM-MRI, quantitative multiparametric MRI (R1, R2*, MPF), and behavioural test on a large cohort of AAV-hTyr rats. By assessing multiple MR parameters and comparing them to NM-MRI, we aim at describing the pathogenetic process following NM accumulation in the AAV-hTyr model.
Methods
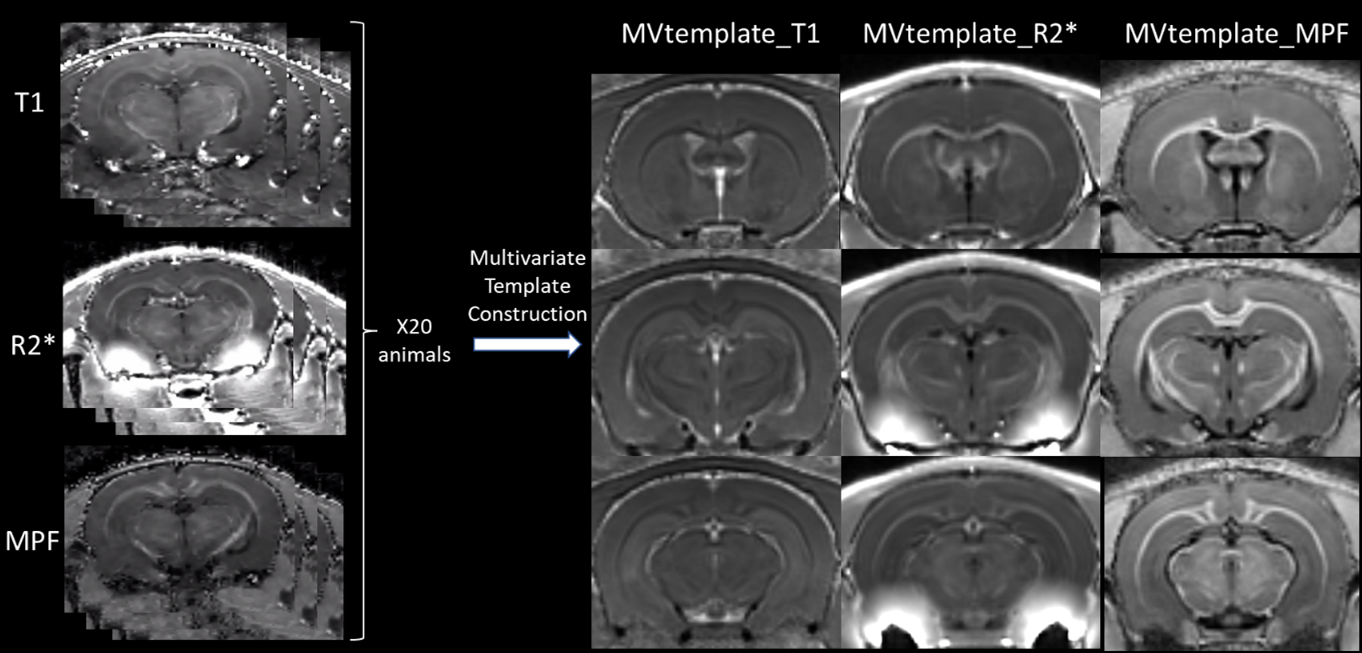
Animal experimentation: Forty 2-month-old male rats were injected with AAV-hTyr unilaterally just above the right SN. Cylinder test for asymmetric forepaw use5 and MRI protocol using an 11.7T Bruker scanner were performed before and 1, 2, 4 and 8 months post injection (mpi). Eight rats were euthanized after each time point for histological validation.MRI: Imaging protocol included NM-sensitive T1-weighted (NM-MRI) sequence (FLASH, TR/TE=333/6.8ms, Resolution=150x150µm², 16 slices, slice thickness=0.4mm, tacq=12 min), three 3D gradient multi echos with MT preparation (TR=47ms, TE1:ΔTE:TEL=1.71:1.91:30.36ms, 16 echos, Resolution=200µm isotropic, tMT_pulse=10ms, B1MT_pulse=7.8µT, tacq=32min each), with respectively FA=6°, δMT=100kHz (MTOFF_FA6); FA=24°, δMT=100kHz (MTOFF_FA24) and FA=6°, δMT=5kHz (MTON_FA6). B1 map was acquired using the Actual Flip angle Imaging method6.
Image processing: Images were reconstructed and coregistered for each animal to the MTOFF_FA6 image. Exponential fitting of the signal from the 16 echos of MTOFF_FA6 image was performed for R2* estimation. R1 was estimated from MTOFF_FA6 and MTOFF_FA24 images using the Variable Flip Angle method7. Macromolecular Proton Fraction (MPF) was calculated from MTOFF_FA6, MTON_FA6, T1 and B1 maps using Yarnykh’s method8,9 (https://github.com/lsoustelle/qMT).
Multi-contrast template (MVtemplate) was generated from R2*, T1 and MPF using antsMultivariateTemplateConstruction.sh (Figure 1)10 from ANTS.
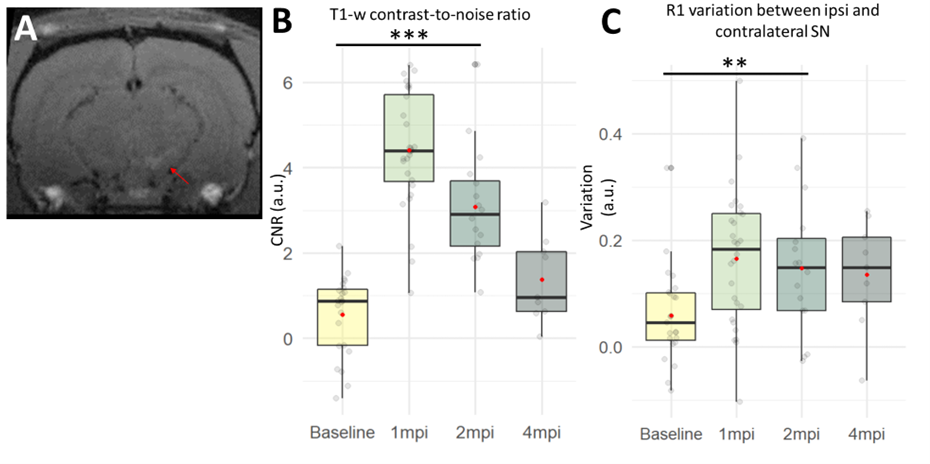
Ipsilateral region-of-interest was manually segmented on NM-MRI images at 1mpi (Figure 2A). The segmentation was then coregistered to other timepoints using nifty_reg11. For contralateral segmentation, left SN was extracted from the Paxinos atlas12 and coregistered first to the MVtemplate and then to every subject using ANTS. All statistics were calculated with R using a Linear Mixed Model and pairwise posthoc comparison with FDR correction.
Results
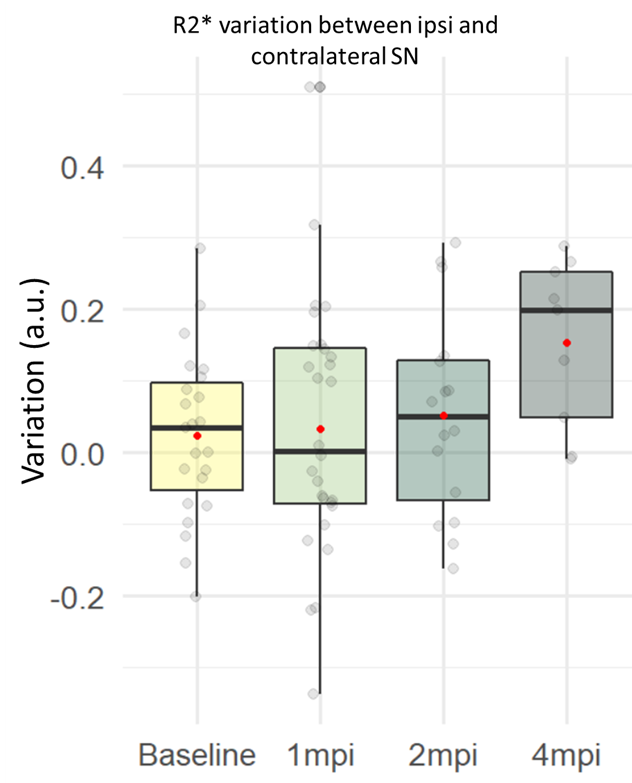
NM-MRI and R1: Contrast-to-noise ratio (CNR) between ipsi- and contralateral SN was significantly increased between baseline and 1mpi (+450%, p<0.001) and 2mpi (+283%, p<0.001)(Figure 2B). Concordant with this result, the R1 variation between ipsi- and contralateral SN was significantly increased between baseline and 1mpi (+183%, p<0.01) and 2mpi (+154%, p<0.01)(Figure 2C). Interestingly, both CNR and R1 seemed to decrease with time between 1 and 4mpi.R2*: R2* variation between ipsi- and contralateral SN seemed to progressively increase in time. R2* was increased between baseline and 2mpi (+246%, n.s.) and 4mpi (+607%, n.s.)(Figure 3).
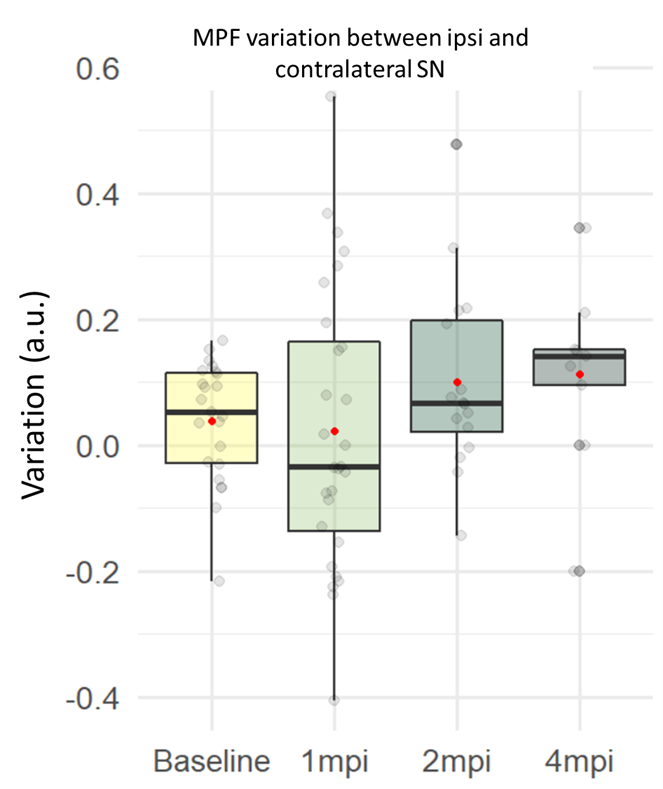
MPF: Similarly, MPF variation seemed to progressively increase. MPF was increased between baseline and 2mpi (+115%, n.s.) and 4mpi (+127%, n.s.)(Figure 4).
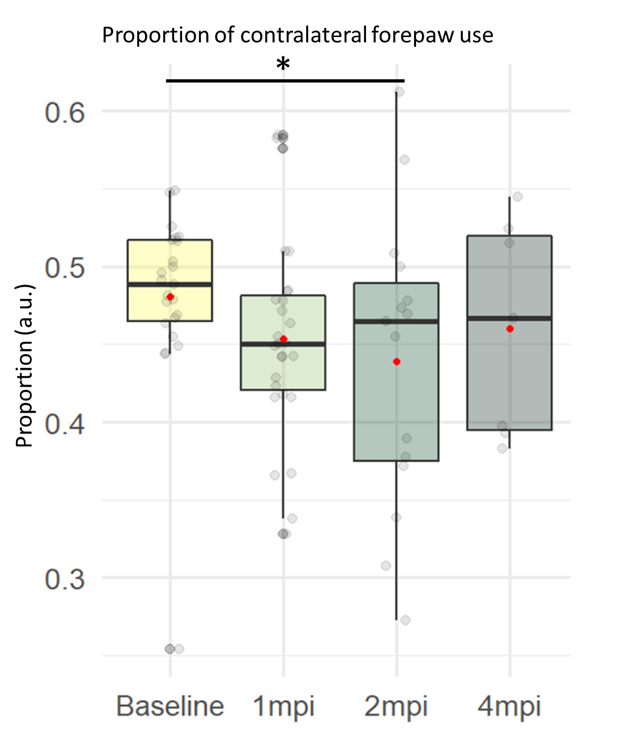
Cylinder test: There was a significant effect of time on the proportion of left forepaw use with significantly decreased proportion between baseline and 1mpi (-6.7%, p<0.05) and 2mpi (-9.4%, p<0.05)(Figure 5).
Discussion
The increase in NM-MRI CNR between ipsi- and contralateral SN after injection can be attributed to NM accumulation in the right SN as already described5. As NM-MRI is T1-weighted, the increase of the quantitative parameter R1 is consistent with this observation.We hypothesize that the subsequent progressive decrease of CNR is due to the neurodegeneration of SN melanized neurons. Previous work showed that dopaminergic neurons of the SN of AAV-hTyr rats are significantly degenerated at 4mpi5. Motor symptoms further support this hypothesis, which will be confirmed by histology.
Besides, similarly to our observations, opposite effects of neurodegeneration and NM accumulation are believed to be responsible for the inverted U-shape of the NM signal that has been reported in humans during aging13. This process could be exaggerated in PD.
R2* showed a trending increase in the right SN 4mpi, as shown in the SN of PD patients14, in agreement with hypothetic neurodegenerative time course. R2* increase can be attributed to iron accumulation15.
Quantitative MT showed a trend to increased MPF with a similar time course, indicative of accumulation of macromolecules in the SN16. The 8mpi imaging session, as well as histological examinations will investigate the contribution of myelin and NM to MPF, and validate the time course of degeneration, NM and iron accumulation.
Conclusion
Altogether, our results showed that NM-MRI seems to be sensitive not only to NM accumulation but also to neurodegeneration in the AAV-hTyr rat model of PD, as confirmed by multicontrast quantitative imaging. Results suggest that longitudinal quantitative imaging could help understand the rôle of NM in the pathogenesis of PD and identify quantitative MR biomarkers that could be transferred to clinical MRI in the context of PD.Acknowledgements
This project was funded by the ANR JPND NIPARK. All animal work was conducted at the ICM PHENOPARC Core Facility. The Core is supported by 2 “Investissements d’avenir” (ANR-10- IAIHU-06 and ANR-11-INBS-0011-NeurATRIS) and the “Fondation pour la Recherche Médicale”. We thank Nadège Sarrazin from PHENOPARC for her help.References
1. Dauer, W. & Przedborski, S. Parkinson’s disease: mechanisms and models. Neuron 39, 889–909 (2003).
2. Sulzer, D. et al. Neuromelanin detection by magnetic resonance imaging (MRI) and its promise as a biomarker for Parkinson’s disease. NPJ Park. Dis. 4, 11 (2018).
3. Biondetti, E. et al. Spatiotemporal changes in substantia nigra neuromelanin content in Parkinson’s disease. Brain J. Neurol. 143, 2757–2770 (2020).
4.Sasaki, M. et al. Neuromelanin magnetic resonance imaging of locus ceruleus and substantia nigra in Parkinson’s disease. NeuroReport 17, 1215–1218 (2006).
5. Carballo-Carbajal, I. et al. Brain tyrosinase overexpression implicates age-dependent neuromelanin production in Parkinson’s disease pathogenesis. Nat. Commun. 10, 973 (2019).
6. Yarnykh, V. L. Actual flip-angle imaging in the pulsed steady state: A method for rapid three-dimensional mapping of the transmitted radiofrequency field. Magn. Reson. Med. 57, 192–200 (2007).
7. Heule, R., Ganter, C. & Bieri, O. Variable flip angle T1 mapping in the human brain with reduced t2 sensitivity using fast radiofrequency-spoiled gradient echo imaging. Magn. Reson. Med. 75, 1413–1422 (2016).
8. Yarnykh, V. L. Fast macromolecular proton fraction mapping from a single off-resonance magnetization transfer measurement. Magn. Reson. Med. 68, 166–178 (2012).
9. Naumova, A. V., Akulov, A. E., Khodanovich, M. Yu. & Yarnykh, V. L. High-resolution three-dimensional macromolecular proton fraction mapping for quantitative neuroanatomical imaging of the rodent brain in ultra-high magnetic fields. NeuroImage 147, 985–993 (2017).
10. Avants, B. B. et al. A reproducible evaluation of ANTs similarity metric performance in brain image registration. NeuroImage 54, 2033–2044 (2011).
11. Modat, M. et al. Global image registration using a symmetric block-matching approach. J. Med. Imaging Bellingham Wash 1, 024003 (2014).
12. Paxinos, G., Watson, C. R. R. & Emson, P. C. AChE-stained horizontal sections of the rat brain in stereotaxic coordinates. J. Neurosci. Methods 3, 129–149 (1980).
13. Xing, Y., Sapuan, A., Dineen, R. A. & Auer, D. P. Life span pigmentation changes of the substantia nigra detected by neuromelanin-sensitive MRI. Mov. Disord. Off. J. Mov. Disord. Soc. 33, 1792–1799 (2018).
14. Pyatigorskaya, N. et al. Iron Imaging as a Diagnostic Tool for Parkinson’s Disease: A Systematic Review and Meta-Analysis. Front. Neurol. 11, 366 (2020).
15. Brammerloh, M. et al. Measuring the iron content of dopaminergic neurons in substantia nigra with MRI relaxometry. NeuroImage 239, 118255 (2021).
16. Trujillo, P. et al. Quantitative magnetization transfer imaging of the human locus coeruleus. NeuroImage 200, 191–198 (2019).
Figures