1260
Diffusion and relaxometry study of an excised temporal lobe from a drug-resistance epilepsy patient using in vivo and ex vivo MRI
Francisco Javier Fritz1, Jan Malte Oeschger1, Ora Ohana2, Thomas Sauvigny3, and Siawoosh Mohammadi1
1Institute for Systems Neuroscience, University Medical Center Hamburg-Eppendorf, Hamburg, Germany, 2Institute of Molecular and Cellular Cognition, University Medical Center Hamburg-Eppendorf, Hamburg, Germany, 3Department of Neurosurgery, University Medical Center Hamburg-Eppendorf, Hamburg, Germany
1Institute for Systems Neuroscience, University Medical Center Hamburg-Eppendorf, Hamburg, Germany, 2Institute of Molecular and Cellular Cognition, University Medical Center Hamburg-Eppendorf, Hamburg, Germany, 3Department of Neurosurgery, University Medical Center Hamburg-Eppendorf, Hamburg, Germany
Synopsis
Keywords: Quantitative Imaging, Ex-Vivo Applications, In-vivo to ex-vivo translation; Diffusion MRI; Relaxometry
To learn and validate MRI-based microstructure models, MRI from fixed ex-vivo tissue samples can be compared with its histological counterpart. However, translating these models to in-vivo MRI requires thorough characterisation of MR-contrast changes between in-vivo and fixed ex-vivo measurements (e.g., due to fixation). By preforming this characterisation on an epilepsy patient’s freshly excised temporal lobe, we found that diffusion parameters changed strongly whereas relaxometry parameters remained almost unchanged. Our findings provide a missing link between in-vivo and fixed ex-vivo MRI that in future can facilitate in-vivo application of MRI-based microstructure mapping like estimating iron and myelin from relaxometry parameters.Introduction
Quantitative MRI (qMRI) parameters have been used to quantify tissue microstructure like myelin and iron1,2. To learn and validate the relation between qMRI and microstructure, the qMRI maps have to be compared to their histological counterpart1,2. This comparison is typically based on data acquired from fixed ex-vivo tissue samples that fulfil the requirements of histology and MRI. However, the link between fixed ex-vivo and in-vivo MRI is not straightforward, given the changes in the MR contrast of the specimen due to excision and following fixation process3. For example, temperature reduction (from 37°C to room temperature)4, the fixation-induced cross-linking of proteins5 and blood perfusion absence that can affect both relaxometry and diffusion MR parameters. Therefore, the MR parameter transition from in-vivo to ex-vivo needs to be characterised to make use of the validated relation between qMRI parameters and histology for in-vivo applications. In this work, we characterise the change of qMRI parameters from in-vivo to fixed ex-vivo using a freshly excised brain tissue section from a drug-resistant temporal lobe epilepsy patient. The investigated qMRI parameters include longitudinal and effective transverse relaxation rates (R1 and R2*) as well as mean diffusivity and fractional anisotropy (MD and FA).Methods
In-vivo subject (pre- and post- surgery): This study recruited a woman (46 years, 1.59 m, 79 kg) diagnosed with drug-resistant temporal lobe epilepsy. The MR study, before and after operation (Figure 1A), was approved (ethic protocol PV5600) and acquired at the University Medical Center Hamburg-Eppendorf.Ex-vivo specimen: The subject’s excised temporal lobe was measured with MRI (Figure 1A). First, it was contained in a glucose solution that resembles CSF for one hour before measurement. Then, it was fixed with 4% paraformaldehyde (PFA) in a buffered aqueous solution for a period of 6 months and measured multiple times. Afterwards, the solution was changed to phosphate buffered saline (PBS) solution, where the sample was kept for 1 month and measured again.
Acquisition and analysis performed in both in-vivo and ex-vivo MR measurements are listed in Figure 1, Tables C and D, respectively. To note, all coregistrations were performed from ex-vivo to in-vivo (Figure 1B), and ex-vivo diffusion protocol (Table C) was only performed for ex-vivo in PFA for 6 months and PBS for 1 month whereas in-vivo diffusion protocol was performed for all-time points.
Results
Figures 2 and 3 show the change of R1 (Figure 2A), R2* (Figure 2B), MD (Figure 3A), and FA (Figure 3B) parameters from in-vivo and ex-vivo measurements of the freshly excised temporal lobe in glucose, PFA, and PBS. Generally, R1, R2* and FA maps increased while MD maps decreased. The cGM-WM contrast was almost negligible for R2*, both in-vivo and in the glucose measurement. From the earliest measurement in fixative, the cGM-WM contrast got enhanced for R2*, R1 and MD and remained similar for FA. Interestingly, the cGM-WM contrast for MD got reverted during fixation, while the contrasts of the other parameters remained the same.Figure 4 and 5 show the mean temporal evolution of R1 and R2* (Figure 4A and 4B), as well as MD and FA (Figure 5A and 5B) for cGM (blue and magenta bars) and WM (orange and green bars) of the indicated (green line) regions displayed in Figures 2 and 3. The transition from in-vivo to ex-vivo (Glucose 1 hr) strongly changed both diffusion parameters, while it showed a mild increase for both MPM parameters. The largest change was observed in cGM: MD decreased by up to -60% and FA increased by more than 150%. Another interesting observation for MD was the change in cGM-WM contrast: in-vivo MD in cGM was smaller than in WM, but during fixation MD in cGM exceeded the MD in WM. The latter contrast prevailed, independent of whether we used the in-vivo or ex-vivo diffusion protocols (from 2500 s/mm2 in Figures 5A-B to 5000 s/mm2 in Figures 5C-D).
Discussion and Conclusion
Our findings confirmed the previously reported change in relaxation rate and diffusion parameters during fixation3,11, and provided new insights about their behaviour shortly after the human temporal lobe section was excised. After excision, we found that MD and FA changed strongly, whereas R1 and R2* remained almost unchanged. Well-known candidates for the change in diffusion parameters are reduced temperature, loss of perfusion, and cellular apoptosis; but it was recently shown that also a reduced para-vascular space can explain the observed changes12. A limiting factor of our study is that we used the same in-vivo MR protocols for the ex-vivo specimen, which could result in parameter-estimation bias. However, we aimed at reducing this bias in our diffusion study by using a more optimal diffusion protocol for the fixed ex-vivo specimens (max. b-value ~ 5000 s/mm2). The protocol slightly changed the estimated parameters, but did not affect the trend observed using the in-vivo diffusion protocol. In conclusion, our findings provide a missing link between in-vivo and fixed ex-vivo MRI that in future can facilitate in-vivo application of MRI-based microstructure mapping like estimating iron and myelin from relaxometry parameters1.Acknowledgements
This work was supported by the German Research Foundation (DFG Priority Program 2041 "Computational Connectomics”, [MO 2397/5-1; MO 2249/3–1], by the Emmy Noether Stipend: MO 2397/4-1) and by the BMBF (01EW1711A and B) in the framework of ERA-NET NEURON and the Forschungszentrums Medizintechnik Hamburg (fmthh; grant 01fmthh2017).References
- Stüber, C. et al. Myelin and iron concentration in the human brain: a quantitative study of MRI contrast. Neuroimage. 2014; 93:95-106. doi:10.1016/j.neuroimage.2014.02.026
- West, K. et al. Myelin volume fraction imaging with MRI. NeuroImage, 2018; 182:511-521. doi: 10.1016/j.neuroimage.2016.12.067
- Streubel, T. et al. Quantification of tissue shrinkage due to formalin fixation of entire post-mortem human brain, in: Proc. Intl. Soc. Mag. Reson. Med. 28. 2019.
- Berger, C. et al. Post mortem brain temperature and its influence on quantitative MRI of the brain. Magn Reson Mater Phy 2022; 35: 375–387 doi: 10.1007/s10334-021-00971-8
- Thavarajah, R. et al. Chemical and physical basics of routine formaldehyde fixation. J Oral Maxillofac Pathol 2012a; 16:400–405. doi:10.4103/0973-029X.102496
- Weiskopf, N. et al. Quantitative multi-parameter mapping of R1, PD(*), MT, and R2(*) at 3T: a multi-center validation. Front Neurosci 2013; 7:95.
- Friston, K., 2007. CHAPTER 2 - Statistical parametric mapping, in: FRISTON, K., ASHBURNER, J., KIEBEL, S., NICHOLS, T., PENNY, W. (Eds.), Statistical Parametric Mapping. Academic Press, London, pp. 10–31. doi: 10.1016/B978-012372560-8/50002-4
- Tabelow, K. et al. hMRI – A toolbox for quantitative MRI in neuroscience and clinical research. NeuroImage 2019; 194:191–210. doi:10.1016/j.neuroimage.2019.01.029
- Jenkinson, M. et al. FSL. NeuroImage, 2012; 62:782-90
- Fricke, B. et al. ACID - an open-source, bids compatible softwarefor brain and spinal cord dMRI: preprocessing, DTI/DKI, biophysical modelling, in: Proc. Intl. Soc. Mag. Reson. Med. 30. 2022.
- Dyrby TB et al. An ex vivo imaging pipeline for producing high-quality and high-resolution diffusion-weighted imaging datasets. Hum Brain Mapp. 2011; 32(4):544-563. doi:10.1002/hbm.21043
- Sepehrband F. et al. Alzheimer's Disease Neuroimaging Initiative. Perivascular space fluid contributes to diffusion tensor imaging changes in white matter. Neuroimage. 2019; 197:243-254. doi: 10.1016/j.neuroimage.2019.04.070.
Figures
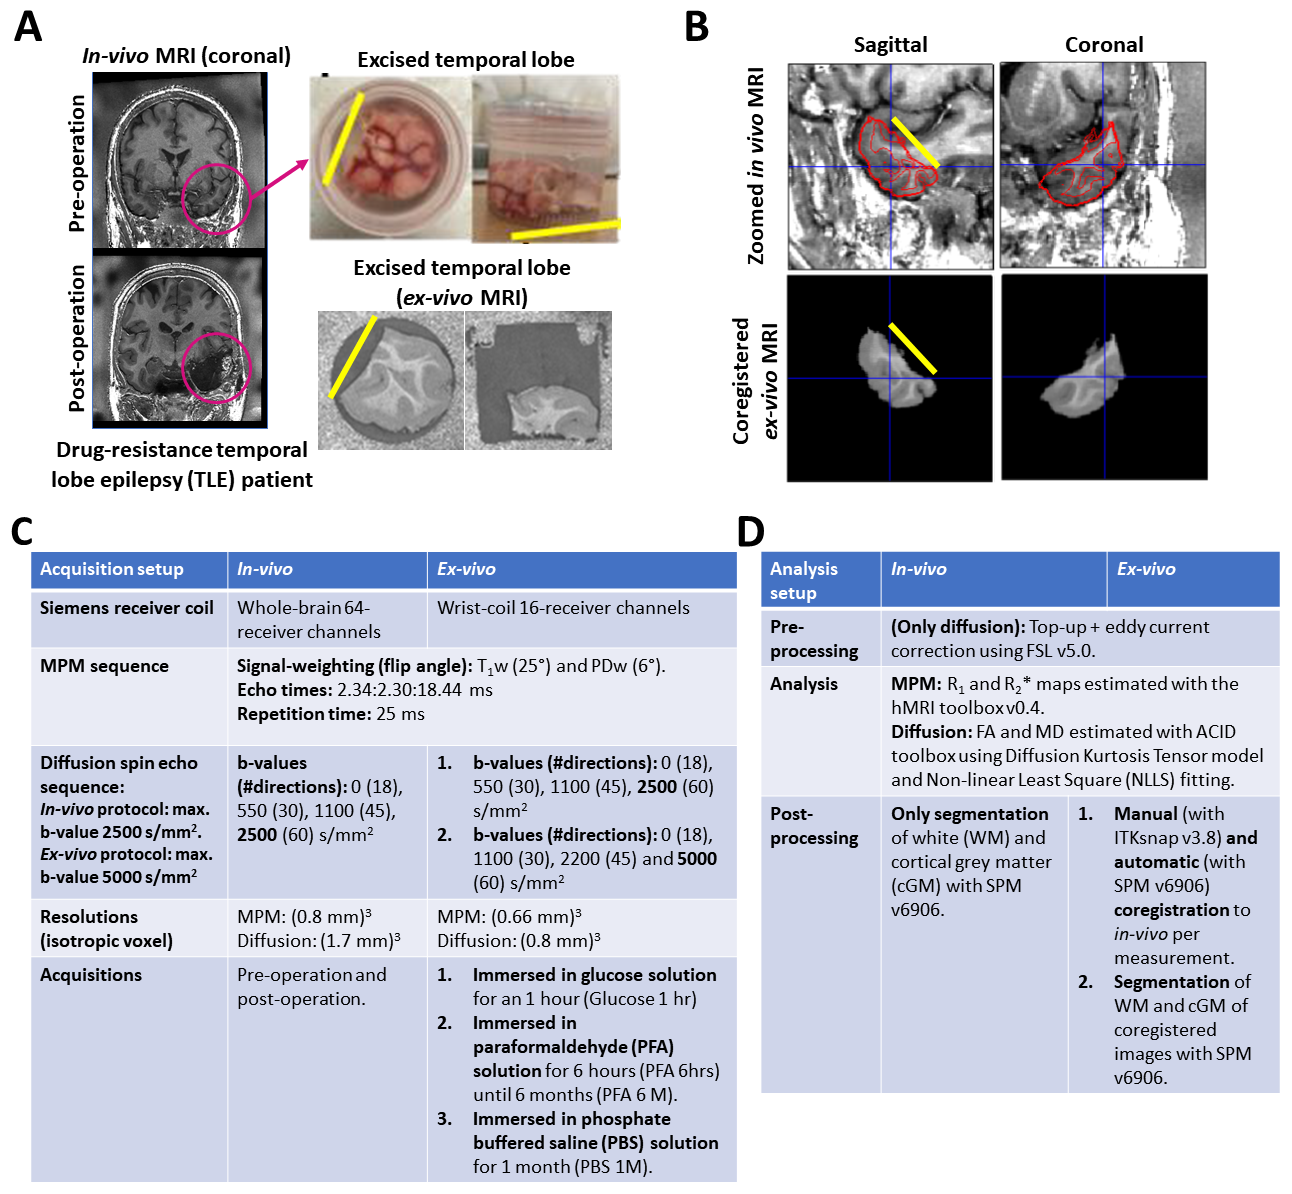
Figure 1: (A) Illustration of the acquired in-vivo (pre- and post-operation) and ex-vivo MRI, (B) resulting coregistration from ex-vivo to in-vivo, and (C-D) summary tables for the acquisition (Table C) and analysis (Table D) of the multiparametric mapping (MPM6) and diffusion MRI data for all measurements. The magenta circle in (A) indicates the excised temporal lobe. The yellow line is used as spatial reference in (A)-(B) to indicate the cutting plane. Echo times in (C) describes: first echo:echo steps:final echo. Software programs used: SPM7, hMRI toolbox8, FSL9 and ACID10.
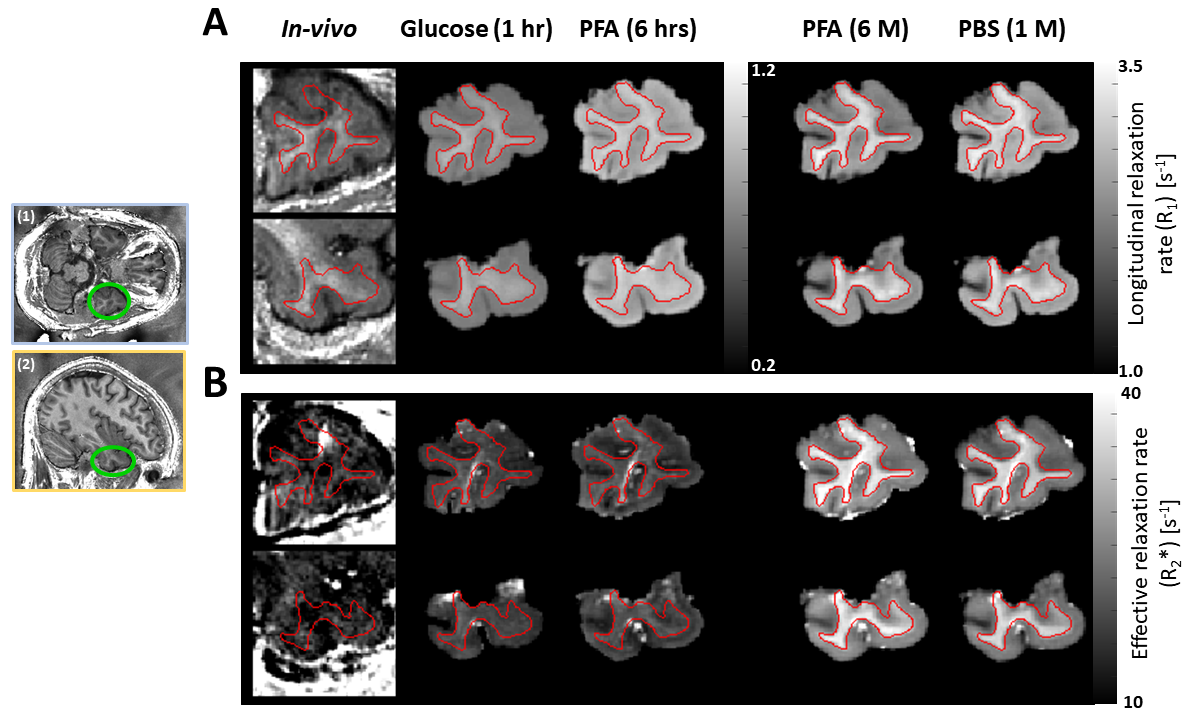
Figure 2: Contrast change of longitudinal and effective transverse relaxation rates (R1 and R2*) maps (A -B) in transverse (top, left insert (1)) and sagittal (bottom, left insert (2)) across three tissue stages: in-vivo, freshly excised in glucose (glucose 1 hr), fixed ex-vivo in 4% paraformaldehyde (PFA) for 6 hours (PFA 6 hrs) and 6 months (PFA 6 M), and later washed-out in phosphate buffer saline for one-month (PBS 1 M). Note: R1 maps were differently scaled. Red lines: white matter contour.
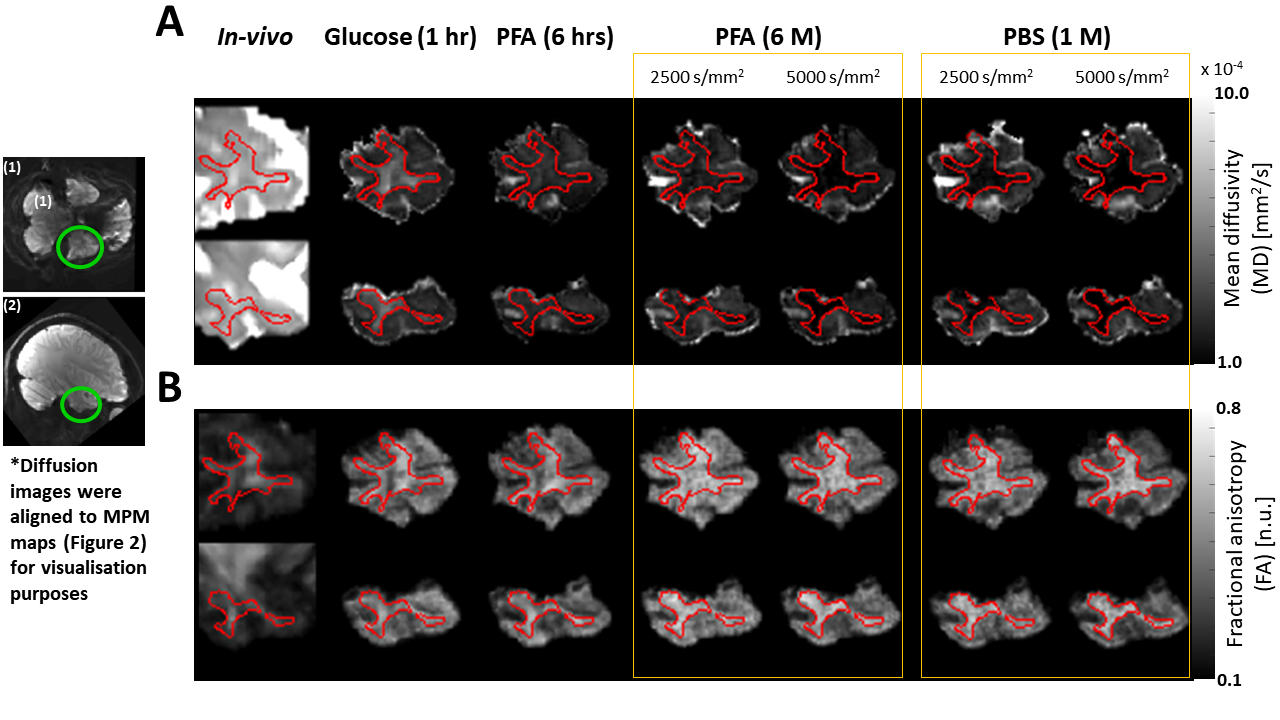
Figure 3: Contrast change of mean diffusivity and fractions anisotropy (MD and FA) maps (A -B) in coronal (top, left insert (1)) and sagittal (bottom, left insert (2)) across three tissue stages: in-vivo, freshly excised in glucose (glucose 1 hr), fixed ex-vivo in 4% paraformaldehyde (PFA) for 6 hours (PFA 6 hrs) and 6 months (PFA 6 M), and later washed-out in phosphate buffer saline for one-month (PBS 1 M). For PFA 6M and PBS 1M measurements, both in-vivo (2500 s/mm2) and ex-vivo (5000 s/mm2) diffusion analysis results are depicted. Red lines: white matter contour.
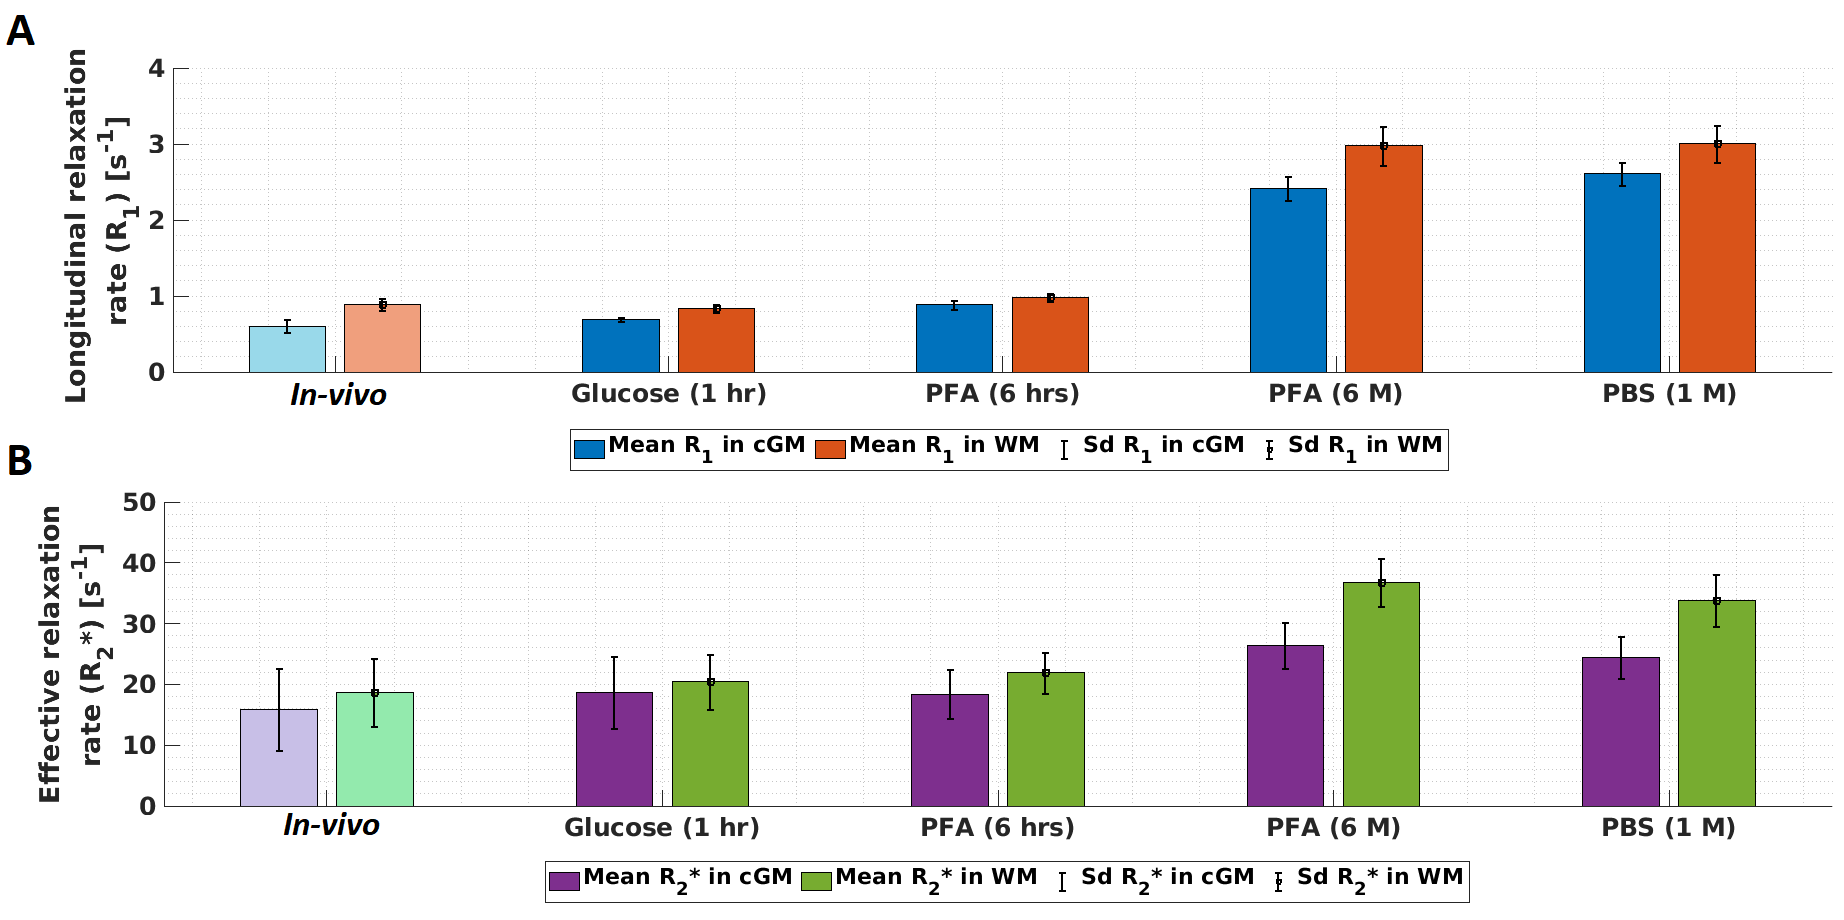
Figure 4: Temporal evolution of the mean and standard deviation (sd) of longitudinal and effective transverse relaxation rates (R1 in A and R2* in B) across three tissue stages: in-vivo, freshly excised, fixed ex-vivo. Statistics were measured for cGM (blue and magenta bars) and WM (orange and green bars) in the affected temporal lobe (Figure 2). For the in-vivo results, transparent colour bars remind that in-vivo measurements have lower spatial resolution (0.8 mm instead of 0.66 mm).
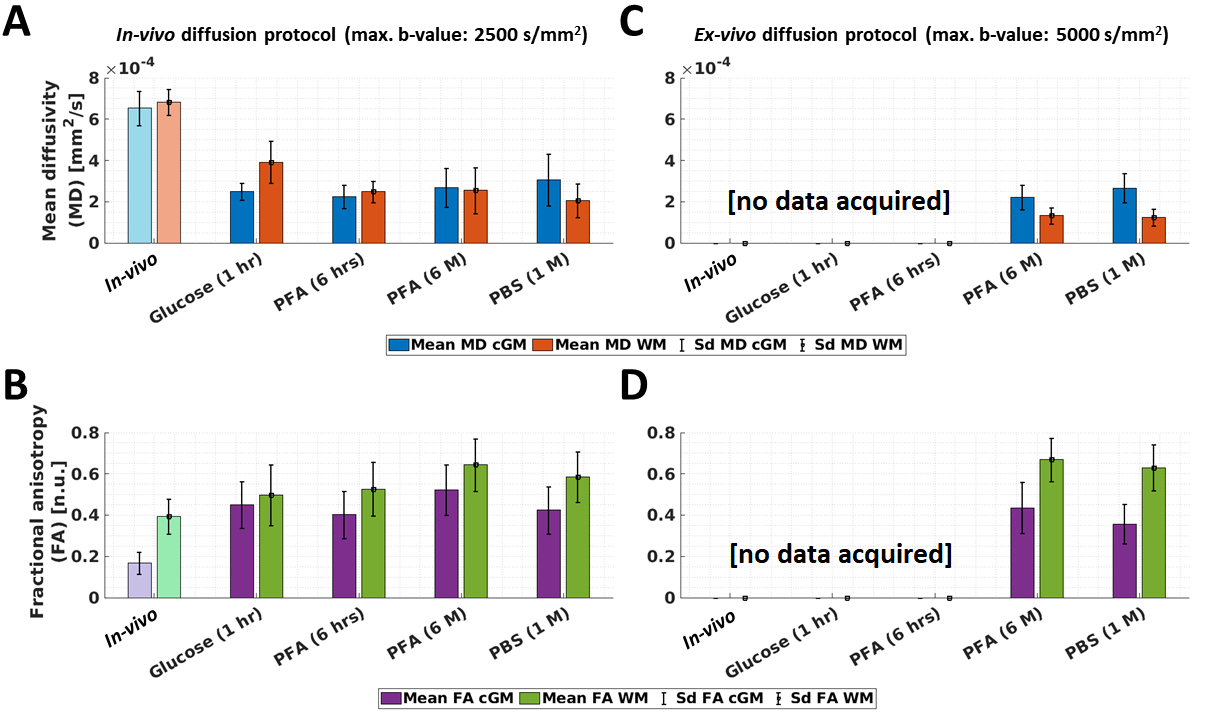
Figure 5: Temporal evolution of the mean and standard deviation (sd) of mean diffusivity and fractional anisotropy (MD in A and C; and FA in B and D) across three tissue stages: in-vivo, freshly excised, fixed ex-vivo. Statistics were measured for cGM (blue and magenta bars) and WM (orange and green bars) in the affected temporal lobe (Figure 3). For the in-vivo results, transparent colour bars remind that in-vivo measurements have lower spatial resolution (1.7 mm instead of 0.8 mm). For C and D, ex-vivo diffusion protocol was not used for in-vivo and ex-vivo in glucose and PFA 6 hrs.
DOI: https://doi.org/10.58530/2023/1260