1259
Histological Validation of MR Cell Size and Cellularity Imaging with Human Liver Specimens
xiaoyu jiang1, John Gore2, and Junzhong Xu3
1Radiology, Vanderbilt University Medical Center, nashville, TN, United States, 2Vanderbilt University Medical Center, nashville, TN, United States, 3Vanderbilt University Medical Center, Brentwood, TN, United States
1Radiology, Vanderbilt University Medical Center, nashville, TN, United States, 2Vanderbilt University Medical Center, nashville, TN, United States, 3Vanderbilt University Medical Center, Brentwood, TN, United States
Synopsis
Keywords: Quantitative Imaging, Liver, microstructure; diffusion; inflammation
The size and cellularity of hepatocytes, their variations and changes over time, are fundamental characteristics of liver tissues, and measurements of cell sizes and cellularities may have high clinical significance but currently can be obtained only by liver biopsy. We quantified the microstructures of human liver specimens with different liver diseases, including normal liver tissues, cirrhosis, steatosis, hepatocellular carcinoma (HCC), cirrhotic regenerative nodules (CRN), and intrahepatic cholangiocarcinoma (iCCA), using MR cell size imaging ex vivo. The accuracy of MR-derived cell sizes and cellularities were evaluated by comparisons to histology.Introduction
Liver biopsy remains the standard method for evaluating the etiology and extent of diseases of the liver. Although liver biopsy is generally safe, sampling errors, rare complications, intra/inter-observer variability, and significant patient anxiety, may all occur in practice. These factors have led to keen interest in the development of noninvasive tests and imaging techniques for the diagnosis and management of liver diseases. The cell size and cellularity, particularly their variations over time, are fundamental characteristics of liver tissues, and measurements of cell sizes and cellularities provide diagnostic biomarkers of several normal and pathological processes. Measurements of cell sizes and cellularities thus have high clinical significance but currently can be obtained only by liver biopsy. We hypothesized that a diffusion MRI-based cell size and cellularity imaging technique (IMPULSED, Imaging Microstructural Parameters Using Limited Spectrally Edited Diffusion) 1-3 that extracts microstructural parameters, including mean cell size and cellularity, from the diffusion time dependency of hindered/restricted diffusions in solid tissues, can quantify pathological changes in liver microstructures. This study represents an initial histological validation of this new concept using human liver specimens of different liver diseases, including normal liver tissues, cirrhosis, steatosis, hepatocellular carcinoma (HCC), cirrhotic regenerative nodules (CRN), and intrahepatic cholangiocarcinoma (iCCA).Theory
IMPULSED is a multi-compartment diffusion-based method within the framework of temporal diffusion spectroscopy (TDS). The imaging protocol includes a combination of acquisitions using gradients with different waveforms (OGSE (oscillating gradient spin echo) for short tdiff (e.g., ≤ 5 ms) and bipolar gradients as in PGSE (pulsed gradient spin echo) or STEAM (stimulated echo acquisition mode) for relatively long tdiff (e.g., ≥ 30 ms)) which provide sufficient coverage of diffusion times for characterizations of tumor microstructure. Data fittings were performed using an in-house developed software package (https://github.com/jzxu0622/mati.git).Methods
Human liver specimens were fixed with 10% neutral buffered formalin for 48 hours, and then transferred to PBS solution for 24 hours. Specimens were embedded in a 3D-printed holder with 4% agarose. The specially designed tissue holder has evenly spaced gaps with a gap width of 0.5 mm (the width of a blade) and 5 mm between gaps, which allows accurate registration between histology and MR results. TDS acquisitions were performed using a 4.7T scanner. For PGSE experiments, diffusion gradient duration/separation δ/Δ = 3/11 ms. The OGSE acquisitions used frequencies at 50Hz with δ / Δ = 20/25 ms. For STEAM experiments, diffusion gradient duration/separation δ/Δ = 3/71 ms. Five b-values spaced at equal logarithmic intervals from 0 to either 1000 s/mm2 or the allowed maximum b value (limited by the maximum gradient strength of 360 mT/m in a single direction) were used to derive estimates of the diffusion coefficient at each diffusion time.Results
Figure 1 shows that most cells in normal liver tissues and CRN are hepatocytes, which are bigger than tumor cells in HCC and iCCA. In fatty liver areas, the accumulation of fat in hepatocytes results in either a single large fat vacuole or several smaller ones that occupy the greater part of the cell, pushing the nucleus to the periphery. Stroma tissues have a higher cellularity than normal liver tissues and CRN. These findings are supported by maps of MRI and histology-derived cell size and cellularity. Both histology (Figure 2) and MRI results (Figure 3) show that i) HCC and iCCA tissues have significantly smaller cell sizes and higher cellularities than normal liver and CRN without steatosis; and ii) cell sizes for fatty areas (the average fat fraction ~ 13%) and CRN with steatosis (the average fat fraction ~ 11%) are smaller than those for normal liver (the average fat fraction ~ 6%) and CRN without steatosis (the average fat fraction ~ 5%). Figure 4 demonstrates the linear correlation between histology- and MR-derived cell sizes and cellularities of all 116 ROIs with Spearman’s tau correlation coefficients = 0.65 and 0.58, respectively, both with p<0.0001. MR-derived cell sizes are almost the same as histology-derived cell sizes, while MR-derived cellularities are higher than histology-derived cellularities. Figure 5 was plotted with a combination of MR-derived cell size with cellularity (Figure 6A) and with fat fraction (Figure 6B) to differentiate different liver pathological conditions. Consistent with results shown in Figures 3 and 4, cell size or cellularity or both produce a good separation of normal liver tissues and CRN without steatosis from other liver pathological conditions. The inclusion of fat fraction with MRI-derived cell size provides an additional separation of fatty liver tissues and CRN with steatosis from other pathological conditions such as HCC, iCCA, and stroma.Conclusions
This ex vivo study demonstrated the ability of MRI to characterize pathological changes in liver microstructure that are confirmed by histology. Both MRI and histology measurements showed that HCC, iCCA, and stroma have significantly smaller cell sizes and higher cellularities than normal liver and CRN without steatosis. MRI-derived cell sizes and cellularities are moderately correlated with histology-derived cell sizes and cellularities with Spearman’s tau correlation coefficient = 0.65 and 0.58, respectively. The imaging protocol used in this study is feasible on clinical scanners, so these findings provide a solid foundation for future human imaging studies with goals of evaluating the clinical value of diffusion MRI in the diagnosis of liver diseases.Acknowledgements
No acknowledgement found.References
1 Jiang, X. et al. Quantification of cell size using temporal diffusion spectroscopy. Magnetic resonance in medicine 75, 1076-1085, doi:10.1002/mrm.25684 (2016).
2 Jiang, X. et al. In vivo imaging of cancer cell size and cellularity using temporal diffusion spectroscopy. Magnetic resonance in medicine 78, 156-164, doi:10.1002/mrm.26356 (2017).
3 Xu, J. et al. Magnetic resonance imaging of mean cell size in human breast tumors. Magnetic resonance in medicine 83, 2002-2014, doi:10.1002/mrm.28056 (2020).
Figures
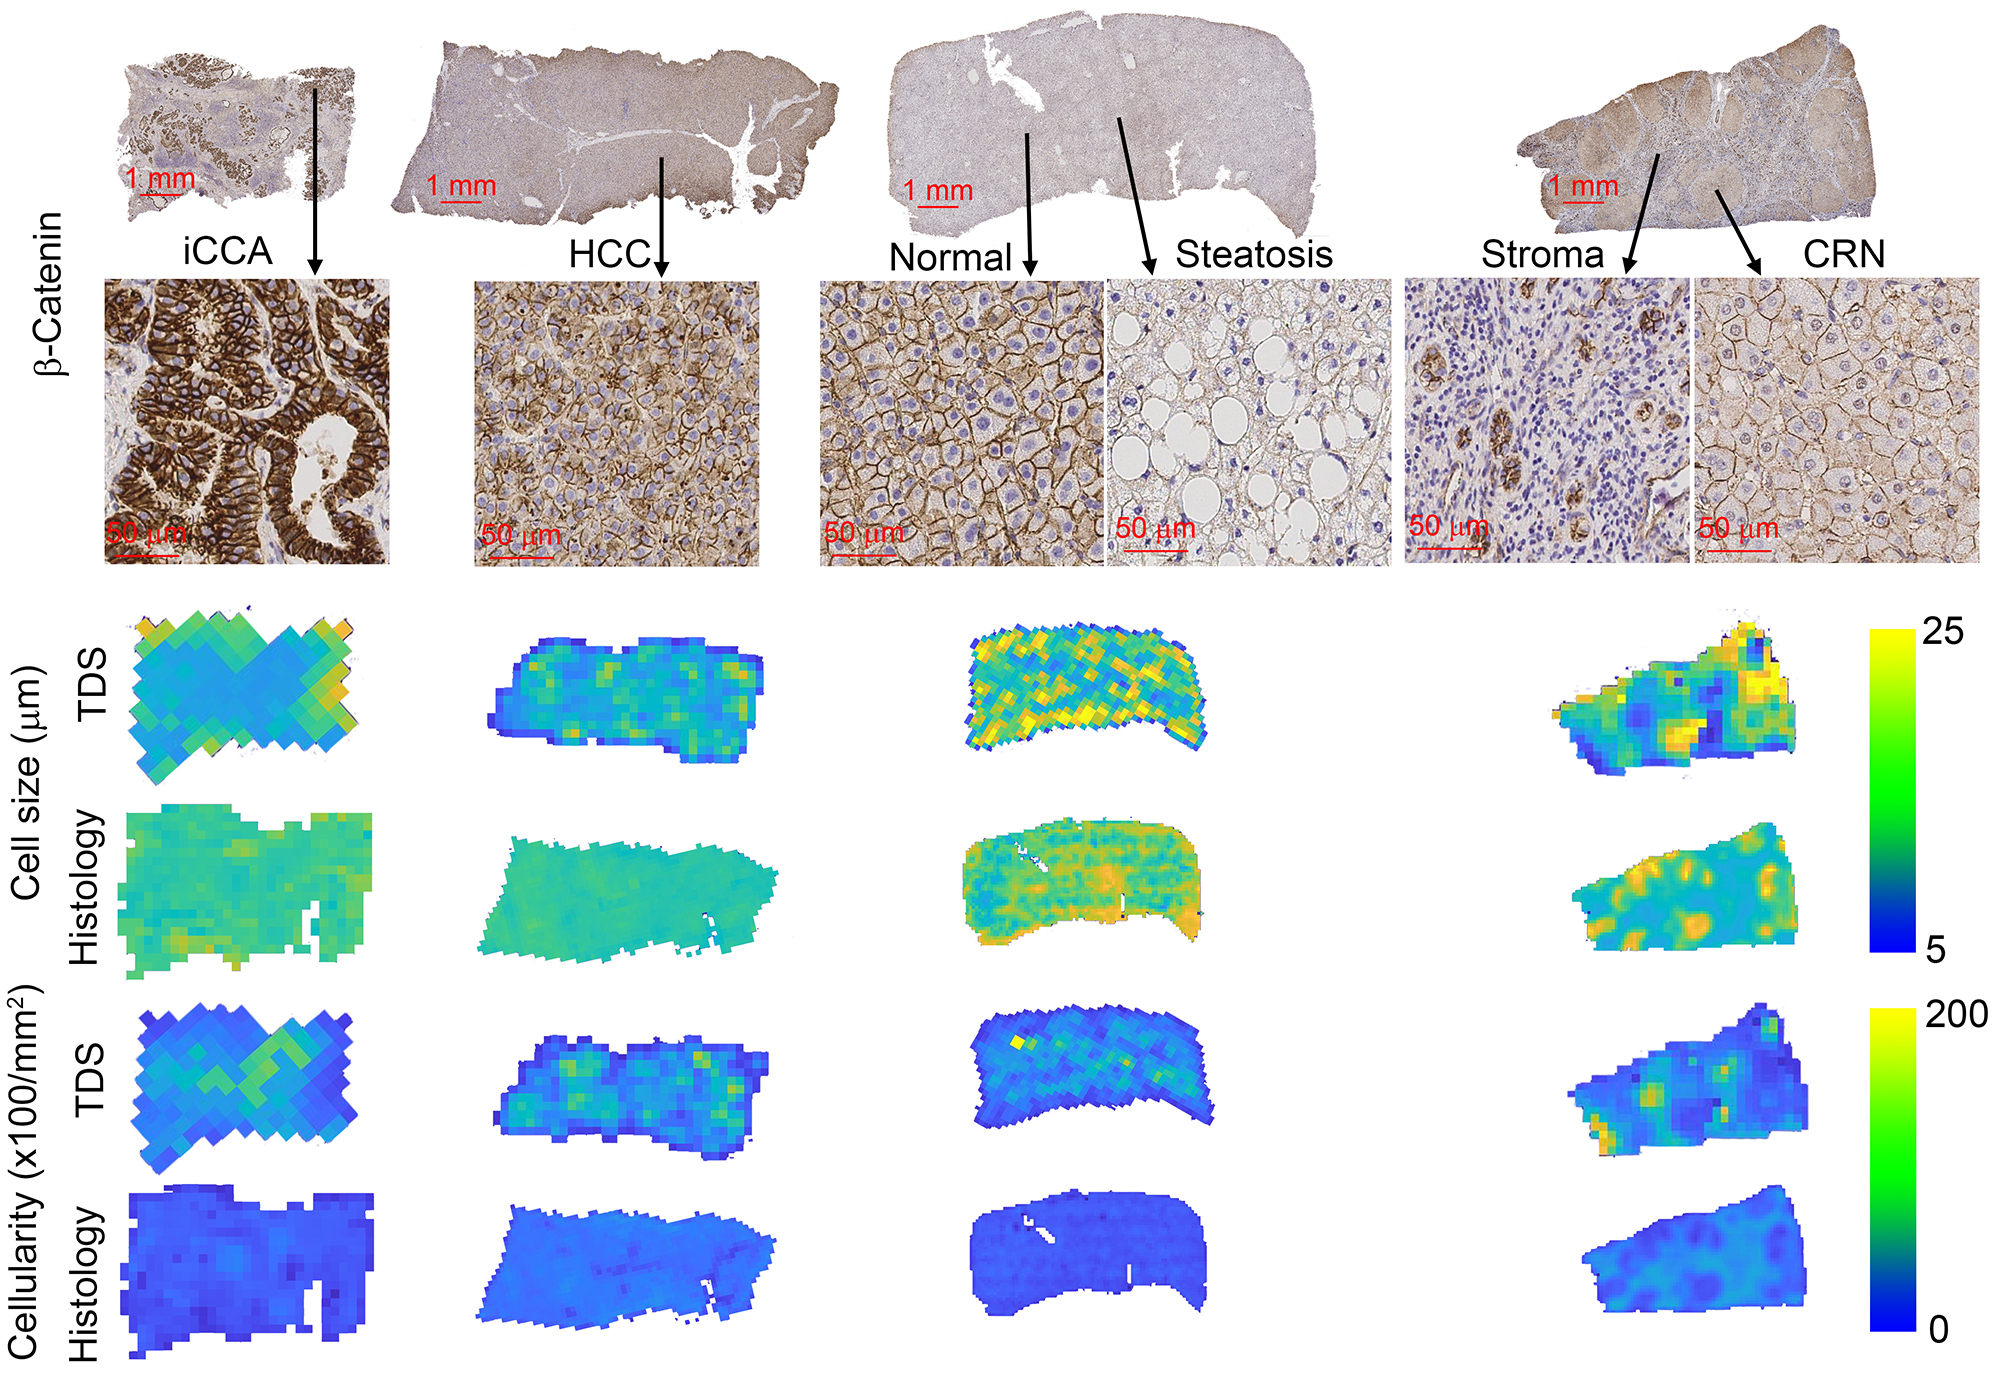
β-Catenin stained
histological pictures and corresponding MRI and histology-derived maps of cell
size and cellularity from four human liver specimens, including iCCA, HCC, a
sample with moderate steatosis, and a sample with cirrhosis resulting from
NASH.
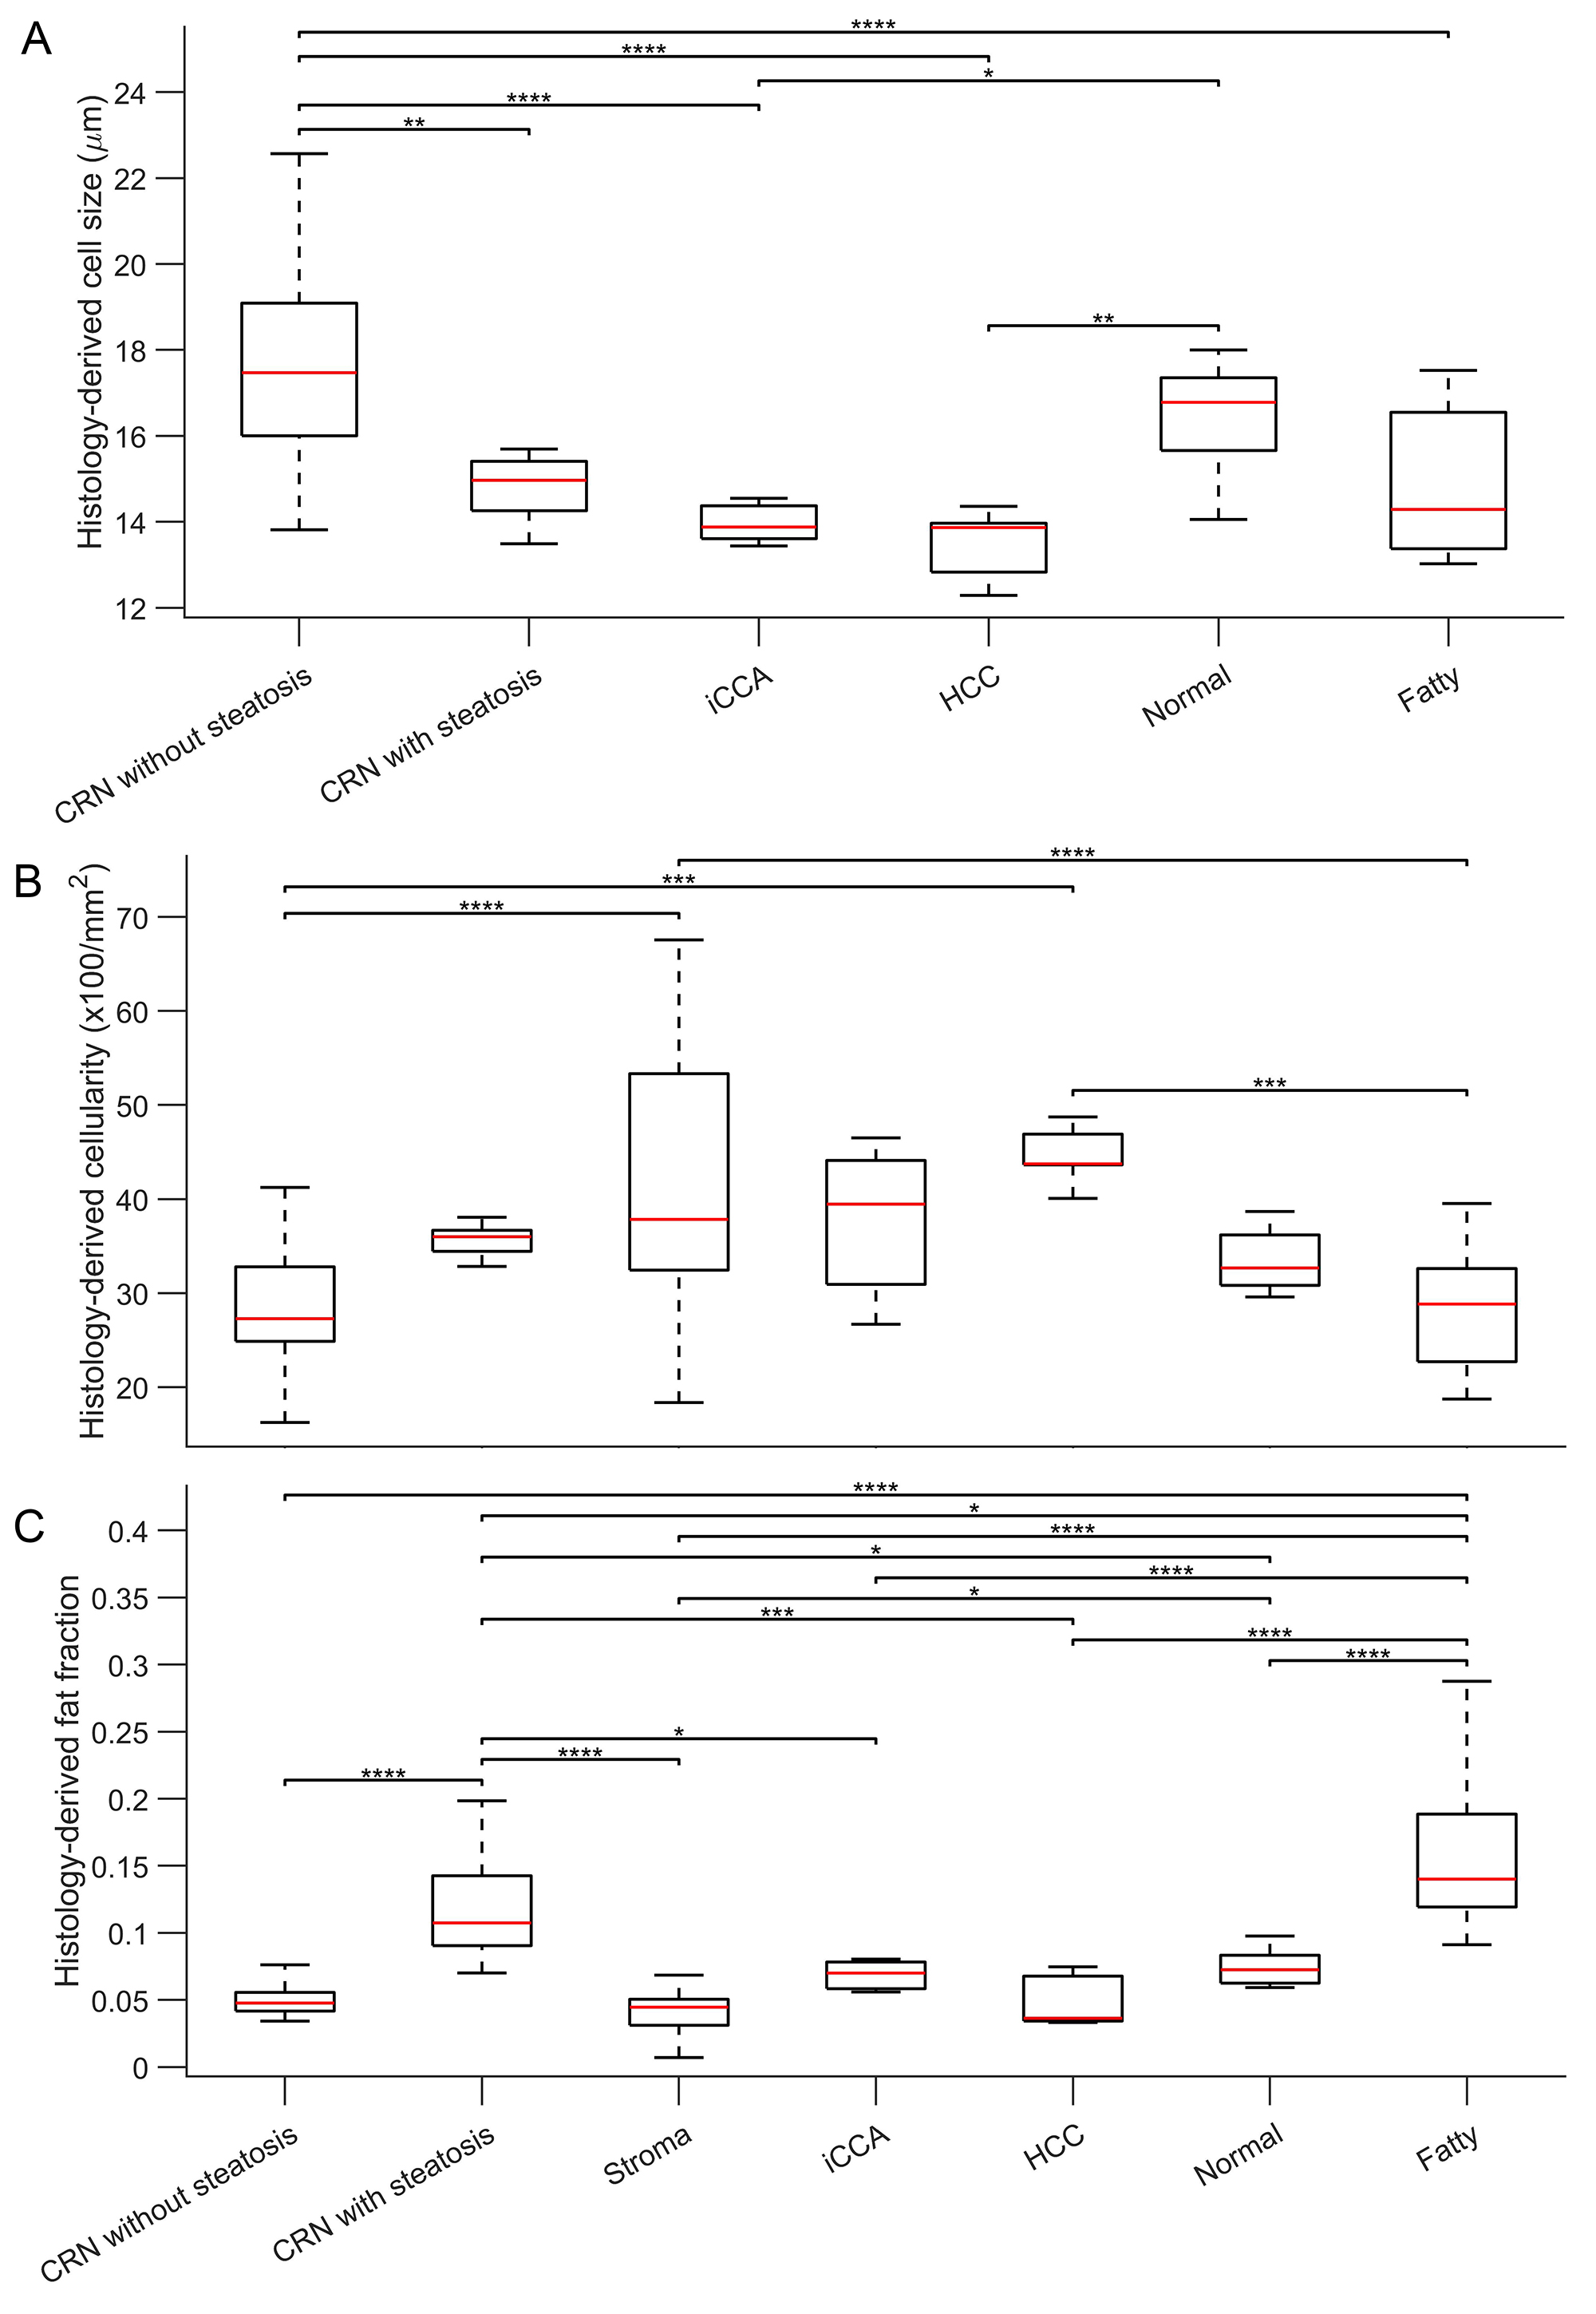
Box-and-whisker plots of
histology-derived cell sizes (A), cellularities (B), and fat fractions (C) for
liver ROIs with different pathologies. For all the Box-and-whisker plots, the
25th-75th percentiles are blocked by the box, the red bands inside the box are
the mean values, and the whiskers mark the SD. *P<0.05, **P<0.01, ***P<0.001,
and ****P<0.0001 as measured by one-way analysis of variance (ANOVA) with
the Bonferroni correction.
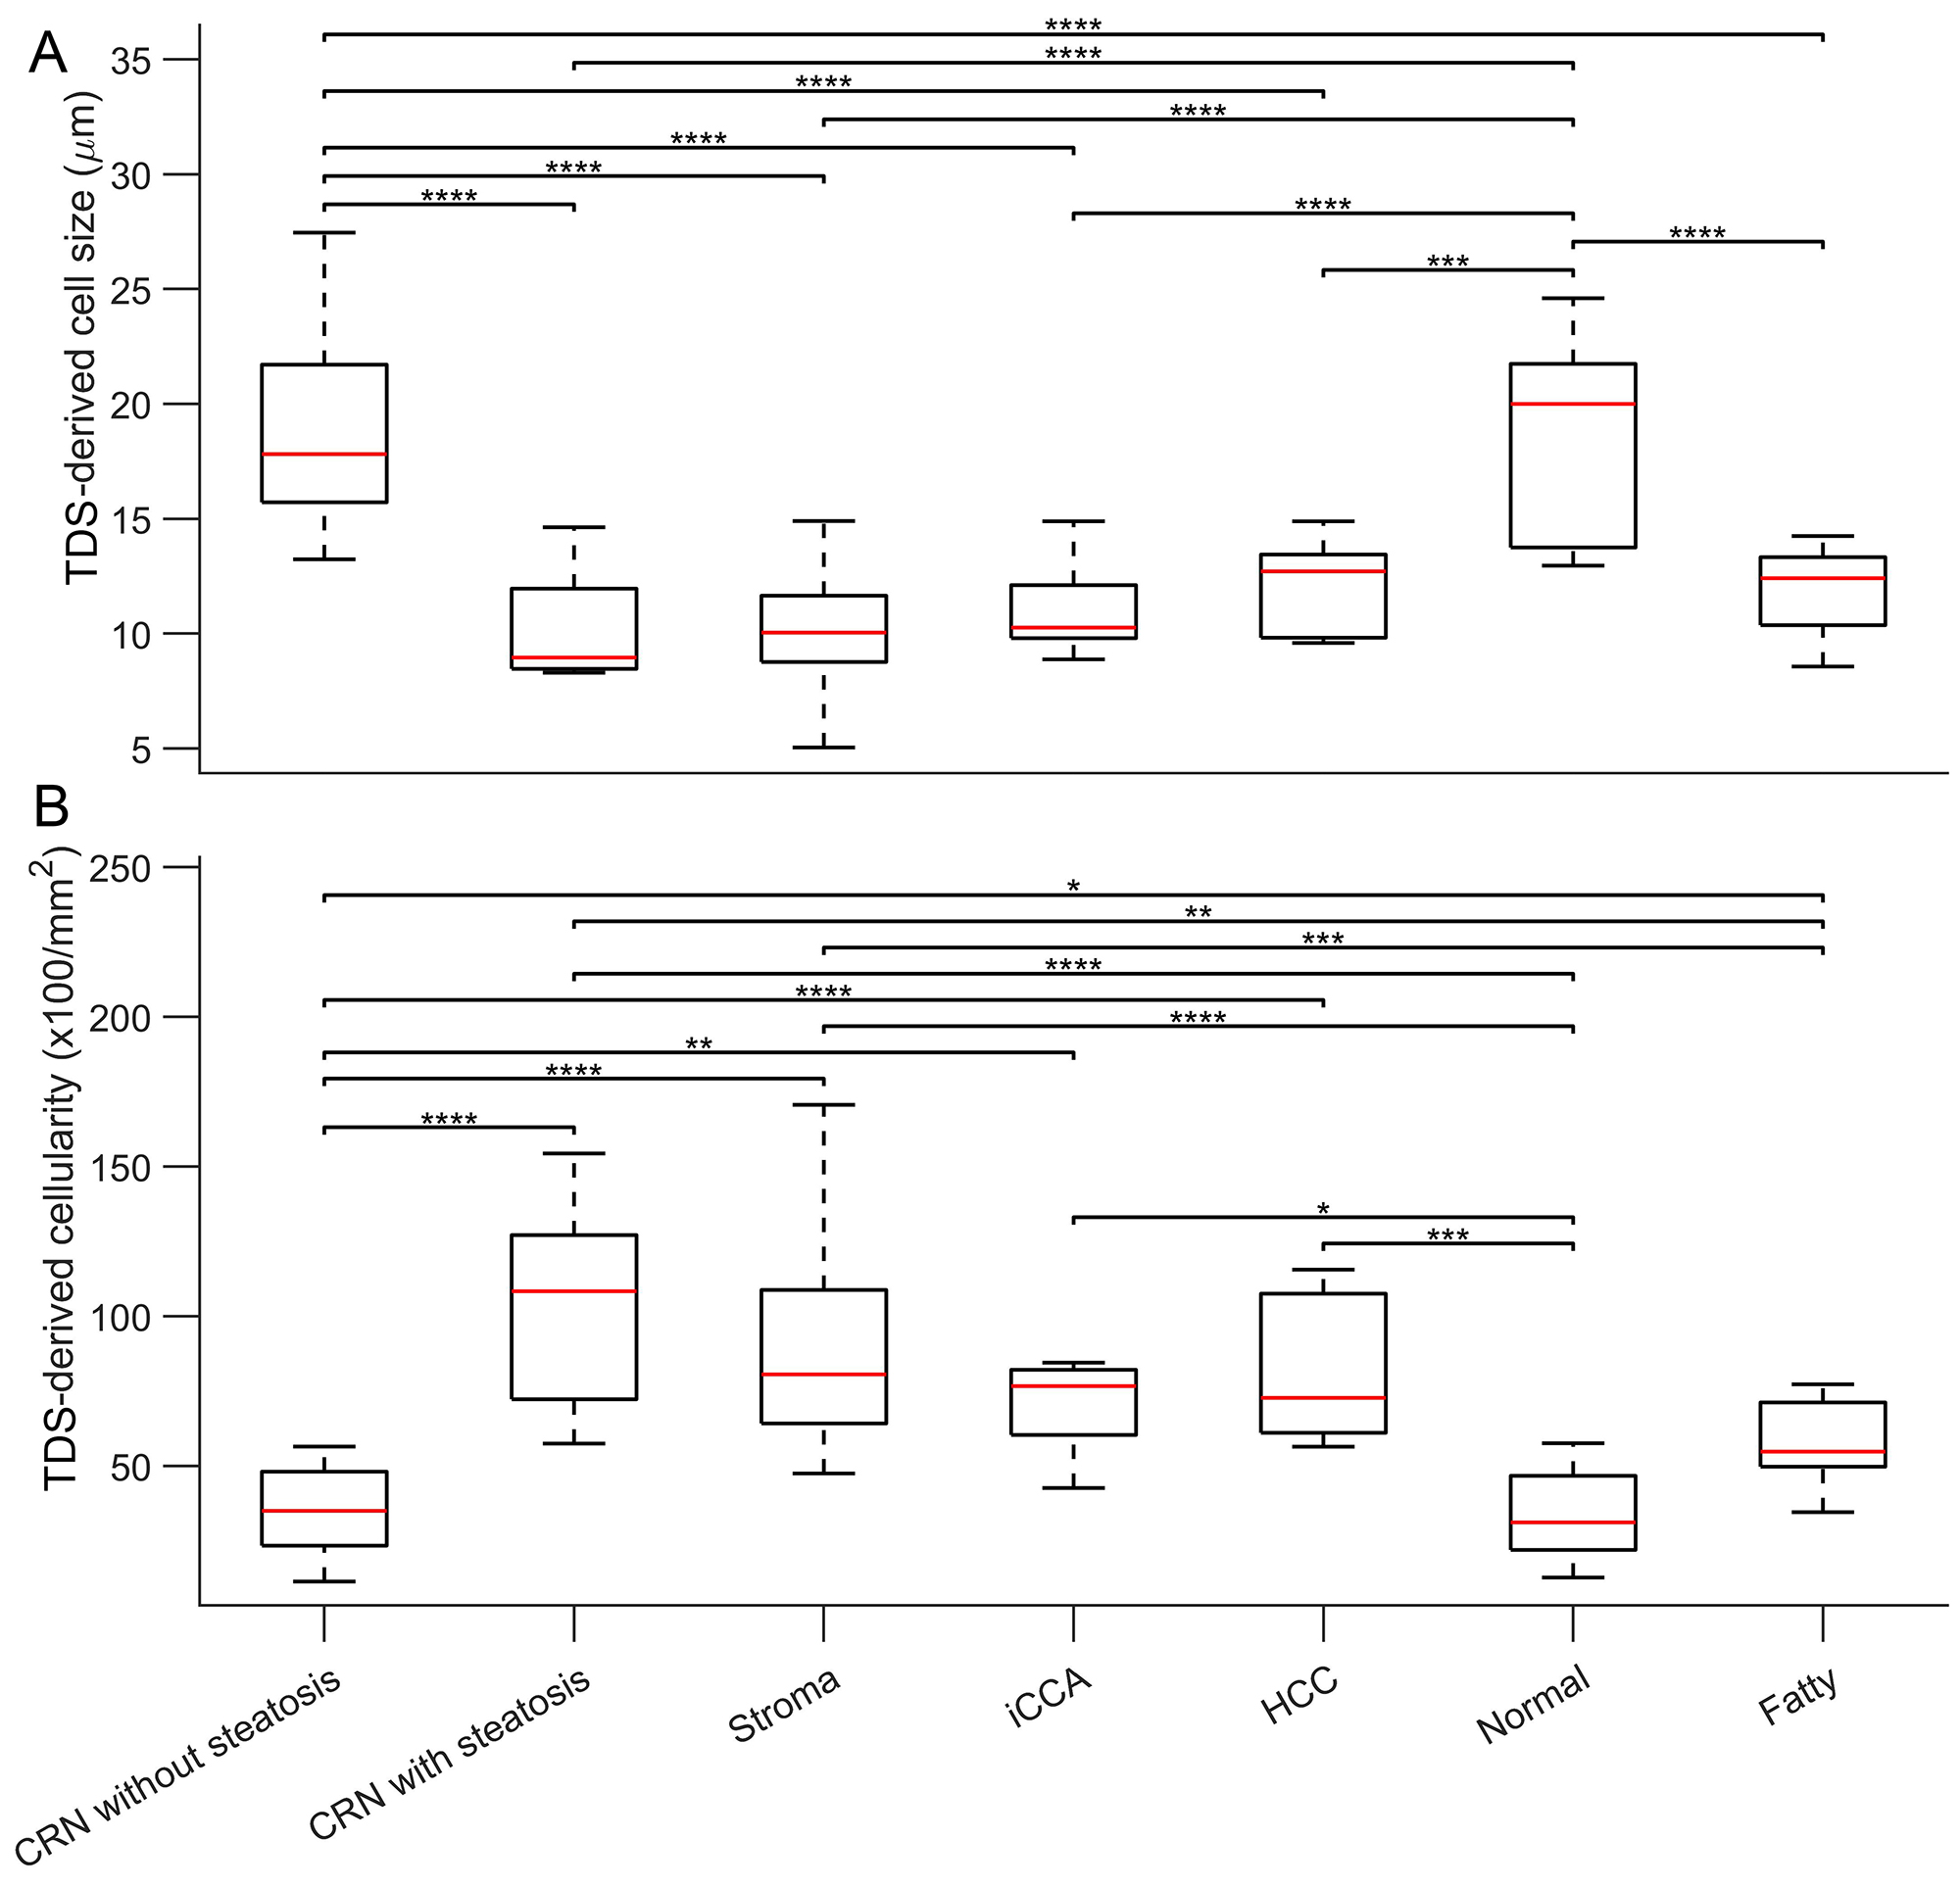
Box-and-whisker plots of
MRI-derived cell sizes (A) and cellularities (B) for liver ROIs with different
pathologies. For all the Box-and-whisker plots, the 25th-75th percentiles are
blocked by the box, the red bands inside the box are the mean values, and the
whiskers mark the SD. *P<0.05, **P<0.01, ***P<0.001, and ****P<0.0001
as measured by one-way analysis of variance (ANOVA) with Bonferroni correction.
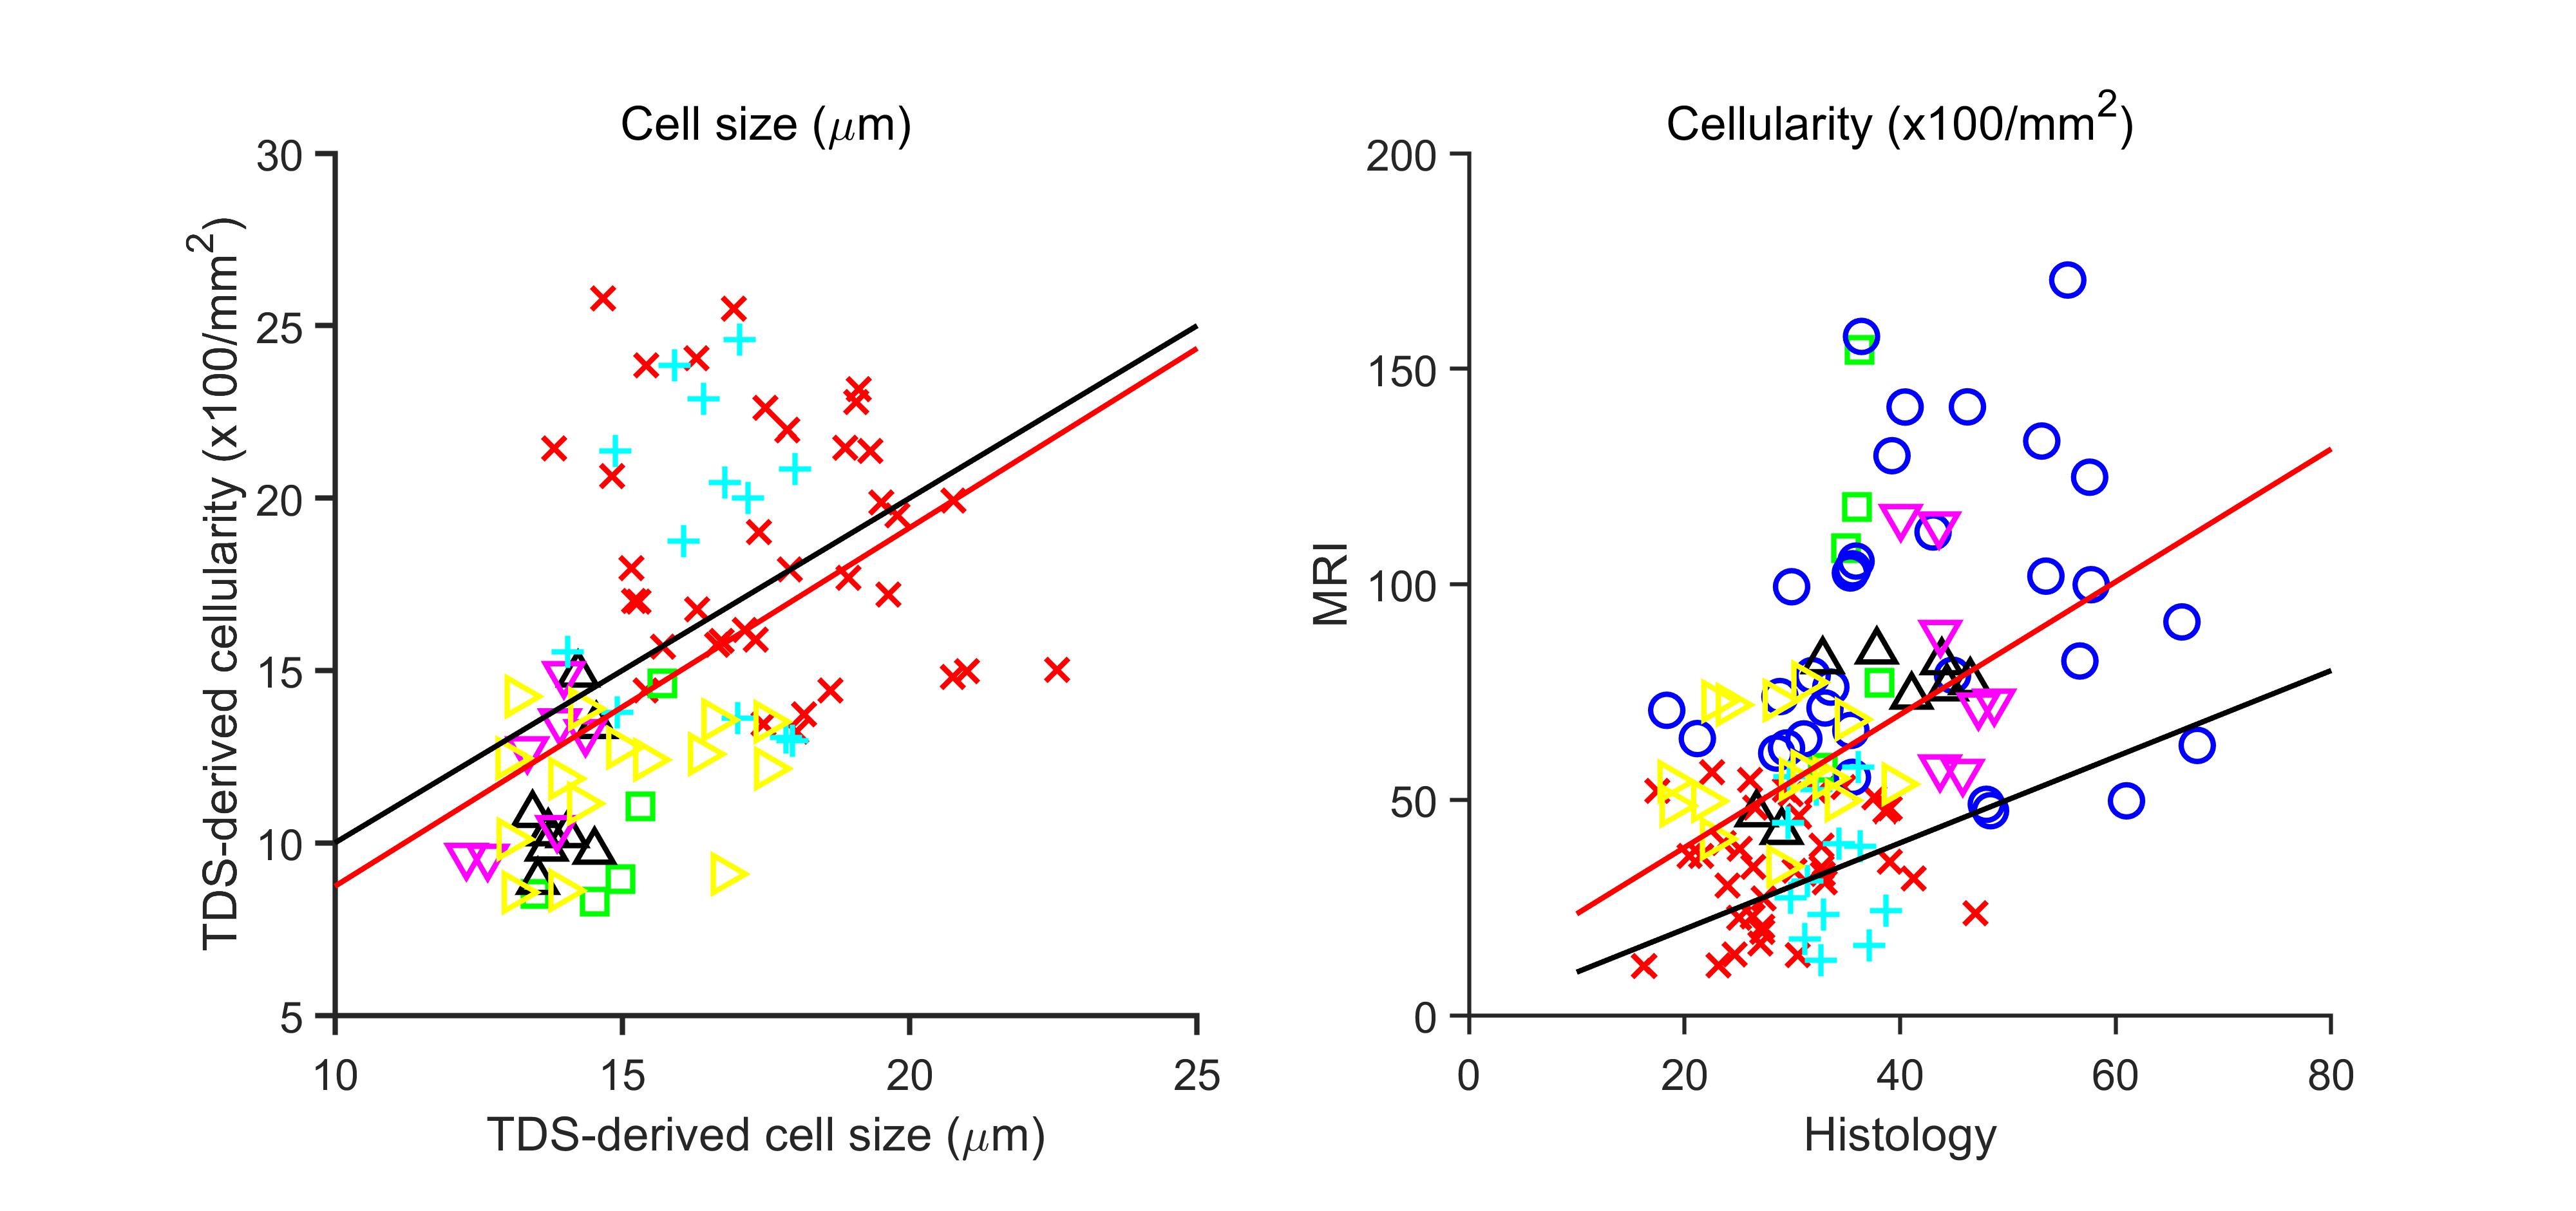
(A) Correlation between
histological-derived cell sizes and MRI-derived cell sizes for all the liver
ROIs. (B) Correlation between histological-derived cellularities and MRI-derived
apparent cellularities for all the liver ROIs.
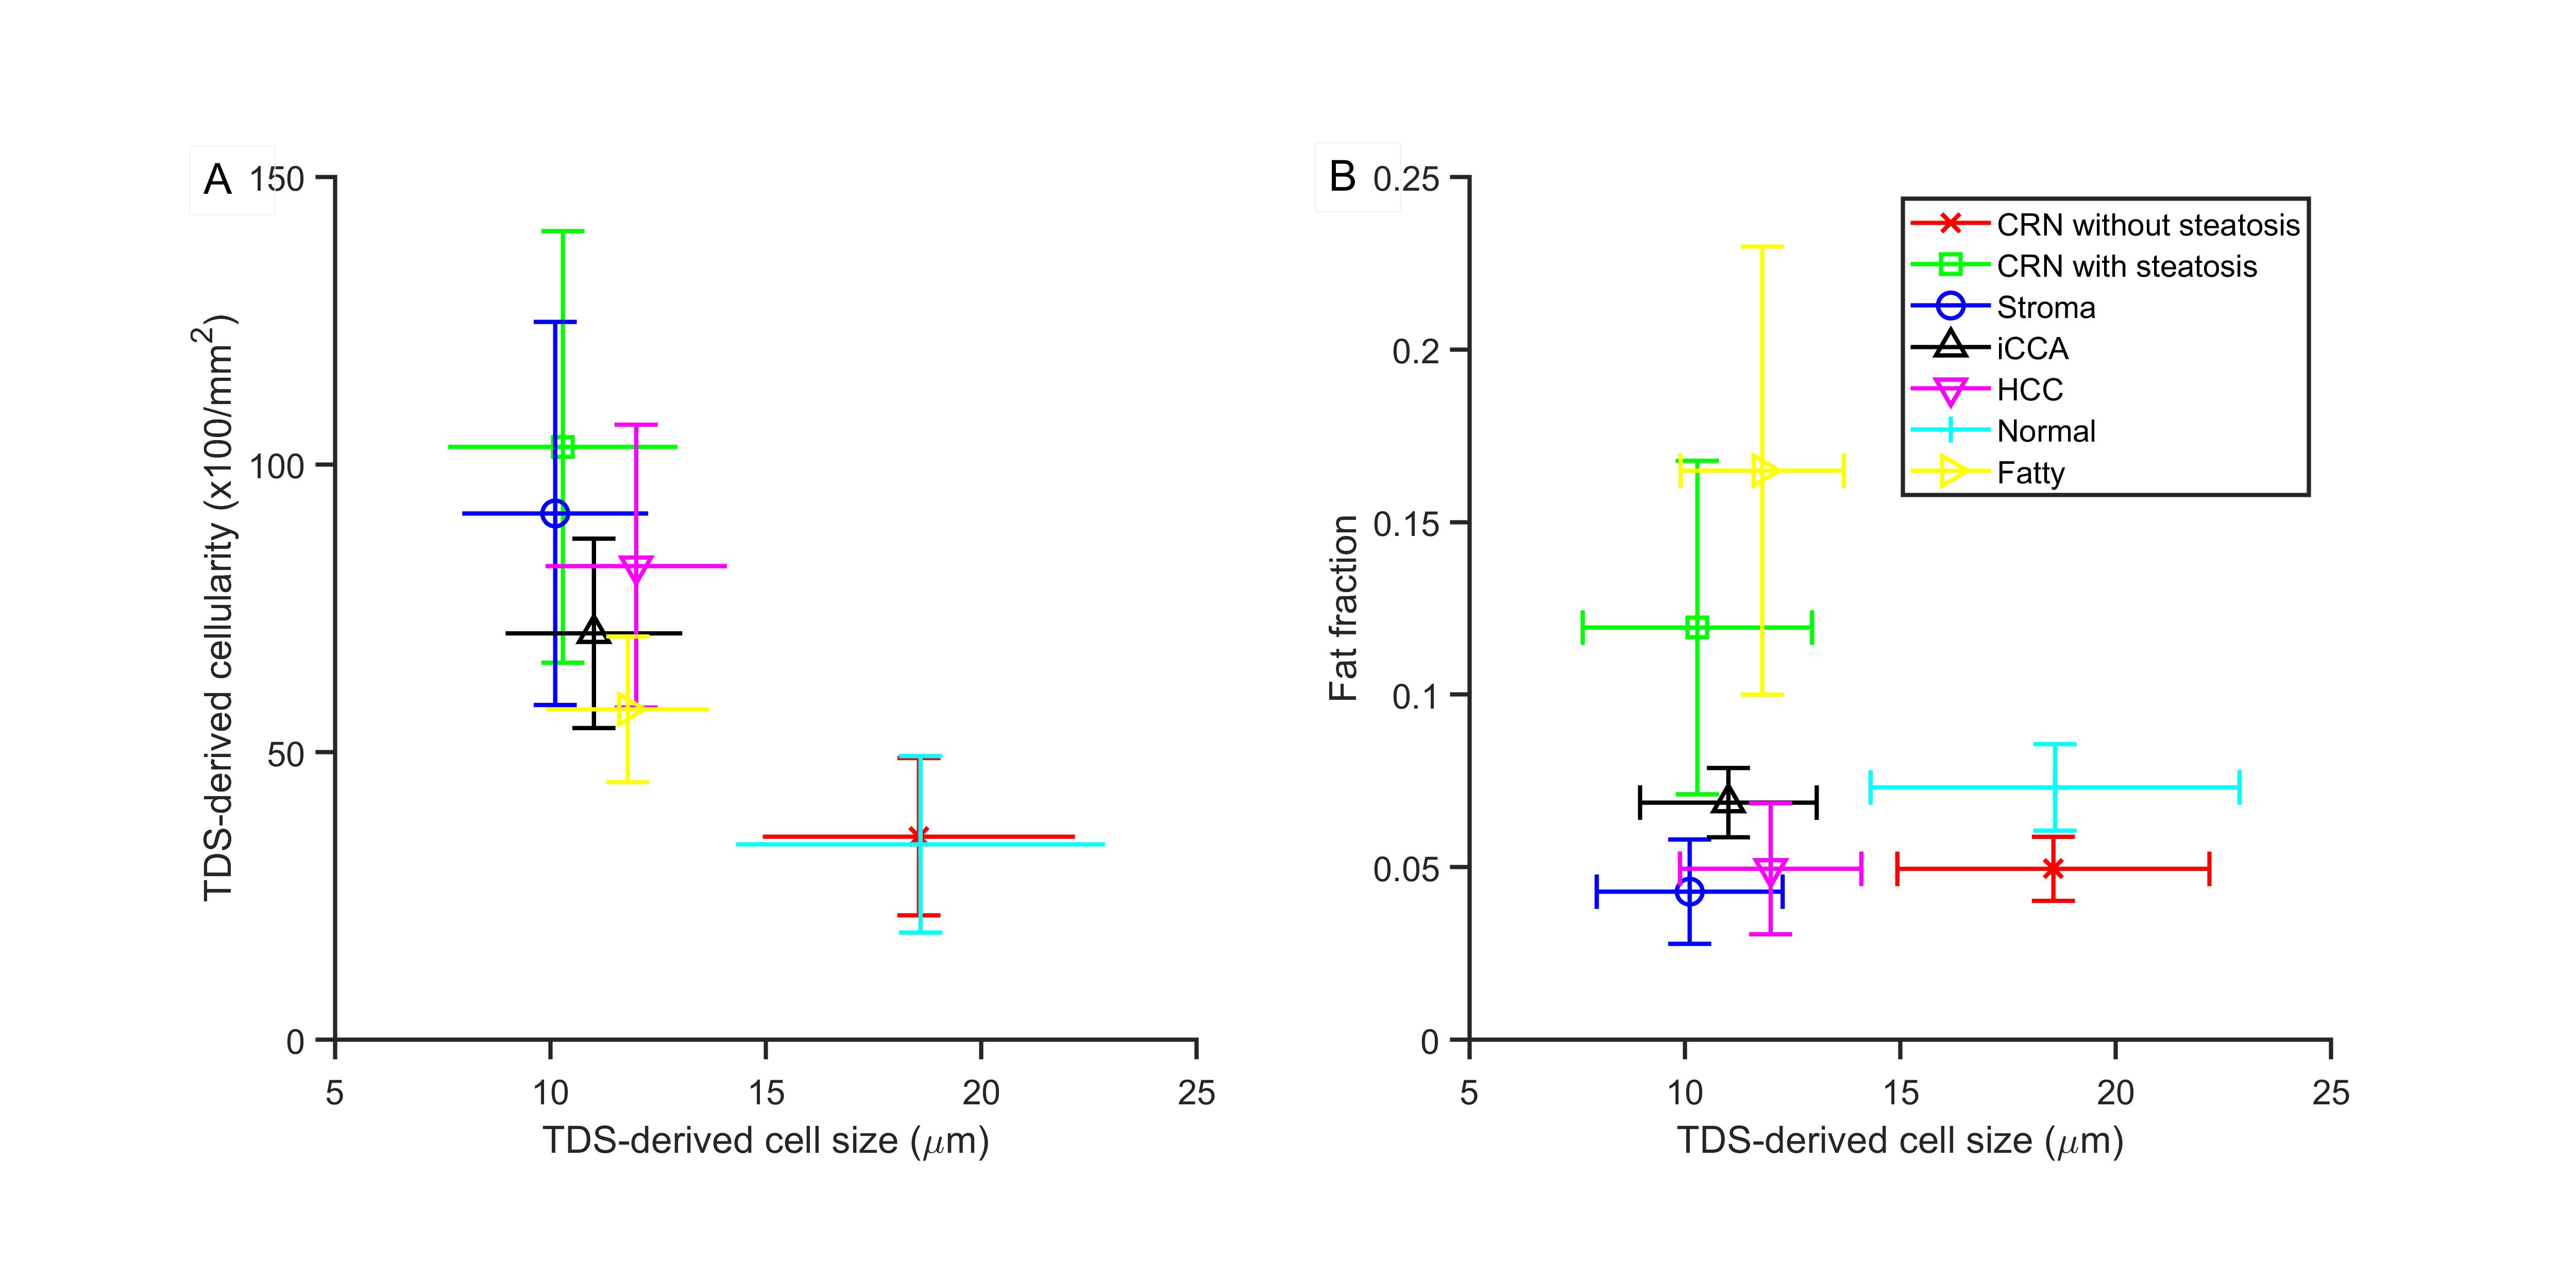
Means and standard
deviations of (A) MRI-derived cell size and cellularity; (B) MRI-derived cell
size and histology-derived fat fractions.
DOI: https://doi.org/10.58530/2023/1259