1258
Sex-specific changes and association in multiparametric MRI measurement at 3T in adult livers
Chia-Ying Liu1, Chikara Noda2, Rob van der Geest3, Bruno Triaire4, Yoshimori Kassai4, David A Bluemke5, and Joao Lima2
1Canon Medical Systems Corporation, Ellicott City, MD, United States, 2Division of Cardiology, School of medicine, Johns Hopkins University, Baltimore, MD, United States, 3Department of Radiology, Leiden University Medical Center, Leiden, Netherlands, 4Canon Medical Systems Corporation, Tochigi, Japan, 5Department of Radiology, University of Wisconsin, Madison, WI, United States
1Canon Medical Systems Corporation, Ellicott City, MD, United States, 2Division of Cardiology, School of medicine, Johns Hopkins University, Baltimore, MD, United States, 3Department of Radiology, Leiden University Medical Center, Leiden, Netherlands, 4Canon Medical Systems Corporation, Tochigi, Japan, 5Department of Radiology, University of Wisconsin, Madison, WI, United States
Synopsis
Keywords: Quantitative Imaging, Liver, parametric mapping; PDFF
Imaging biomarkers derived from multiparametric MRI have been investigated for the evaluation of diffuse liver disease. We aimed to determine the sex-specific correlation of MRI parameters with age and BMI, and to evaluate the association between multiparametric MRI parameters. 100 study participants without known hepatic disease were prospectively enrolled. 3 T MRI including T1, T2 and T1ρ mapping and proton density fat fraction (PDFF) and R2* maps were acquired. Multiparametric MRI measures have sex-specific age and BMI dependency. Relaxometry mapping indices could be associated with PDFF. PDFF was significant associated with R2* and T1ρ, but not to T1 or T2.Introduction
Quantitative MRI maps tissue-specific MR physical properties to provide indices of microstructure and related pathological processes in a time-efficient manner. Hepatic fibrosis and inflammation result in higher T1, T2, and T1ρ relaxation times due to an excessive accumulation of extracellular matrix proteins and water. Although multiparametric MRI has shown to be useful in evaluating disease severity1, overwhelming gray zones with wide overlap across severity grades in MRI-derived parameters also restrict its clinical relevance2. The coexistence of fat and iron confounds the measured relaxation times3-5. The relationships between fat and relaxometry parameters have not been fully investigated in normal livers. The aim of the present study was twofold. First, we investigated the sex-specific correlation of MRI parameters with age and body mass index (BMI) and then evaluated the association among hepatic multiparametric mapping parameters including T1, T2, R2*, and T1ρ and proton density fat fraction (PDFF) measurements in adult livers that were free from liver fibrosis and complications.Methods
All participants were imaged using a 3T MRI systems (Galan, Canon Medical Systems, Japan). Hepatic PDFF was assessed using chemical shift-encoded 3D gradient echo (GRE) imaging for joint R2* and fat/water quantification. A stack of 20 slices was acquired with a slice thickness of 10 mm and in-plane resolution of 2x2 mm2. T1 mapping was acquired using a GRE based modified Look‐Locker inversion recovery (MOLLI) 5(3)3 with TR/TE = 5.3/1.8 ms to minimize the influence of fat3. T2 mapping was performed using a T2-prepared GRE sequence. A rotary echo spin-lock pulse was implemented in a 2D SSFP sequence for the acquisition of T1ρ map. Sex-specific linear regression co-adjusted with age and BMI was used to evaluate the factors associated with each MRI parameter. Multivariable analysis adjusted for age, sex and BMI was performed to examine the relationship between MRI measures. Adjusted beta was reported and P < 0.05 was used for statistical significance.Results
One hundred adult participants free from liver disease and complications were included in the study (46 men, age range 19 to 85 years). Summary statistics stratified by sex is displayed in Table 1. There was no difference between sexes in all parameters but R2* was lower in women than in men (P < 0.05). Sex-related age and BMI dependencies (co-adjusted) are presented in Table 2. Women demonstrated positive correlation with age in R2* and negative correlation with age in T2. These relationships were not observed in men. T1 was shortened with aging in both adult women and men (Figure 1a, P < 0.05). PDFF was directly correlated with obesity (both sexes in Figure 1b, P < 0.05). No notable PDFF dependency of T1 and T2 were observed. R2* was positively and T1ρ was negatively associated with PDFF. R2* showed inverse correlation with T1, T2, and T1ρ. T1 and T2 were directly correlated. A correlation matrix with adjusted beta and P values is given in Table 3.Discussion
The present study analyzed the association between each relaxometry index and PDFF in adult livers without clinical hepatic disease. We found R2* was lower in women than in men, while other parameters were not different according to sex. Sex-specific analyses revealed heterogeneous age and BMI dependency of multiparametric MRI parameters. The disparities could be realized by physiological differences such as serum ferritin and hemoglobin levels. Fat has a much shorter T1 than water, so it is reasonable to expect that tissue T1 be reduced in the presence of fat. However, in using the MOLLI sequence, one of the most popular techniques for T1 mapping, T1 is artificially elevated when fat and water coexist3, 6. Our MOLLI T1 mapping method was optimized to reduce the impact of fat. Although no association was discovered between T1 and PDFF in our findings, other factors such as sample size and field strength should be considered when comparing to other studies. We have observed a negative association between PDFF and T1ρ, which highlights fat as a potential confounder when utilizing T1ρ to detect liver fibrosis. T2 appears insensitive to PDFF as suggested by the data presented here.Conclusions
Multiparametric MRI measures have sex-specific age and BMI dependency. Relaxometry mapping indices could be associated with PDFF. PDFF was significant associated with R2* and T1ρ, but not to T1 or T2. When using MRI multiparametric measures for liver disease evaluation, interactions between these parameters should be considered. The data obtained in this study should provide support for future patient studies at 3T.Acknowledgements
No acknowledgement found.References
1. Lee YS, Yoo YJ, Jung YK, Kim JH, Seo YS, Yim HJ, Kim IH, Lee SY, Kim BH, Kim JW, Lee CH, Yeon JE, Kwon SY, Um SH and Byun KS. Multiparametric MR Is a Valuable Modality for Evaluating Disease Severity of Nonalcoholic Fatty Liver Disease. Clin Transl Gastroenterol. 2020;11:e00157. 2. Marti-Aguado D, Rodriguez-Ortega A, Alberich-Bayarri A and Marti-Bonmati L. Magnetic Resonance imaging analysis of liver fibrosis and inflammation: overwhelming gray zones restrict clinical use. Abdom Radiol (NY). 2020;45:3557-3568. 3. Liu CY, Noda C, Ambale-Venkatesh B, Kassai Y, Bluemke D and Lima JAC. Evaluation of liver T1 using MOLLI gradient echo readout under the influence of fat. Magn Reson Imaging. 2022;85:57-63. 4. Mozes FE, Tunnicliffe EM, Moolla A, Marjot T, Levick CK, Pavlides M and Robson MD. Mapping tissue water T1 in the liver using the MOLLI T1 method in the presence of fat, iron and B0 inhomogeneity. NMR Biomed. 2019;32:e4030. 5. Tunnicliffe EM, Banerjee R, Pavlides M, Neubauer S and Robson MD. A model for hepatic fibrosis: the competing effects of cell loss and iron on shortened modified Look-Locker inversion recovery T1 (shMOLLI-T1 ) in the liver. J Magn Reson Imaging. 2017;45:450-462. 6. Mozes FE, Tunnicliffe EM, Pavlides M and Robson MD. Influence of fat on liver T1 measurements using modified Look-Locker inversion recovery (MOLLI) methods at 3T. J Magn Reson Imaging. 2016;44:105-11.Figures
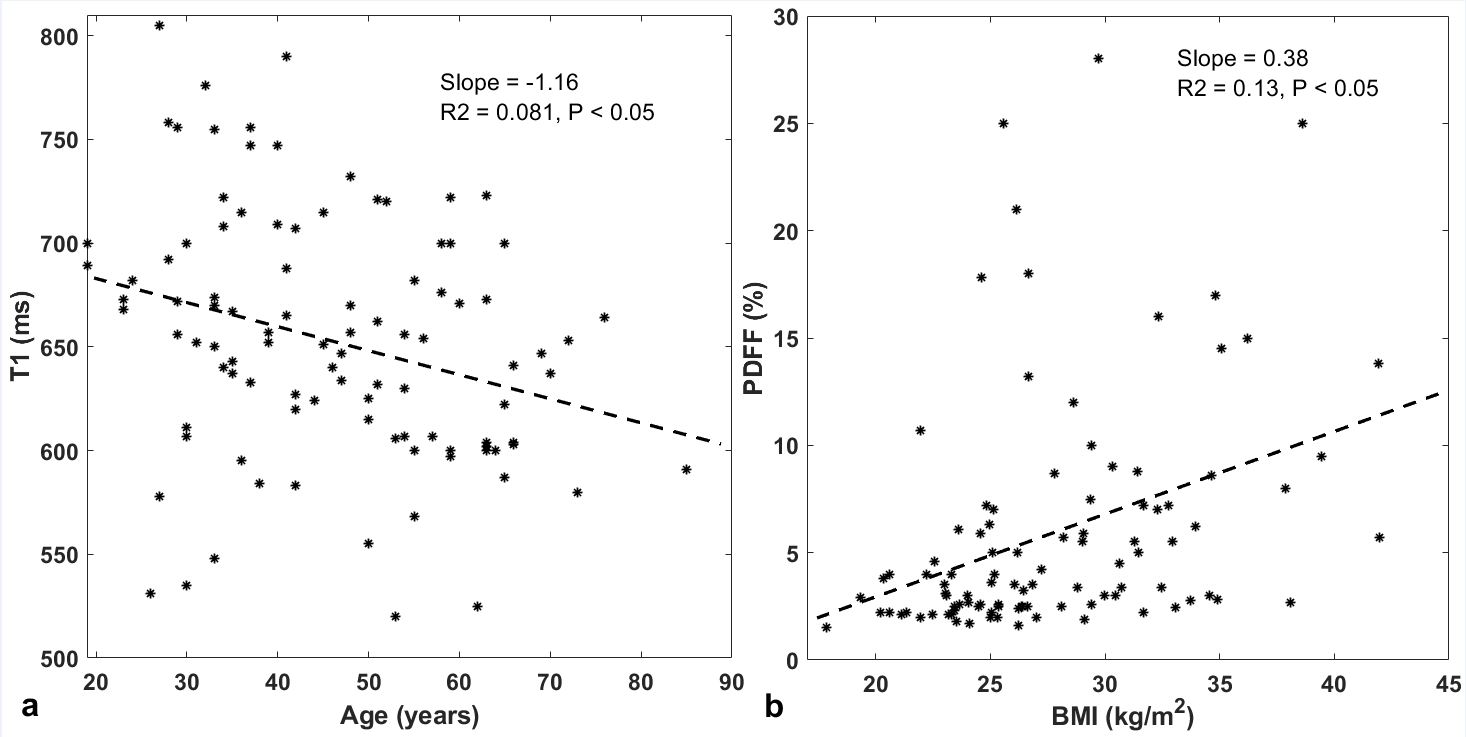
Figure 1. T1 is shortened
with aging in both adult women and men (a). Proton density fat fraction (PDFF) is
directly correlated with obesity (b).
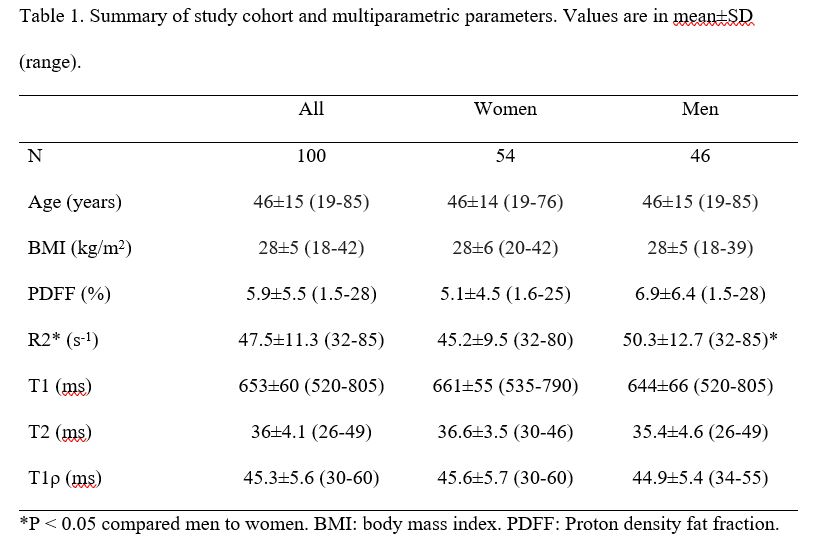
Table 1. Summary of study cohort
and multiparametric parameters. Values are in mean±SD (range).
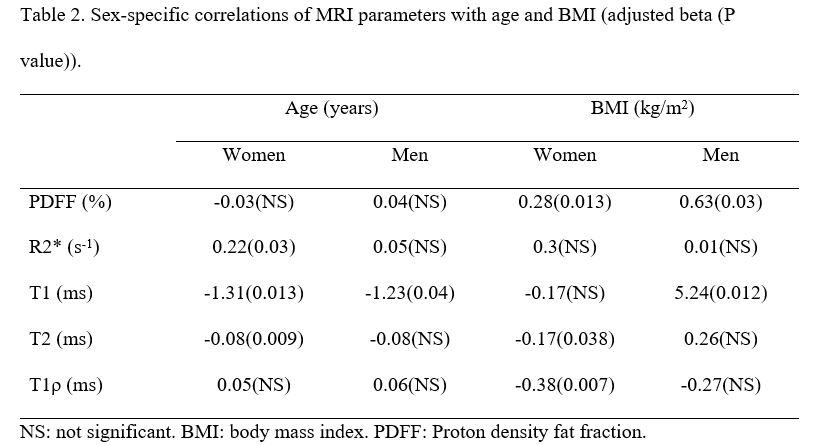
Table 2. Sex-specific correlations
of MRI parameters with age and BMI (adjusted beta (P value)).
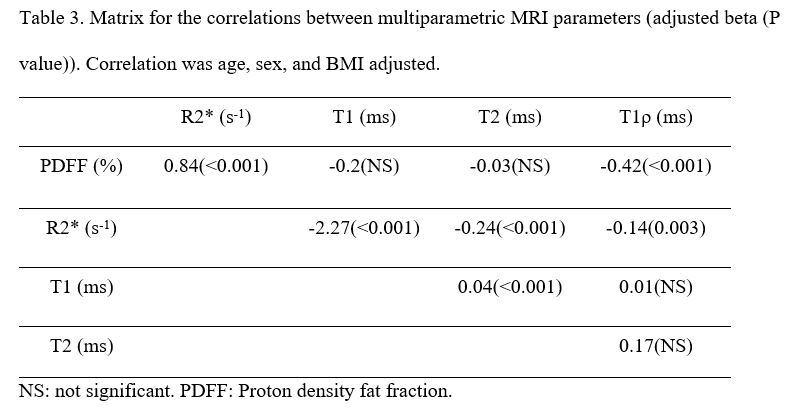
Table 3. Matrix for the
correlations between multiparametric MRI parameters (adjusted beta (P value)).
Correlation was age, sex, and BMI adjusted.
DOI: https://doi.org/10.58530/2023/1258