1257
The impact of amyloid-β and ferritin on ultra-high-field R2* and quantitative susceptibility mapping1School of Engineering, University of Warwick, Coventry, United Kingdom, 2School of Pharmacy and Bioengineering, Keele University, Stoke-on-Trent, United Kingdom, 3Feinberg School of Medicine, Northwestern University, Chicago, IL, United States, 4Department of Chemistry, University of Warwick, Coventry, United Kingdom, 5Warwick Centre for Doctoral Training in Analytical Science, University of Warwick, Coventry, United Kingdom
Synopsis
Keywords: Quantitative Imaging, Contrast Mechanisms, MR Microscopy, Quantitative Susceptibility Mapping, R2*, Iron, Ferritin, Amyloid plaques, Alzheimer's Disease
Amyloid plaques, an established hallmark of Alzheimer's disease, are often demonstrably associated with iron deposits post-mortem. Previous T2*-weighted and phase information from ultra-high-field MR microscopy and clinical MRI has shown the potential to detect amyloid deposits in vivo and ex vivo. We investigated the relative contributions to contrast from amyloid-β (Aβ) aggregates with and without ferritin-bound iron in vitro, for R2* and quantitative susceptibility maps (QSM) with 86 μm isotropic resolution at 9.4T. We also demonstrated the quantitative signal evolution with the formation of amyloid aggregates, and the correlation of the signals with the Aβ and ferritin content.
Introduction
Amyloid-β (Aβ) is the primary component of amyloid plaques, established hallmarks of Alzheimer's disease. Magnetic resonance (MR) microimaging of amyloid deposits in the brain using GRE pulse sequences has been reported, demonstrating hypointensity on T2*-weighted images1, 2, and increased R2* and susceptibility3. Supported by histological evidence, it is hypothesised that the signal changes may be caused by the co-localised iron, sequestered by the plaques4. However, the mechanisms by which amyloid plaques in tissue affect MR contrast remain unclear, and challenges remain in quantifying the impact of amyloid plaques on ultra-high-field MRI in iron-rich brain regions5. As the most abundant transition metal in the body, iron is primarily stored within the ferritin protein complex. Iron homeostasis is normally highly regulated, but disrupted regulation is associated with various forms of neurodegenerative disorder6. Our previous in-vitro findings confirmed that Aβ can impact the mineral phase of ferritin-bound iron7, and we provided ex-vivo evidence for amyloid plaques having altered iron chemistry in brain tissue from confirmed AD cases8.In this study, we investigated the R2* and susceptibility contrast mechanisms associated with in-vitro-formed amyloid deposits, comparing Aβ that had aggregated in buffer at pH7.4 with Aβ co-aggregated with ferritin, and ferritin in the buffer without addition of the Aβ.
Methods
To synthesise Aβ aggregates, we incubated Aβ(1-42) in a modified KH buffer at 37˚C7. Additionally, an Aβ(1-42) plus ferritin treatment, ferritin in the absence of Aβ, and a KH buffer control, were incubated alongside the Aβ(1-42) in buffer. Physiological ferritin concentration was used, and the molar ratio of ferritin to Aβ(1-42) was 1:27. To monitor the aggregate formation, each treatment was incubated and sampled at intervals from 0.5 to 100 hrs for light microscopy and MRI measurement. After the 100 hr-incubation, all treatments were diluted into concentration series for MRI to investigate contrast mechanisms. To form a short cylinder phantom for MR microimaging, the above treatments were set in 2% agarose gel and the resulting gelled samples were further embedded in 8% agarose.The MRI was acquired at 9.4T using a Bruker microimaging system (Micro 2.5, MICWB40). A multi-echo (N=6) 3D GRE sequence was employed, with parameters: TR = 40 ms, TE = 3.8, 7.8, 11.8, 15.8, 19.8, 23.8 ms, with uni-polar (positive) readout, FA = 20˚, FOV = 22*22*11 mm, matrix size = 256*256*128, phase oversampling = 1.25, spatial resolution = 86*86*86 μm3, average = 9, acquisition time = 4 hr 6 min. We evaluated PDF9, SHARP10 and LBV11 for background removal, and the phase image was generated by using the LBV algorithm. To calculate the QSM image from the phase, nonlinear MEDI-L112 was employed for the dipole inversion. To determine the regularisation parameter λ for the inversion, we compared the L-curve and U-curve criteria13, and the bisection search method for the elbow point of the cost function. The final selected λ was determined using the elbow-point search. R2* maps were generated using the ARLO algorithm14.
Results and discussion
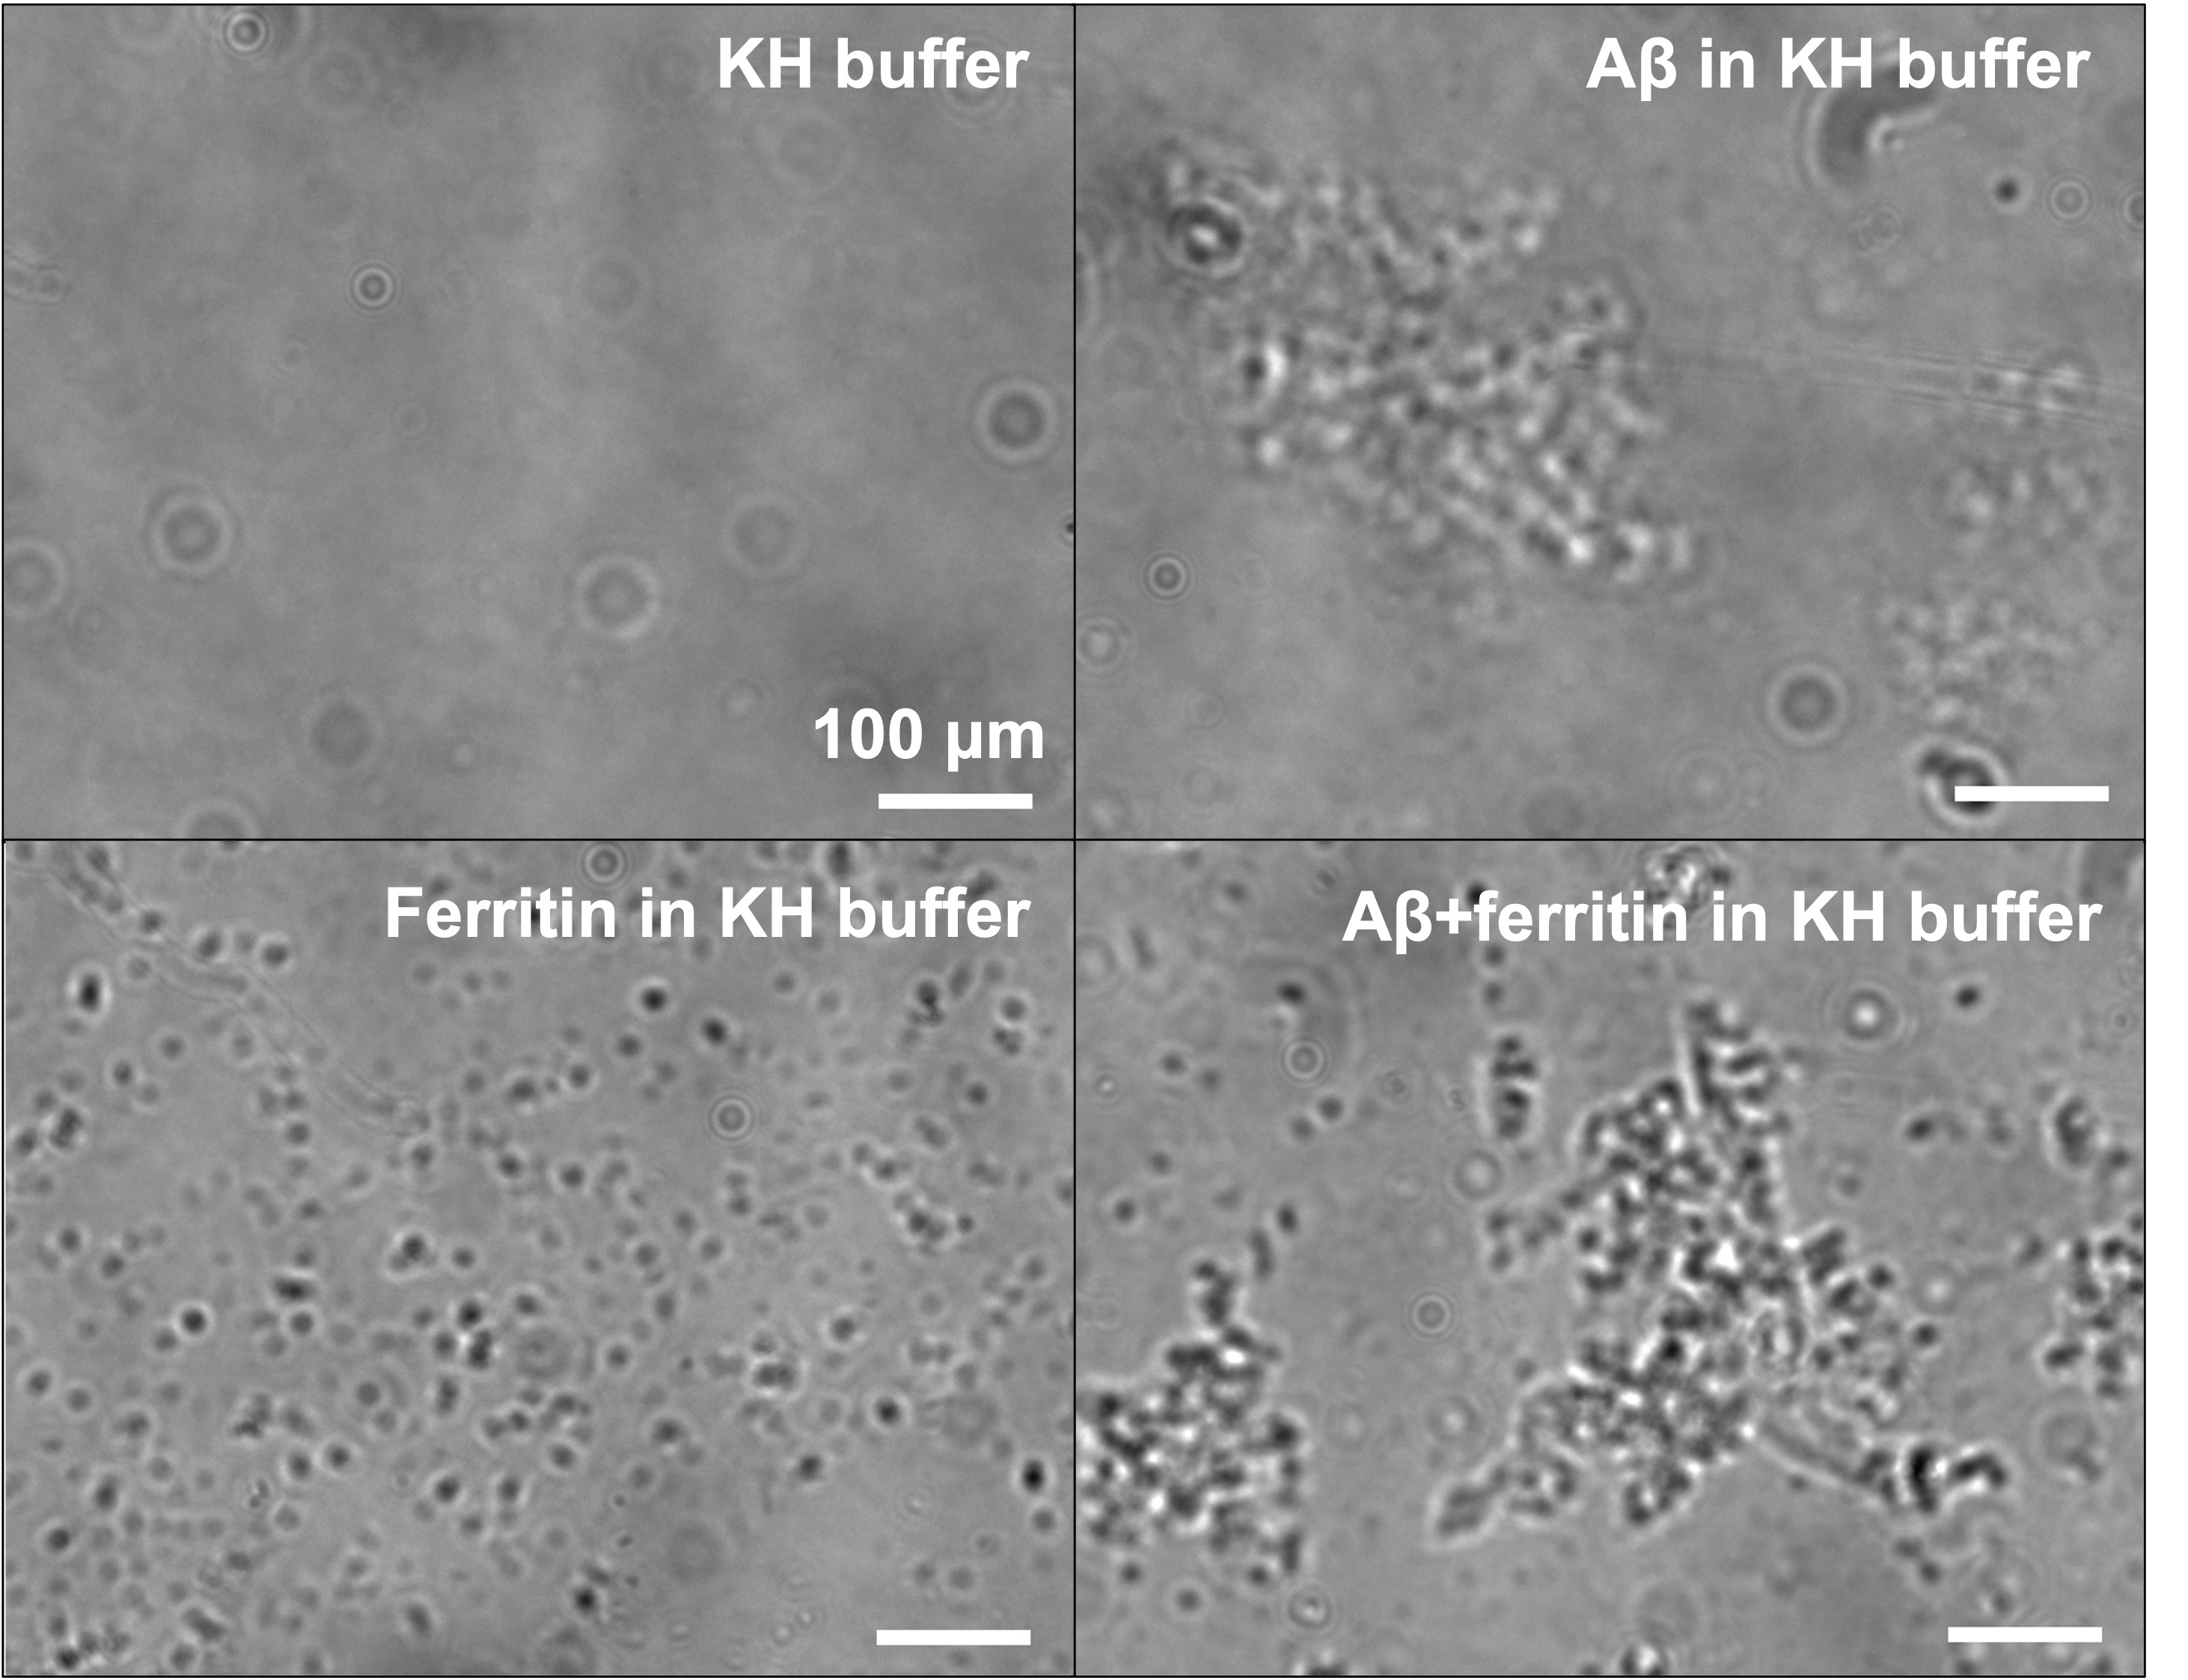
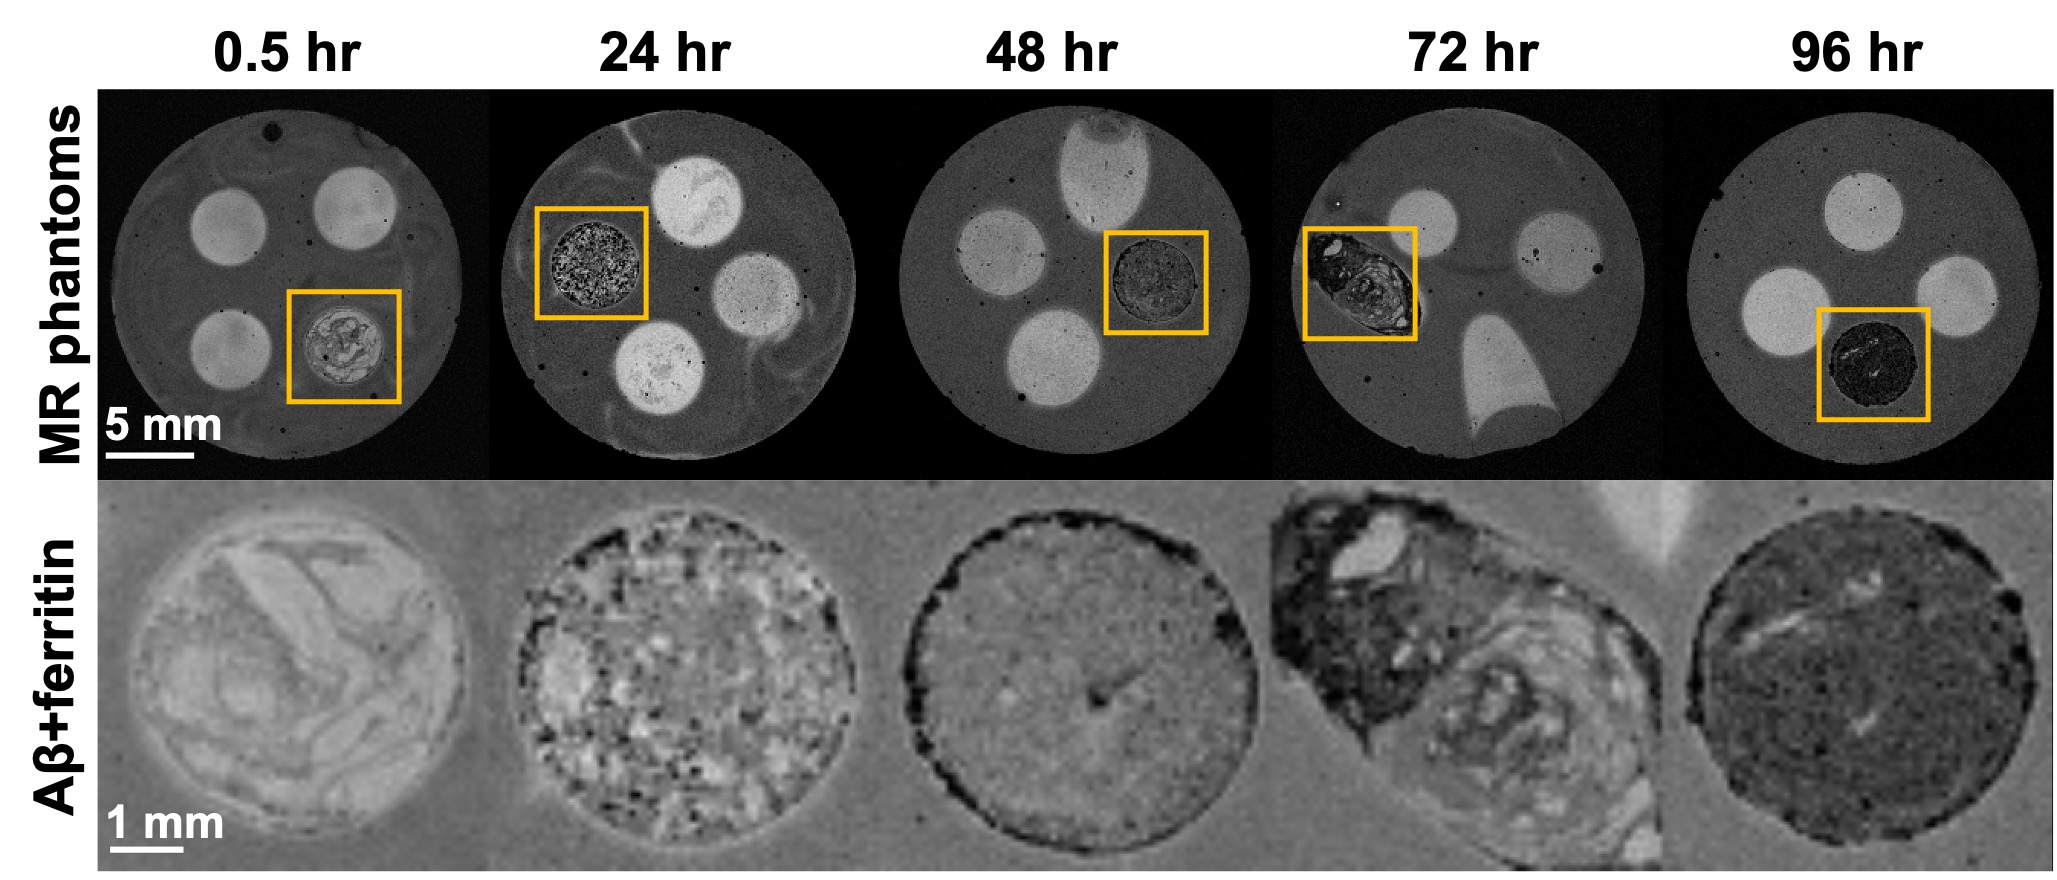
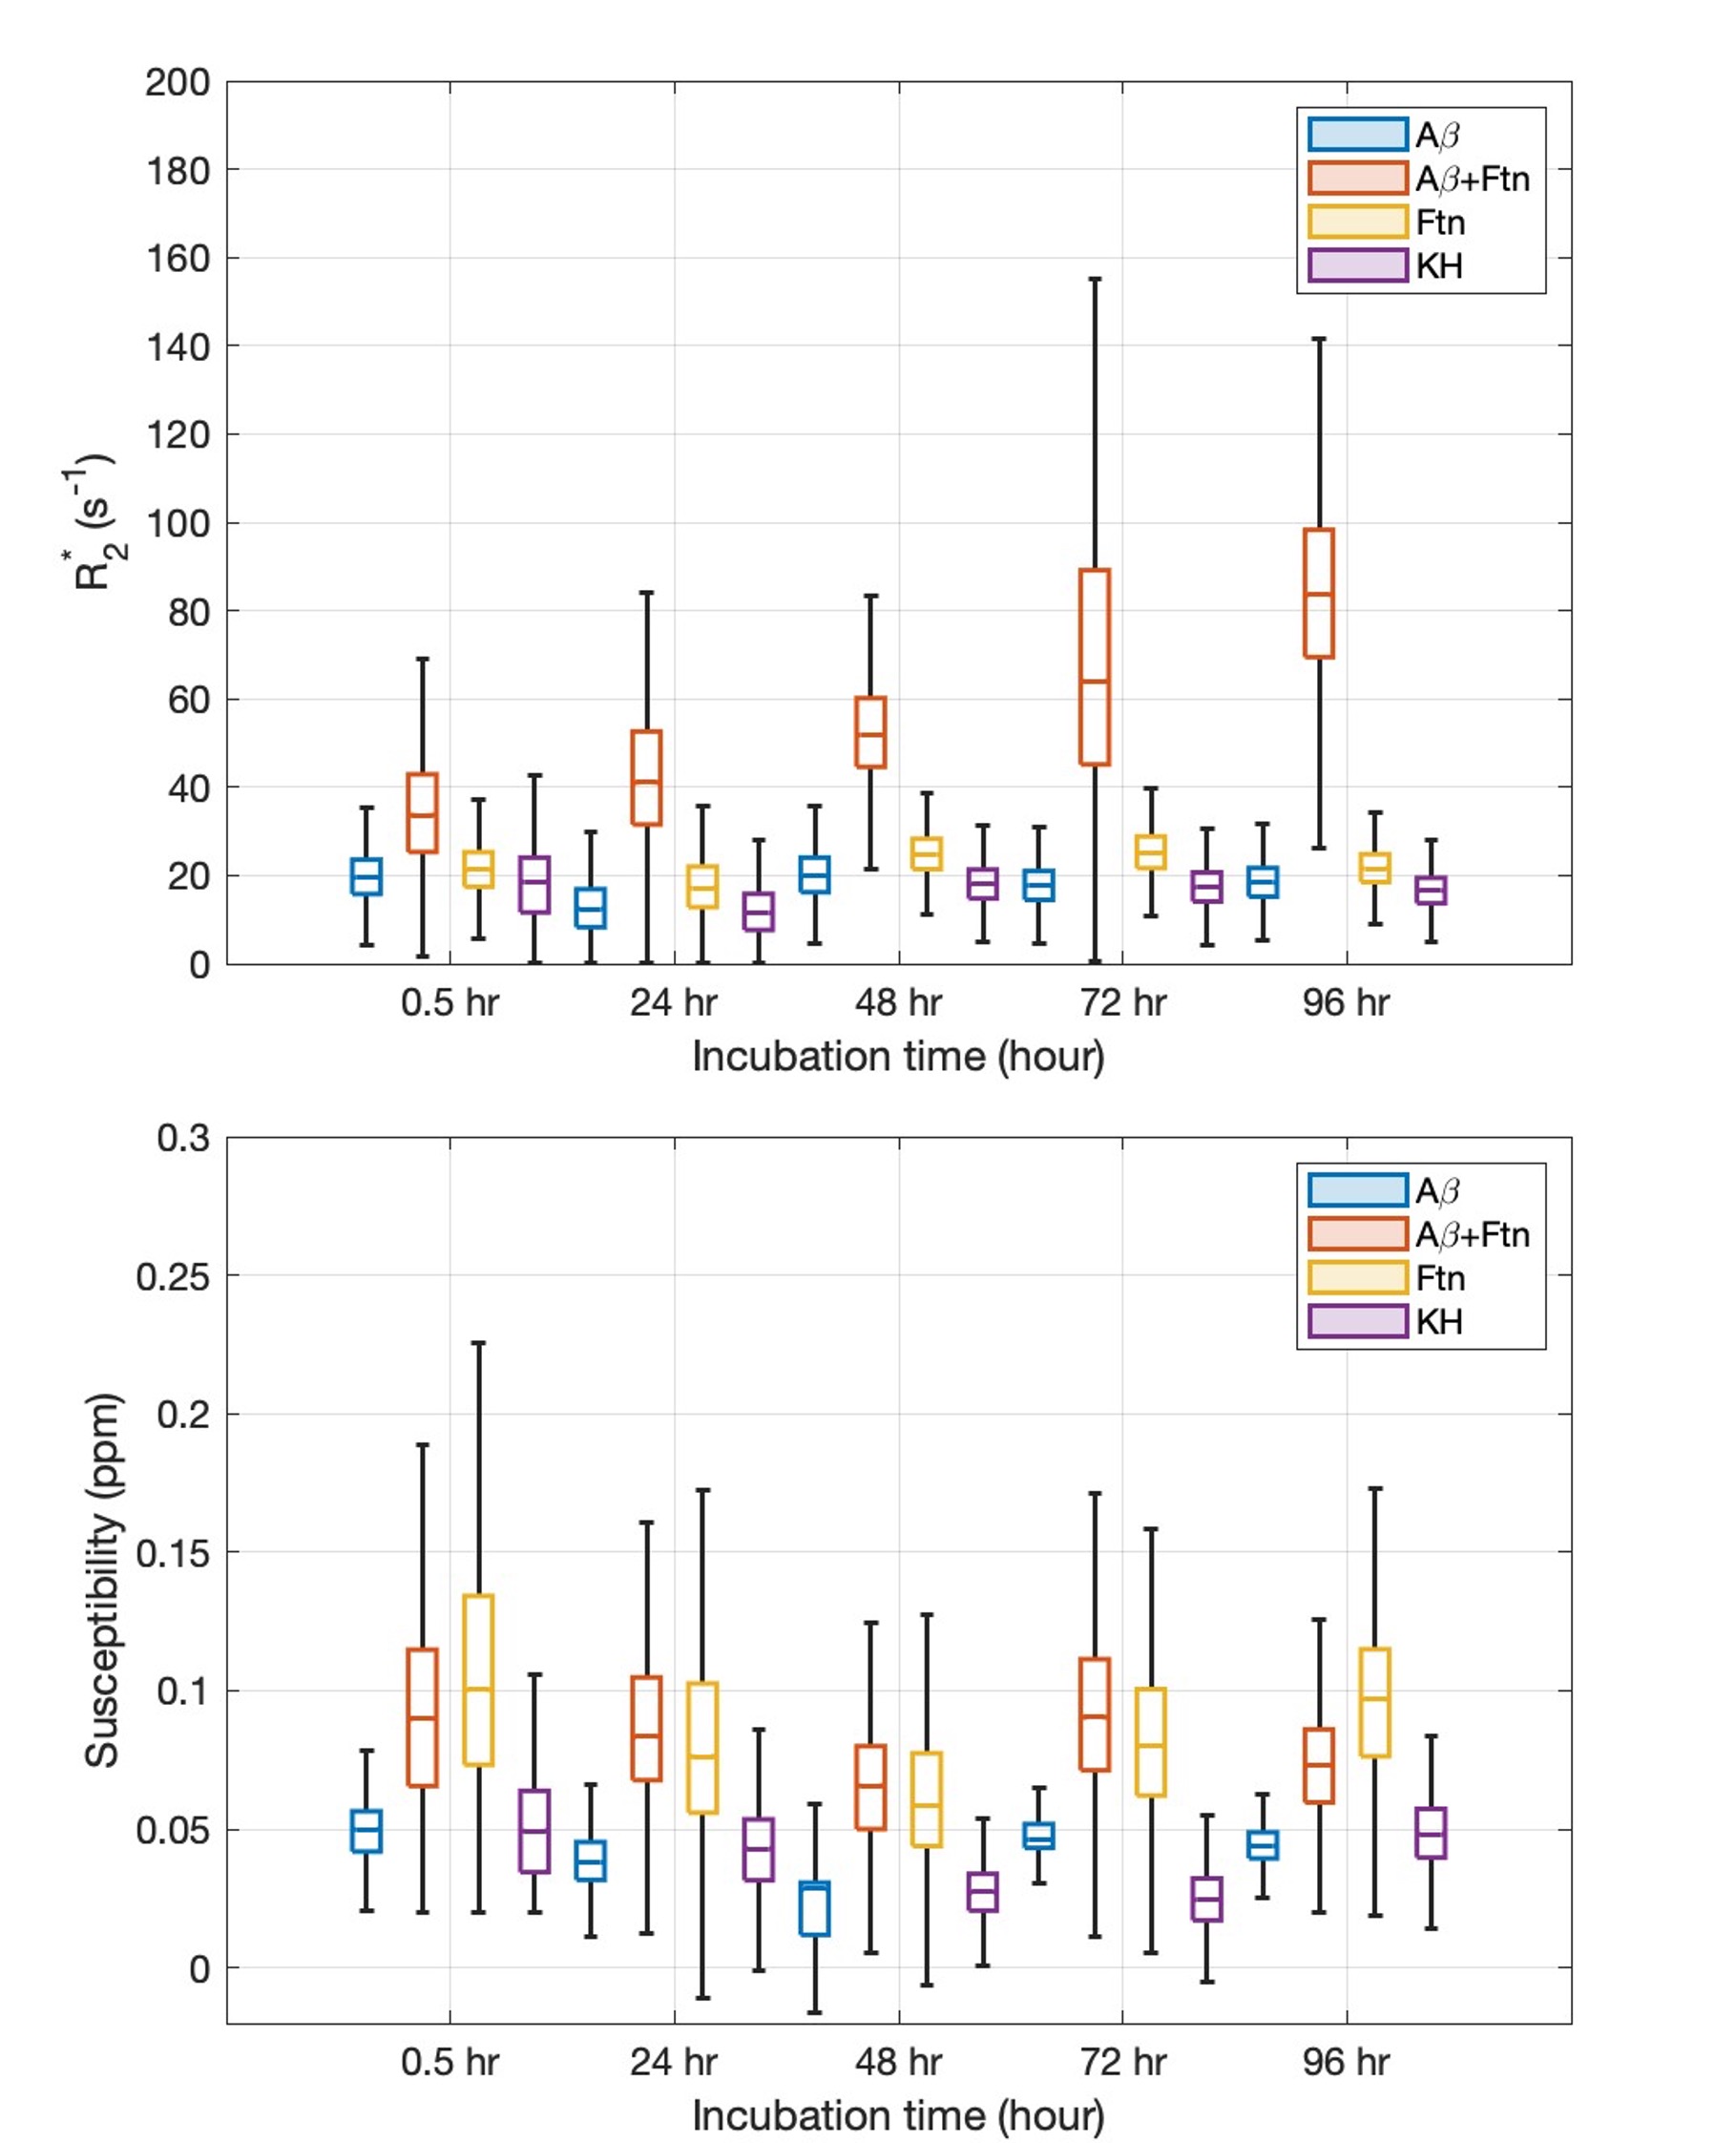
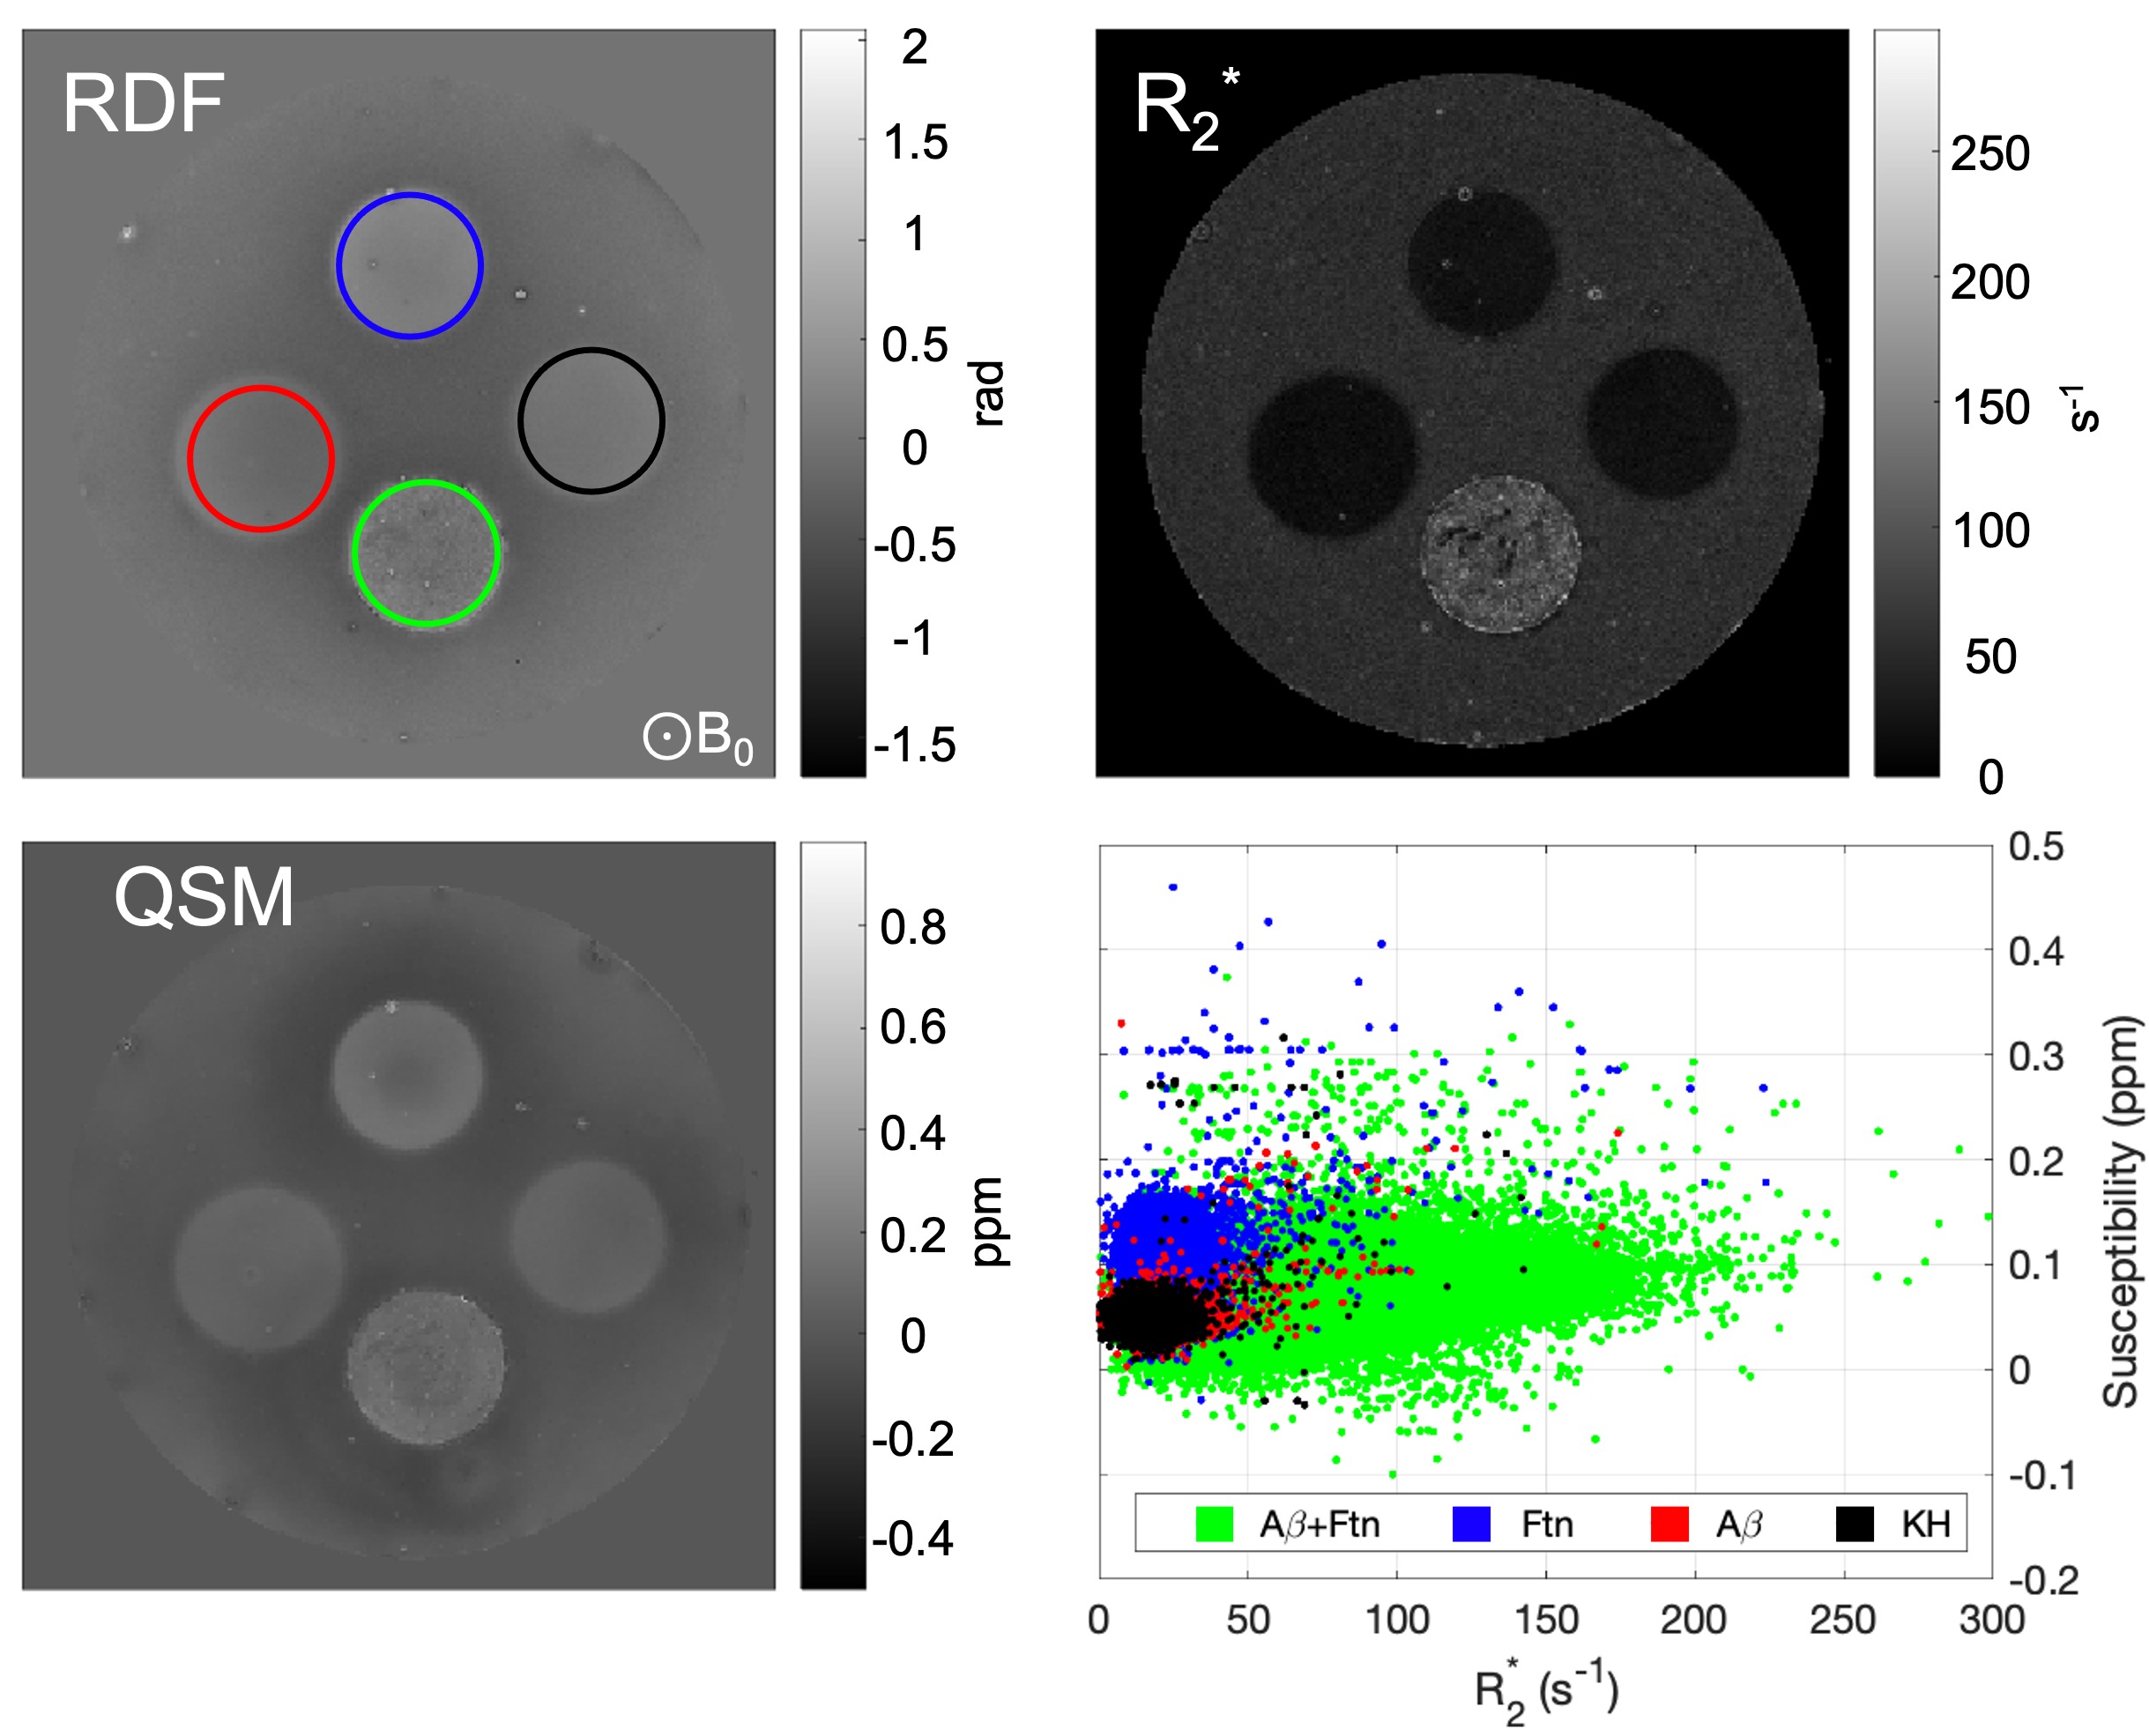
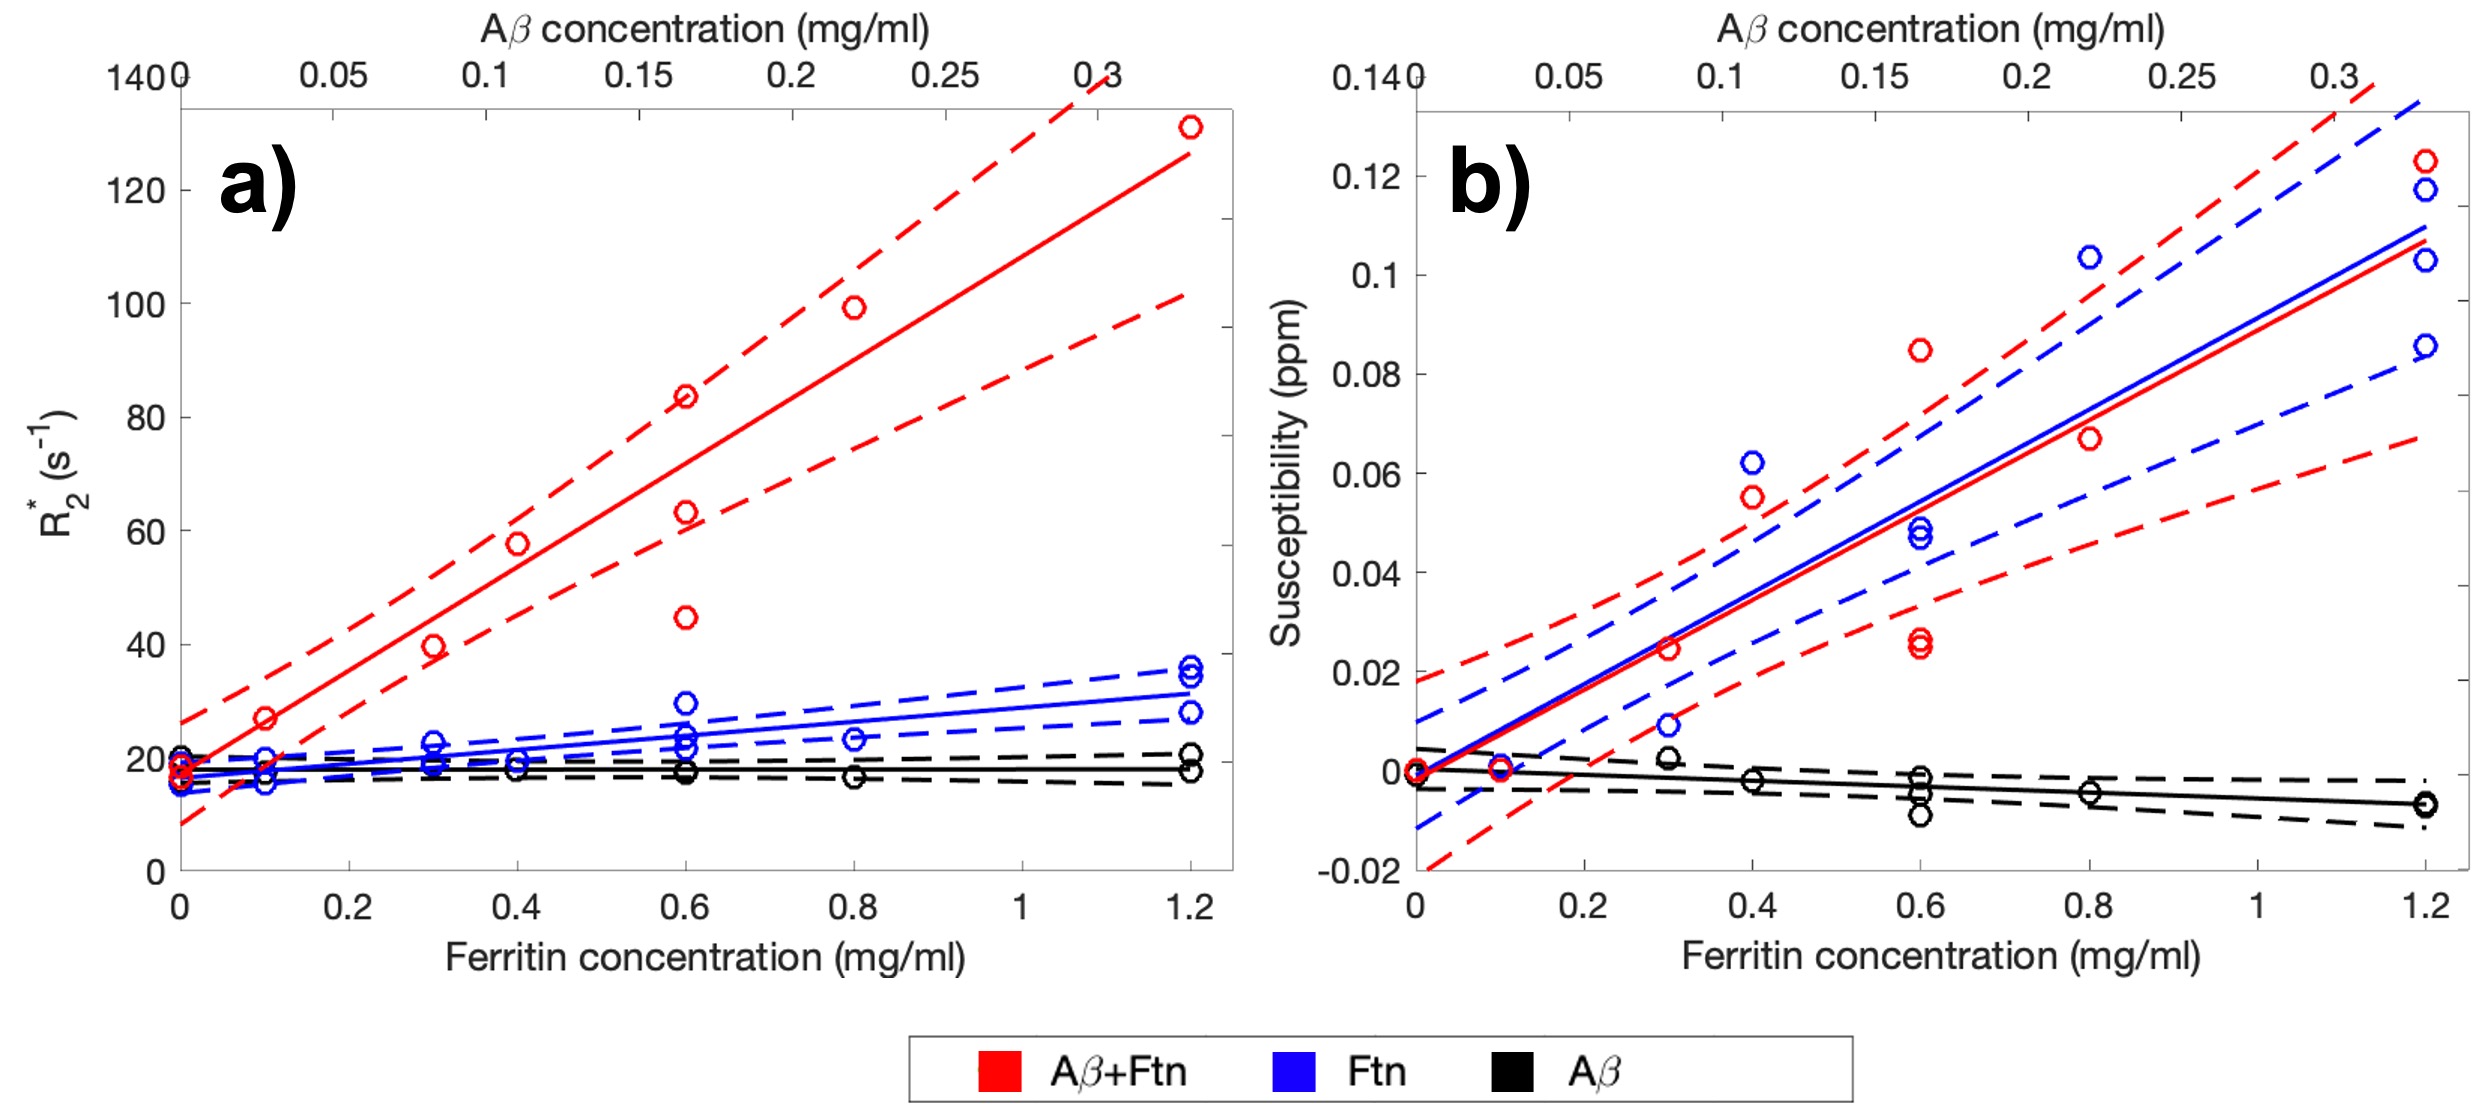
Light microscopy results showed the marked formation of Aβ aggregates from Aβ(1-42) monomers in the presence and absence of ferritin after 96 hr of incubation, whereas the ferritin-only control formed small but visible clusters after the incubation (Fig. 1). Magnitude images showed distinct signal inhomogeneity within co-aggregated Aβ+ferritin, for which the overall signal decreased with incubation time (Fig. 2). During the incubation, only co-aggregated Aβ+ferritin showed increased median R2* with time, but the median susceptibility of each sample remained relatively unchanged (Fig. 3). At the final incubation time, for Aβ+ferritin compared with Aβ-only and ferritin-only, speckled patterns of co-aggregated Aβ+ferritin were observed in phase signal changes, R2* and QSM (Fig. 4). Within the different samples, the R2* and susceptibility voxel values also demonstrated distinct distributions differentiating Aβ-only, and ferritin-only, from co-aggregated Aβ+ferritin (Fig. 4, lower right). We observed a negligible dependency of the median R2* of the total sample on Aβ-only, and we observed a statistically significant positive correlation (F > 1, p < 0.05) of the R2* median value with ferritin concentration, as shown in Fig. 5. The median susceptibility showed a slight negative linear correlation with the concentration of Aβ, and a positive correlation with ferritin concentration. The co-aggregated Aβ+ferritin demonstrated a considerably stronger R2* effect but a similar overall paramagnetic susceptibility effect compared with the ferritin-only control (Fig. 5).Conclusion
We developed an MR microscopy-based quantitative method for simultaneous R2* and QSM, applied at 9.4T to image in-vitro-formed amyloid deposits in association with ferritin, and to investigate the sources of contrast. We found R2* and susceptibility effects were primarily dependent on ferritin content; these could be described by linear relationships. The R2* median proved sensitive to the distribution of the ferritin, with the clustering of ferritin associating with Aβ affecting the R2* to a greater effect than the ferritin per se. The median susceptibility extracted from the entire sample region reflected the total ferritin content, and we predict that the macroscopic ferritin distribution will correlate with the parametric map of susceptibility with ultra-high resolution at 9.4T. Our findings may aid sequence selection and interpretation for clinical MRI of amyloid pathology.Acknowledgements
This work received funding from the Engineering and Physical Sciences Research Council (EP/N033191/1), and was supported by an International Chancellors Scholarship (JL) from the University of Warwick, UK. The MRI probe used in this research was obtained through the Birmingham Science City Translational Medicine: Experimental Medicine Network of Excellence project, with support from Advantage West Midlands.References
1. H. Benveniste, G. Einstein, K. R. Kim, C. Hulette, and G. A. Johnson, "Detection of neuritic plaques in Alzheimer's disease by magnetic resonance microscopy,"Proc Natl Acad Sci U S A, vol. 96, no. 24, pp. 14079-84, Nov 23 1999.
2. R. J. Nabuurs et al., "MR microscopy of human amyloid-beta deposits: characterization of parenchymal amyloid, diffuse plaques, and vascular amyloid," J Alzheimers Dis, vol. 34, no. 4, pp. 1037-49, 2013.
3. E. Tuzzi et al., "Ultra-High Field MRI in Alzheimer's Disease: Effective Transverse Relaxation Rate and Quantitative Susceptibility Mapping of Human Brain In Vivo and Ex Vivo compared to Histology," J Alzheimers Dis, vol. 73, no. 4, pp. 1481-1499, 2020.
4. M. A. Smith, P. L. Harris, L. M. Sayre, and G. Perry, "Iron accumulation in Alzheimer disease is a source of redox-generated free radicals," Proc Natl Acad Sci U S A, vol. 94, no. 18, pp. 9866-8, Sep 2 1997.
5. K. Joppe, A. E. Roser, F. Maass, and P. Lingor, "The Contribution of Iron to Protein Aggregation Disorders in the Central Nervous System," Front Neurosci, vol. 13, p. 15, 2019.
6. M. E. Finnegan et al., "Synchrotron XRF imaging of Alzheimer's disease basal ganglia reveals linear dependence of high-field magnetic resonance microscopy on tissue iron concentration," J Neurosci Methods, vol. 319, pp. 28-39, May 1 2019.
7. J. Everett et al., "Iron stored in ferritin is chemically reduced in the presence of aggregating Abeta(1-42)," Sci Rep, vol. 10, no. 1, p. 10332, Jun 25 2020.
8. J. Everett et al., "Biogenic metallic elements in the human brain?," Sci Adv, vol. 7, no. 24, Jun 2021.
9. T. Liu et al., "A novel background field removal method for MRI using projection onto dipole fields (PDF)," NMR Biomed, vol. 24, no. 9, pp. 1129-36, Nov 2011.
10. F. Schweser, A. Deistung, B. W. Lehr, and J. R. Reichenbach, "Quantitative imaging of intrinsic magnetic tissue properties using MRI signal phase: an approach to in vivo brain iron metabolism?," Neuroimage, vol. 54, no. 4, pp. 2789-807, Feb 14 2011.
11. D. Zhou, T. Liu, P. Spincemaille, and Y. Wang, "Background field removal by solving the Laplacian boundary value problem," NMR Biomed, vol. 27, no. 3, pp. 312-9, Mar 2014.
12. J. Liu et al., "Morphology enabled dipole inversion for quantitative susceptibility mapping using structural consistency between the magnitude image and the susceptibility map," Neuroimage, vol. 59, no. 3, pp. 2560-8, Feb 1 2012.
13. C. Milovic, B. Bilgic, B. Zhao, J. Acosta-Cabronero, and C. Tejos, "Fast nonlinear susceptibility inversion with variational regularization," Magn Reson Med, vol. 80, no. 2, pp. 814-821, Aug 2018.
14. M. Pei et al., "Algorithm for fast monoexponential fitting based on Auto-Regression on Linear Operations (ARLO) of data," Magn Reson Med, vol. 73, no. 2, pp. 843-50, Feb 2015.
Figures