1256
Personalized quantitative MRI multiparameter abnormality maps provide correlates of disability in multiple sclerosis patients1Translational Imaging in Neurology (ThINK) Basel, Department of Biomedical Engineering, Faculty of Medicine, University Hospital Basel and University of Basel, Basel, Switzerland, 2Department of Neurology, University Hospital, Basel, Switzerland, 3Research Center for Clinical Neuroimmunology and Neuroscience Basel (RC2NB), University Hospital Basel and University of Basel, Basel, Switzerland, 4Division of Radiological Physics, Department of Radiology, University Hospital Basel, Basel, Switzerland, 5Advanced Clinical Imaging Technology, Siemens Healthineers International AG, Lausanne, Switzerland
Synopsis
Keywords: Quantitative Imaging, Multiple Sclerosis
We performed an extensive assessment of the clinical relevance of a method that we had previously developed, which provides personalized quantitative MRI abnormality maps of individual multiple sclerosis (MS) patients. Specifically, we assessed the relationships between quantitative T1 (qT1), myelin water fraction (MWF), neurite density index (NDI), magnetization transfer saturation (MTsat) abnormality maps and clinical disability in a cohort of 102 MS patients and 98 healthy subjects. We found that qT1 and NDI alterations in white matter lesions were strongly related to patients' clinical disability, supporting the use of those personalized maps for patient stratification and follow-up in clinical practice.Introduction
Quantitative MRI (qMRI) techniques can be applied to measure more sensitive and specific information about microstructural properties and pathological changes in multiple sclerosis (MS)1,2. Among these qMRI techniques, quantitative T1 (qT1) is sensitive to pathological changes in MS since alterations in myelin, axons, free water lead to prolonged T1 relaxation times1. The fraction of axons and dendrites within the neural tissue can be estimated by the neurite density index (NDI), which is sensitive to axonal loss3. Myelin water fraction (MWF) can detect the fraction of tissue water bound to the myelin sheath, by identifying various water components in multi-compartment T2 relaxometry4. Also, magnetization transfer saturation (MTsat) has the potential for detecting myelin alteration although it is also sensitive to changes related to axons and cells5. The adoption of qMRI measures in clinical practice remains challenging, due to the limited availability of hardware and software capabilities on a broad scale as well as to the paucity of cut-off values for health and pathology changes in personalized approaches6. Our study aimed to assess the clinical value of a method7 that has been developed to quantify tissue abnormalities in single patients based on qMRI measures.Methods
A total of 102 MS patients (63 relapsing-remitting MS, RRMS, 21 secondary progressive MS, SPMS and 18 primary progressive MS, PPMS) and 98 Healthy Controls (HC) were included and underwent 3T MRI (MAGNETOM Prisma, Siemens Healthcare, Erlangen, Germany) using a 64-channel head coil. The MRI protocol included: (i) High-Resolution 3D FLAIR (TR/TE/TI/resolution=5000/386/1800ms, 1mm3), MP2RAGE for qT1 (TR/TE/TI1/TI2/resolution = 5000/2.98/700/2500 ms, 1 mm3); (ii) FAST-T28 for MWF: TR/TE/resolution = 7.5/0.5 ms, 1.25x1.25x5 mm3; (iii) multi-shell diffusion for NDI4: TR/TE/δ/Δ impulses/resolution = 4.5 s/75 ms/19 ms/36 ms, 1.8x1.8x1.8 mm3 with b-values 700/1000/2000/3000 s/mm2, 6/20/45/66 diffusion directions and 12 measurements at b-value 0 s/mm2; (iv) MTsat: Three 3D RF spoiled gradient echo acquisitions (for a single gradient echo: TE = 4.92 ms, 1 mm3) with predominantly Magnetization Transfer-weighted (MTw: TR/α = 25 ms/5°), proton density-weighted (PDw: TR/α = 25 ms/5°) and T1-weighted (T1w: TR/α = 11 ms/15°) contrast9.To calculate personalized abnormality maps, the method proposed by Bonnier G. et al.7 was applied and extended (Figure 1). The MP2RAGE images were skull-stripped and segmented using the "AI-Rad Companion Brain MR" of Siemens Healthineers (AI-Rad), then aggregated into five regions of interest (ROIs) (frontal, temporal, parietal, occipital lobe, deep grey matter). The white matter (WM), grey matter (GM), and cerebrospinal fluid (CSF) probability maps were estimated in each voxel to account for partial volume effects10. The lesion segmentations were performed using an in-house deep-learning 3D U-net method11 and further manually corrected. These images were further transformed to space of MWF, NDI and MTsat images separately for Z-score computation using FSL12. QT1, MWF, NDI, and MTsat voxel values in MS patients were compared to the average values obtained in HC’s same tissue among ROIs. The age dependence of qMRI parameters in HC was calculated using linear polynomial regression for estimating age-adjusted Z-scores, further for quantifying the abnormality maps. Average Z-score in white matter lesions (WMLs), normal-appearing white matter (NAWM), cortical grey matter lesions (GMcLs), normal-appearing cortical grey matter (NAcGM) were further computed for each qMRI parameter. A multiple linear regression (MLR) model with the backward selection including age, disease duration, phenotype, lesion umber and volume, average Z-scores (NAWM/NAcGM/WMLs/GMcLs) as covariates was used to assess the relationship between abnormality maps and EDSS.
Results
The average qT1 Z-score in WMLs was higher than in NAWM (p < 0.001), and MWF (p < 0.001) whereas the average MTsat (p < 0.001), and NDI (p < 0.001) Z-score was lower in WMLs than NAWM (Figure 2&3). The average MWF (p < 0.001), NDI (p < 0.001), and MTsat (p < 0.001) Z-score in GMcLs was lower than in NACGM and the opposite was true for qT1 (p < 0.001). The MLR model showed a significant association between Expanded Disability Status Scale (EDSS) with (a) average qT1 Z-scores in WMLs (R2 = 0.581, β = 0.201, 97.5% CI = 0.048 to 0.354, p = 0.011); (b) with average NDI Z-scores in WMLs (R2 = 0.576, β = -0.281, 97.5% CI = -0.518 to -0.044, p = 0.021) (Figure 4). In RRMS, we measured (a) 0.272 increased steps in EDSS per unit of qT1 Z-score in WMLs (R2 = 0.097, β = 0.272, 97.5% CI = 0.075 to 0.469, p = 0.008), (b) 0.403 decreased steps in EDSS per unit of NDI Z-score in WMLs (R2 = 0.091, β = -0.403, 97.5% CI = -0.704 to -0.103, p = 0.009) (Figure 5).Discussion
Our finding showed significant differences in Z-scores between lesion tissue and normal-appearing tissue in MS, which points to a loss of brain tissue integrity (i.e., axonal, myelin, cell damage) and/or extracellular water accumulation13,14, hereby confirming preliminary evidence7,15. Furthermore, our results showed that qT1 and NDI abnormalities in WML provide strong correlates of MS disability, suggesting the potential utility of those measures for monitoring MS patients in clinical practice.Conclusions
We showed that personalized qT1 and NDI abnormality maps in MS patients provide measures related to clinical disability, supporting the use of those maps in clinical practice.Acknowledgements
We thank all the patients for their participation.References
1. Granziera C, Wuerfel J, Barkhof F, et al.: Quantitative magnetic resonance imaging towards clinical application in multiple sclerosis Brain 144: 1296–1311, 2021
2. Tofts P: Quantitative MRI of the brain: measuring changes caused by disease John Wiley Sons Ltd: 581–610, 2003
3. Jespersen SN, Kroenke CD, Østergaard L, Ackerman JJH, Yablonskiy DA: Modeling dendrite density from magnetic resonance diffusion measurements NeuroImage 34: 1473–1486, 2007
4. Rahmanzadeh R, Lu P-J, Barakovic M, et al.: Myelin and axon pathology in multiple sclerosis assessed by myelin water and multi-shell diffusion imaging Brain 144: 1684–1696, 2021
5. Helms G, Dathe H, Kallenberg K, Dechent P: High-resolution maps of magnetization transfer with inherent correction for RF inhomogeneity and T 1 relaxation obtained from 3D FLASH MRI: Saturation and Relaxation in MT FLASH Magn Reson Med 60: 1396–1407, 2008
6. Saito N, Sakai O, Ozonoff A, Jara H: Relaxo-volumetric multispectral quantitative magnetic resonance imaging of the brain over the human lifespan: global and regional aging patterns Magn Reson Imaging 27: 895–906, 2009
7. Bonnier G, Fischi-Gomez E, Roche A, et al.: Personalized pathology maps to quantify diffuse and focal brain damage NeuroImage Clin 21: 101607, 2019
8. Nguyen TD, Deh K, Monohan E, et al.: Feasibility and reproducibility of whole brain myelin water mapping in 4 minutes using fast acquisition with spiral trajectory and adiabatic T2prep (FAST-T2) at 3T: Whole Brain Myelin Water Mapping with FAST-T2 Magn Reson Med 76: 456–465, 2016
9. Helms G, Dathe H, Dechent P: Quantitative FLASH MRI at 3T using a rational approximation of the Ernst equation: Rational Approximation of the FLASH Signal Magn Reson Med 59: 667–672, 2008
10. Roche A, Forbes F: Partial volume estimation in brain MRI revisited, in: International conference on medical image computing and computer-assisted intervention. Springer, 2014, pp. 771–778.
11. La Rosa F, Abdulkadir A, Fartaria MJ, et al.: Multiple sclerosis cortical and WM lesion segmentation at 3T MRI: a deep learning method based on FLAIR and MP2RAGE NeuroImage Clin 27: 102335, 2020
12. Jenkinson M, Beckmann CF, Behrens TEJ, Woolrich MW, Smith SM: FSL NeuroImage 62: 782–790, 2012
13. Brück W, Lucchinetti C, Lassmann H: The pathology of primary progressive multiple sclerosis Mult Scler J 8: 93–97, 2002
14. Lassmann H, Brück W, Lucchinetti C: Heterogeneity of multiple sclerosis pathogenesis: implications for diagnosis and therapy Trends Mol Med 7: 115–121, 2001
15. Bonnier G, Roche A, Romascano D, et al.: Advanced MRI unravels the nature of tissue alterations in early multiple sclerosis Ann Clin Transl Neurol 1: 423–432, 2014
Figures
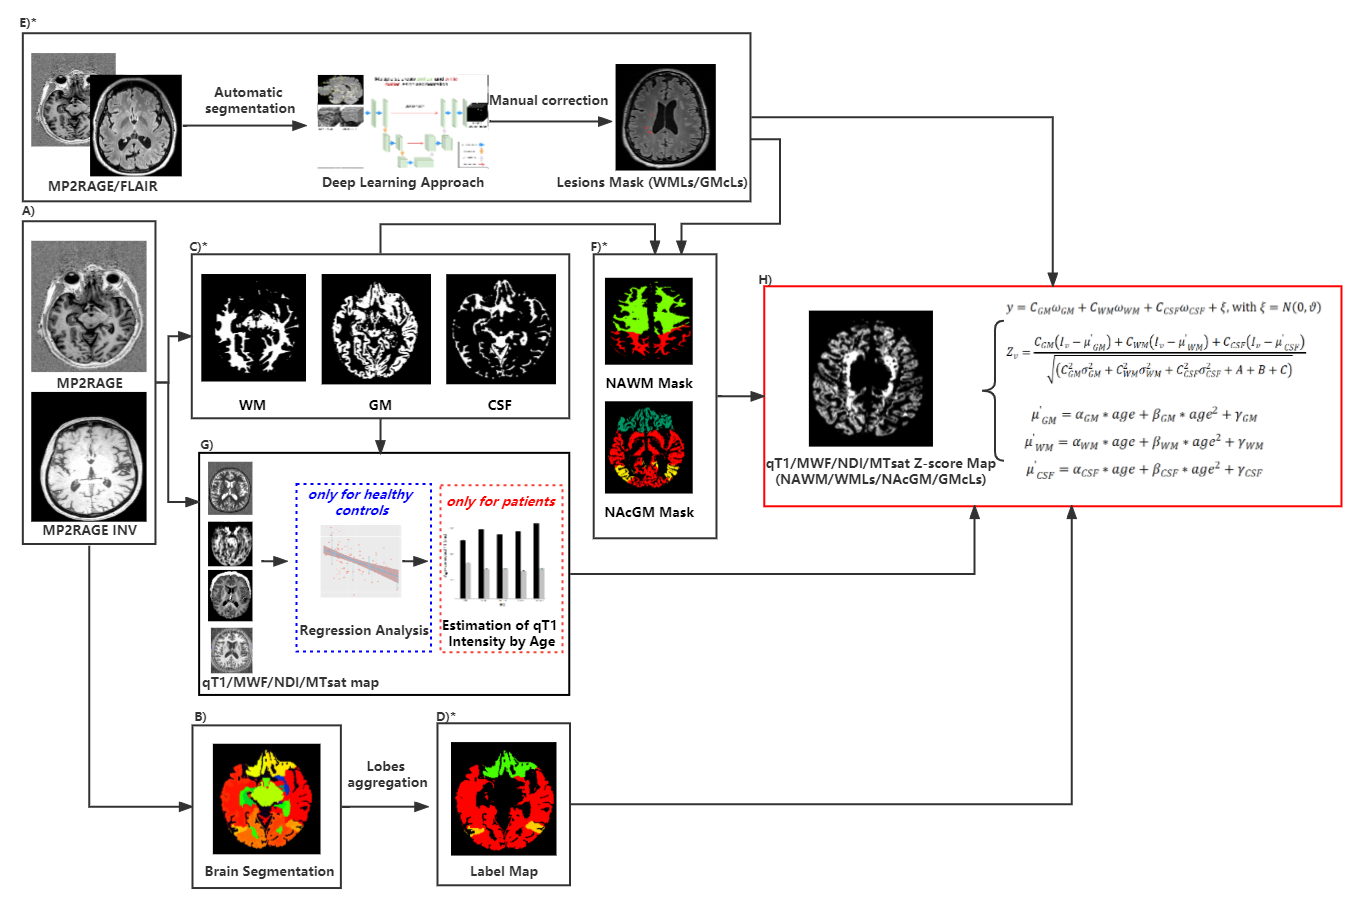
Figure 1 Flowchart of the abnormality maps computation
A) Preprocessing; B) Brain segmentation; C) Tissue concentration estimation for partial volume effects; D) lobes aggregation; E) Lesion segmentation and Identification; F) Tissue mask computation; G) Age-effect estimation in healthy controls; H) Abnormalities maps computation; *: The images were transformed to the space of MWF/NDI/MTsat images separately for abnormality maps computation.
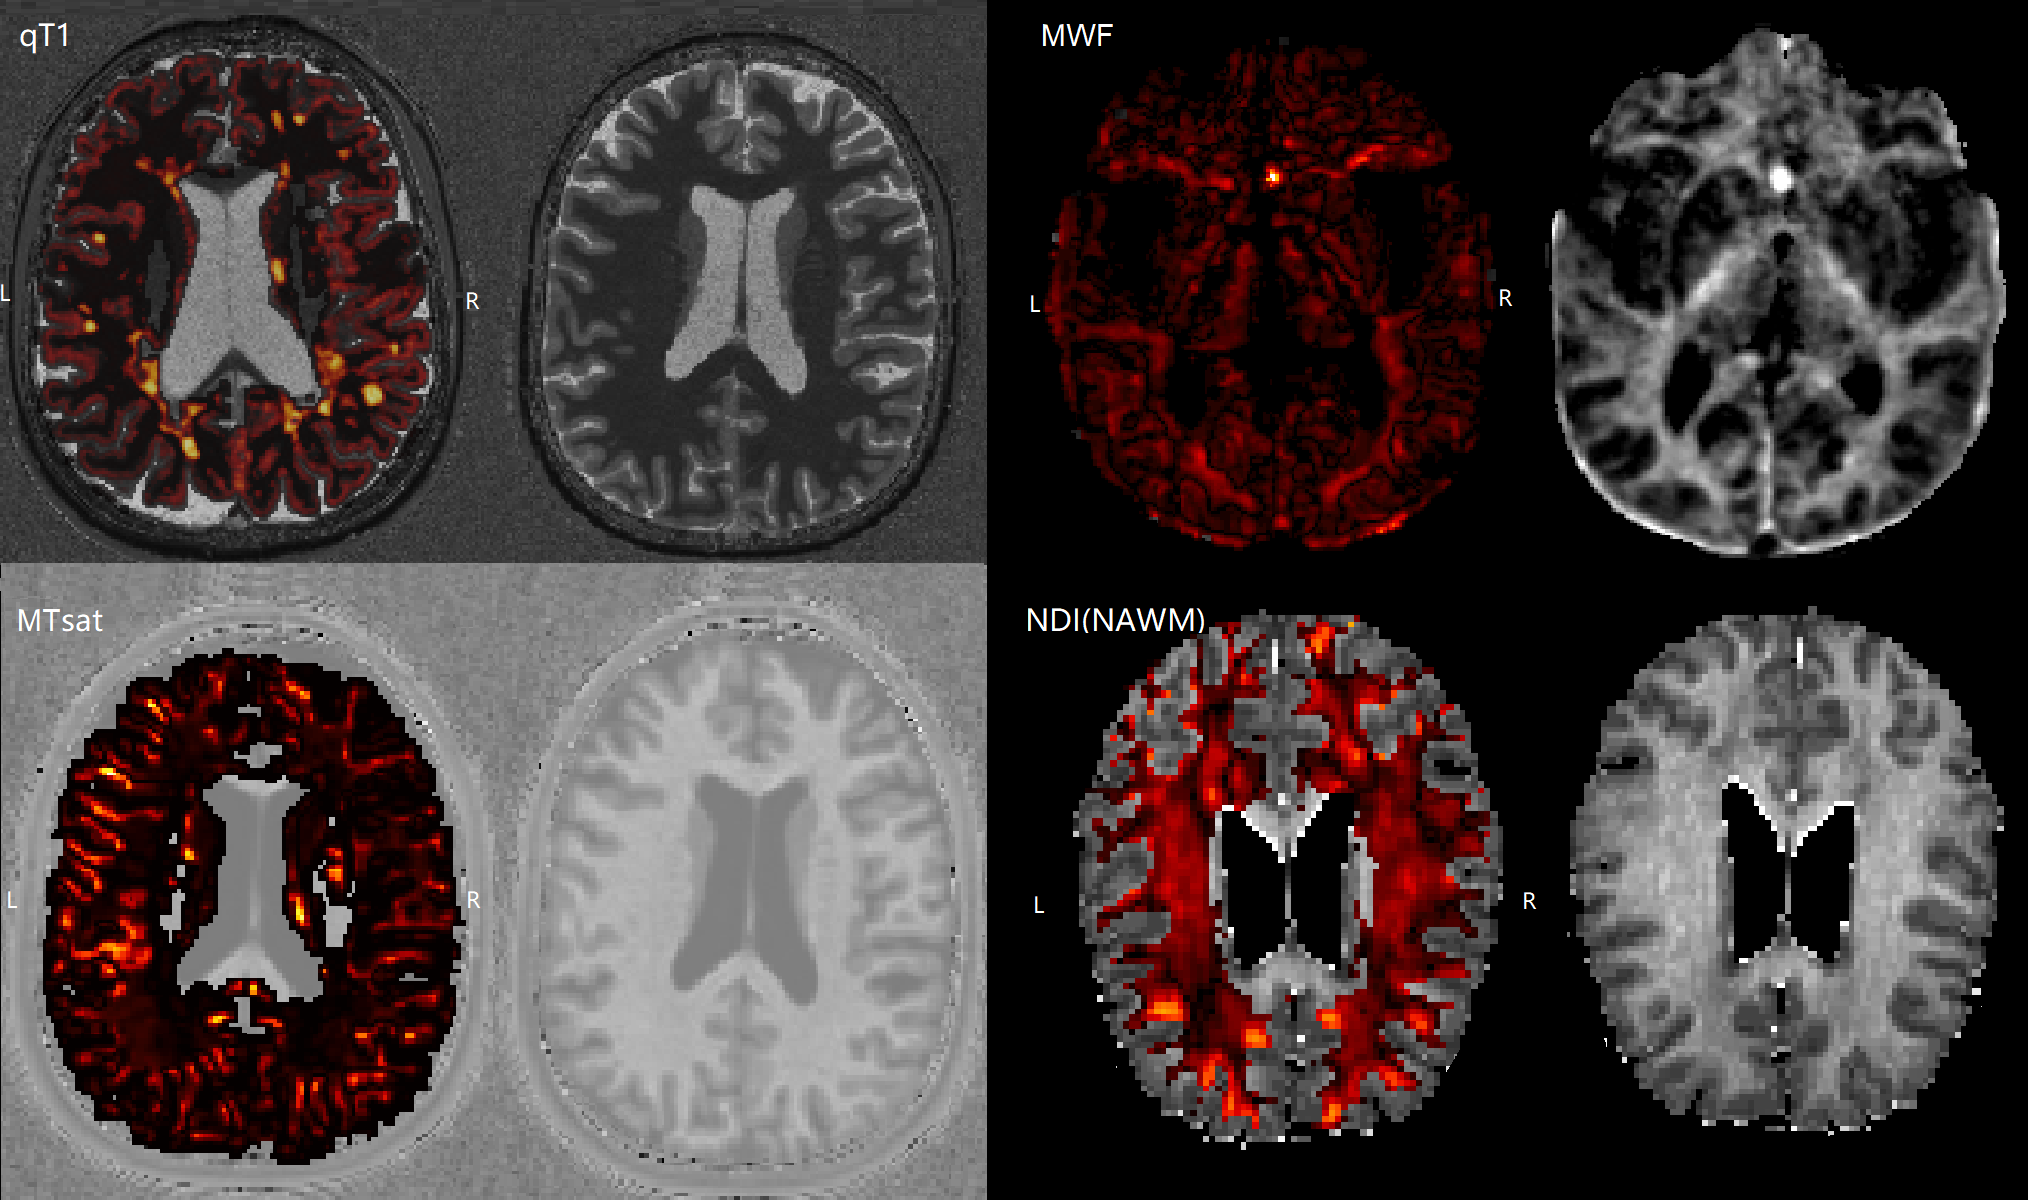
Figure 2 Example of personalized abnormalities maps in a MS patient
The Z-score maps are overlayed on different contrast. (qT1, MWF, MTsat, NDI-NAWM). qT1: quantitative T1, NDI: neurite density index, MWF: myelin water fraction, MTsat: magnetization transfer saturation, NAWM: normal-appearing white matter. L: left, R: right.
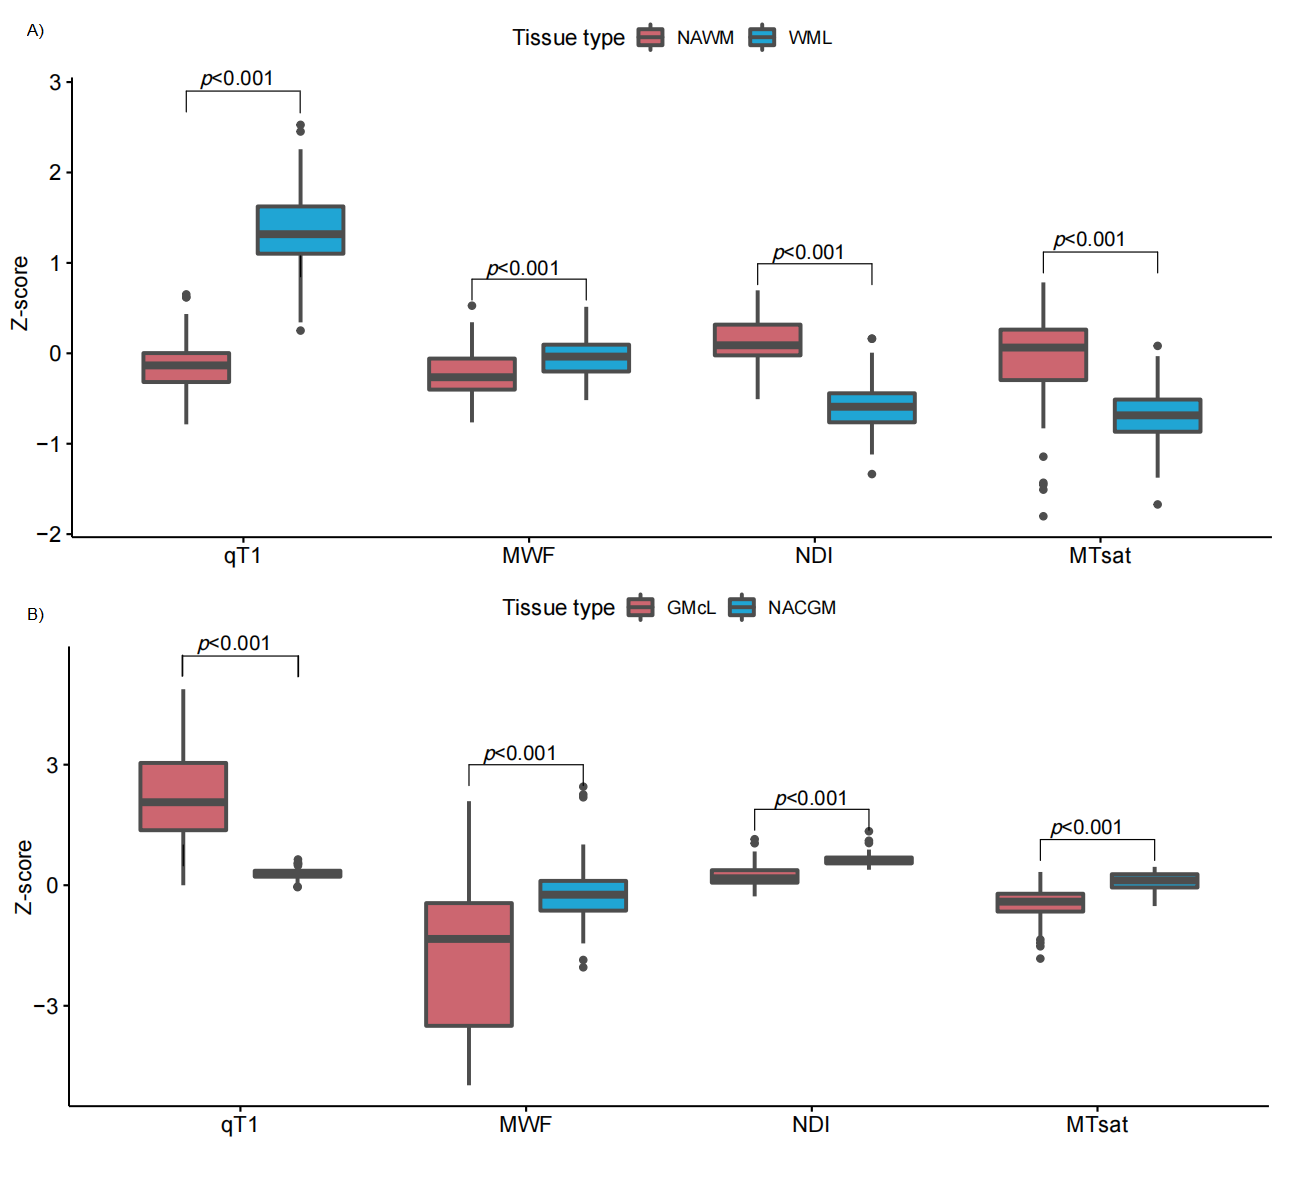
Figure 3 Z-score comparisons between normal-appearing tissue (NAWM/NACGM) and lesion tissue (WML/GMcL) among different qMRI parameters
Z-score comparisons A) between NAWM and WML, and B) between NACGM and GMcL among different qMRI parameters. qT1: quantitative T1, NDI: neurite density index, MWF: myelin water fraction, MTsat: magnetization transfer saturation, NAWM: normal-appearing white matter; NAcGM: normal-appearing cortex; WMLs: white matter lesions; GMcLs: cortical grey.
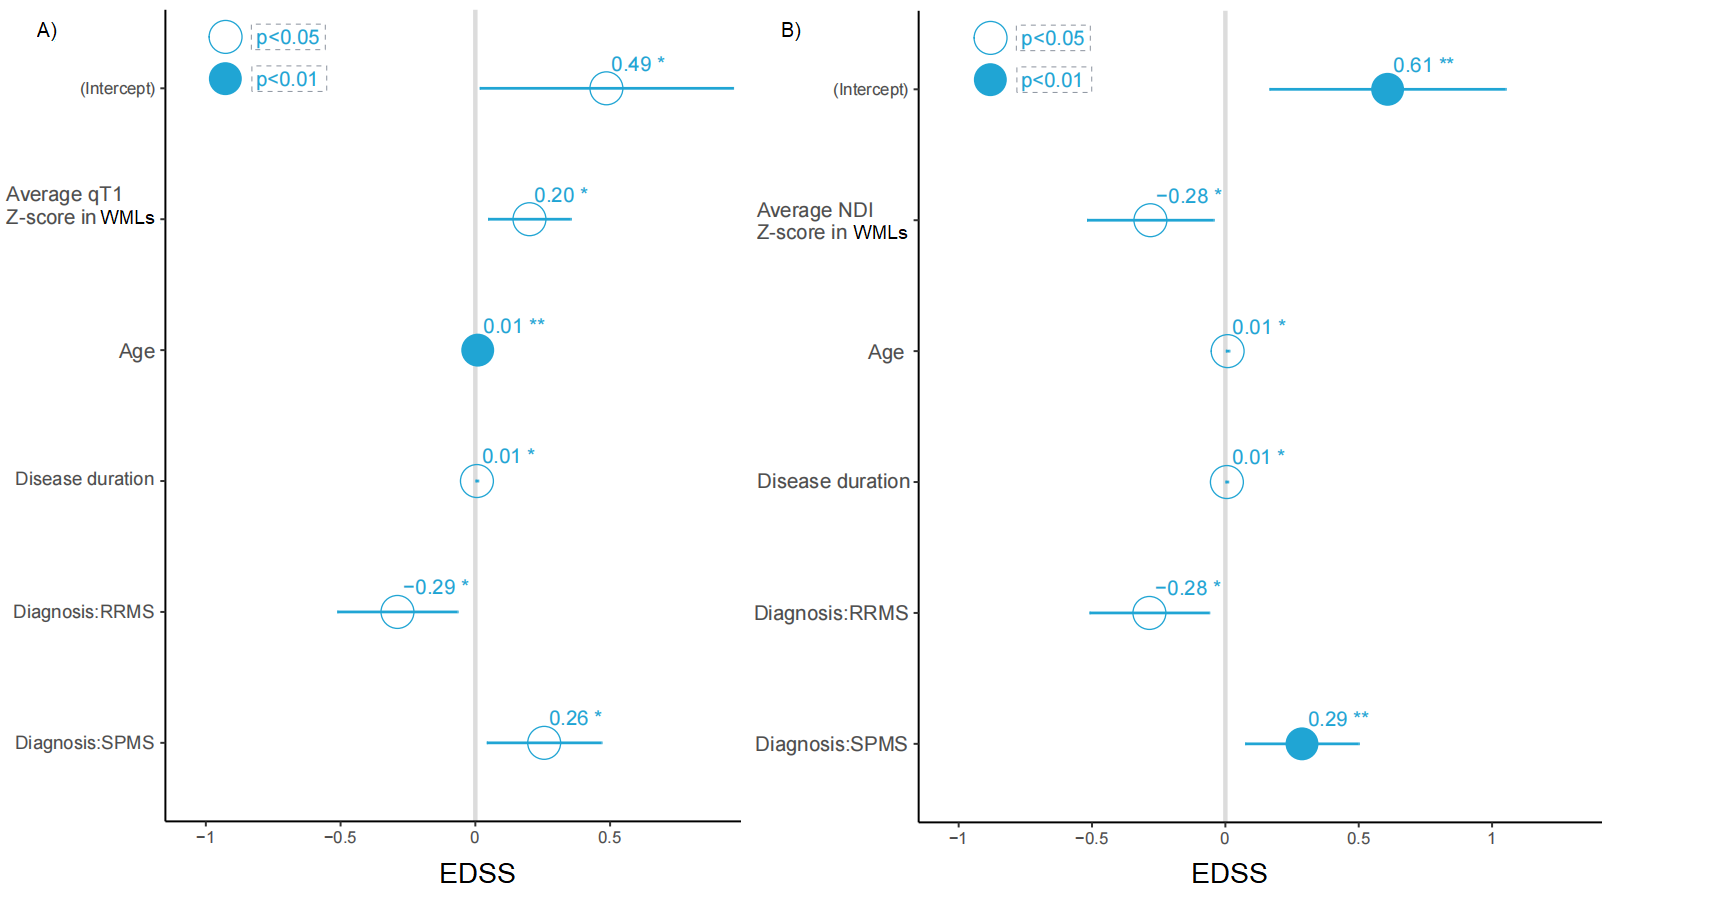
Figure 4 MLR analysis between Z-scores in WMLs and EDSS
MLR model with age, disease duration, diagnosis phenotype, and Z-score of A) qT1 and B) NDI in WML as covariates showed significant associations with EDSS (dependent variables). EDSS was log-transformed. MLR: multiple linear regression, RRMS: relapsing-remitting multiple sclerosis, EDSS: Expanded Disability Status Scale, qT1: quantitative T1, NDI: neurite density index. WMLs: white matter lesions, RRMS: relapsing-remitting multiple sclerosis; SPMS: secondary progressive multiple sclerosis.
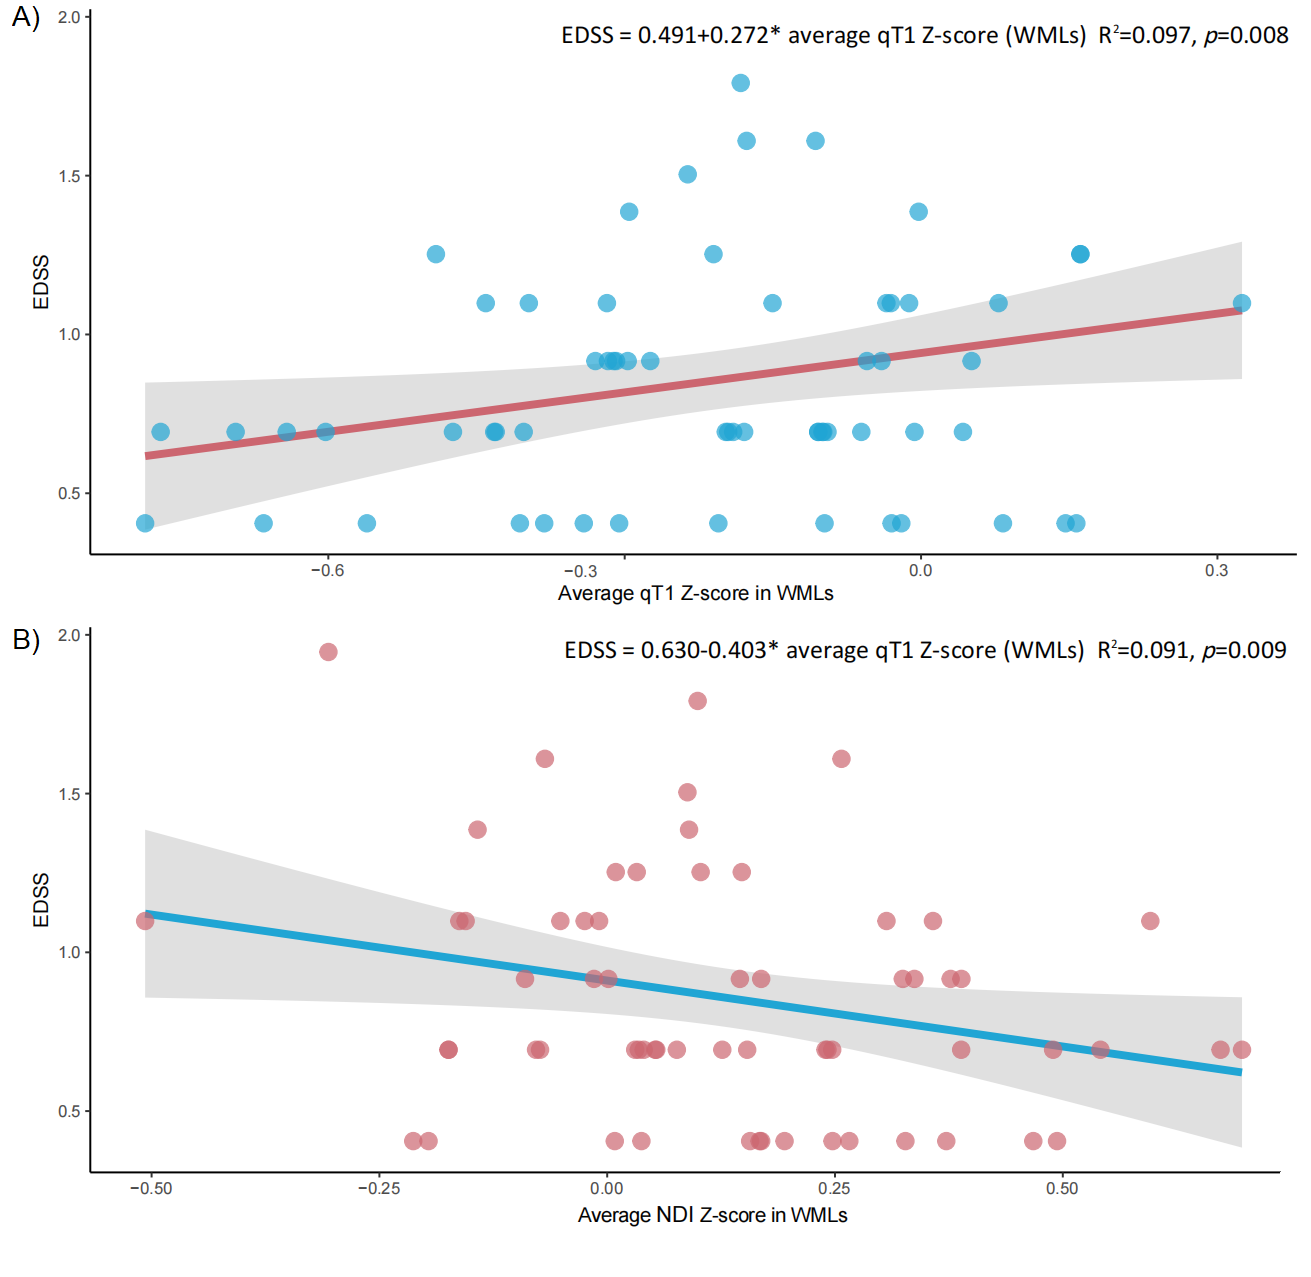
Figure 5 Relationship between Z-scores in WMLs and EDSS in subgroup analysis
In RRMS, A) only the average Z-score in WMLs showed a significant association with EDSS in the MLR model in qT1; B) only the average qT1 Z-score in WMLs showed a significant association with EDSS in the MLR model in NDI. EDSS was log-transformed. MLR with the backward selection included age, disease duration, phenotype and average Z-scores in WMLs as covariates. MLR: multiple linear regression, qT1: quantitative T1, NDI: neurite density index, EDSS: Expanded Disability Status Scale, WMLs: white matter lesions.