1255
Subject-specific detection of macro- and micro-structural alterations of deep gray matter nuclei using submillimeter 7T quantitative MRI1Advanced Clinical Imaging Technology, Siemens Healthineers International AG, Lausanne, Switzerland, 2Human Neuroscience Platform, Fondation Campus Biotech Geneva, Geneva, Switzerland, 3CIBM-AIT, École Polytechnique Fédérale de Lausanne (EPFL), Lausanne, Switzerland, 4Aix Marseille Univ, CNRS, CRMBM, Marseille, France, 5AP-HM, CHU Timone, Pôle d'Imagerie Médicale, CEMEREM, Marseille, France, 6Department of Radiology, Lausanne University Hospital and University of Lausanne, Lausanne, Switzerland, 7LTS5, École Polytechnique Fédérale de Lausanne (EPFL), Lausanne, Switzerland, 8Advanced Clinical Imaging Technology, Siemens Healthineers International AG, Bern, Switzerland, 9Translational Imaging Center (TIC), Swiss institute for Translational and Entrepreneurial Medicine, Bern, Switzerland, 10Magnetic Resonance Methodology, Institute of Diagnostic and Interventional Neuroradiology, University of Bern, Bern, Switzerland, 11Siemens Healthcare SAS, Saint-Denis, France, 12Department of Neurology, University Hospital Bern, Inselspital, University of Bern, Bern, Switzerland, 13Support Center for Advanced Neuroimaging, Institute for Diagnostic and Interventional Neuroradiology, Inselspital, University of Bern, Bern, Switzerland
Synopsis
Keywords: Quantitative Imaging, Tissue Characterization, Ultra-high field MRI
High-resolution 7T MRI allows to directly visualize deep gray matter nuclei (DGN), especially within the thalamus, and building reference ranges of volumes and relaxation times for these structures is of clinical relevance. Methods to automatically segment DGN at 7T have been recently proposed. In this study, we segmented DGN from a cohort of 132 healthy subjects scanned with the MP2RAGE at 7T to obtain both T1-weighted images and T1 maps. Reference ranges of volumes and T1 values were established and proved valuable in revealing both macro- and micro-structural tissue alterations in selected cases of patients with neurodegeneration.Introduction
Submillimeter resolution in conjunction with improved contrast-to-noise ratio and reduced partial volume effects of 7T MRI help identify substructures of the brain that are not visible at lower field strengths1–3. For instance, high-resolution 7T acquisitions provide a detailed visualization of deep gray matter nuclei (DGN), especially within the thalamus3, a structure that is composed of many nuclei and is involved in motor, sensory and integrative functions4,5. Recently, Brun et al.6 developed a novel framework, referred to as the "7TAMIbrain pipeline", to automatically segment DGN based on a single-atlas approach using 7T MP2RAGE acquisitions. Investigating the alterations of said DGN on a single-subject basis would be of clinical relevance for a wide range of neurological conditions7,8.In this study, a recently investigated multi-atlas version of the existing 7TAMIbrain pipeline9 is optimized to segment DGN in a large cohort of healthy subjects. Reference ranges accounting for the normal evolution with age of volumes and quantitative T1 values in the DGN are established and used for computing deviation maps on a single-subject basis in four patients as a proof-of-concept.
Methods
Study population and MR protocolA cohort of 132 healthy subjects (74 females, median age = 28$$$\,$$$y/o, range = [18-74]$$$\,$$$y/o) underwent MRI exams at 7T (MAGNETOM Terra, Siemens Healthcare, Erlangen, Germany). An MP2RAGE research application sequence10 was acquired for T1-weighted imaging and T1 mapping (resolution$$$\,$$$=$$$\,$$$0.6$$$\times$$$0.6$$$\times$$$0.6$$$\,$$$mm3, FOV$$$\,$$$=$$$\,$$$240$$$\times$$$240$$$\times$$$172$$$\,$$$mm3, TI1/TI2$$$\,$$$=$$$\,$$$800$$$\,$$$ms / 2700$$$\,$$$ms, TR$$$\,$$$=$$$\,$$$6$$$\,$$$s, undersampling:$$$\,$$$CSx4, TA$$$\,$$$=$$$\,$$$7:49$$$\,$$$min).
In addition, two patients (37$$$\,$$$y/o and 49$$$\,$$$y/o, males) with relapsing-remitting multiple sclerosis (RRMS) and two patients (39$$$\,$$$y/o and 56$$$\,$$$y/o, males) with cerebral autosomal dominant arteriopathy with sub-cortical infarcts and leukoencephalopathy (CADASIL) were scanned with the MP2RAGE, in agreement with institutional regulations.
All subjects were scanned using a 1-channel$$$\,$$$TX/32-channel$$$\,$$$RX head coil (Nova Medical, Wilmington, MA).
Image processing
The total intracranial volume (TIV) was estimated from MP2RAGE T1-weighted uniform ("UNI") images using the MorphoBox research application11,12.
To segment 12 thalamic nuclei and 12 other DGN in each brain hemisphere, the existing 7TAMIbrain pipeline, originally based on a single-atlas approach6, was adapted to support a multi-atlas approach9. Twenty atlases of the 7TAMIbrain dataset13 were used, yielding a more robust and accurate segmentation3. The atlases were registered onto the T1 map, previously cropped to 192$$$\times$$$192$$$\times$$$192 voxels to optimize computing time, with ANTs14 (fast registration using cross-correlation, rigid + affine + deformable SyN15). The labels of the twenty atlases were then merged using the joint fusion algorithm implemented in ANTs16 to reduce the impact of potential biases from image registration.
Normalized volume to the TIV and the average T1 relaxation time were computed over each resulting segmentation mask.
Normative data modelling
Reference ranges were established to account for the evolution of the relative volume (V) of each region with age using the following linear model:$$E\{V\}=\beta_0^{V}+\beta_{sex}^{V}\cdot sex+\beta_{age}^{V}\cdot age\,\textrm{,}$$ with $$$\beta_0^V$$$ being the model intercept, and sex$$$\,$$$=$$$\,$$$1 if the subject is male, 0 if female. A similar linear model was used to establish reference ranges for the T1 relaxation times while accounting for their quadratic evolution with age17,18:$$E\{T_1\}=\beta_0^{T_1}+\beta_{sex}^{T_1}\cdot sex+\beta_{age}^{T_1}\cdot age+\beta_{age^2}^{T_1}\cdot age^2\,\textrm{.}$$
Single-subject comparison
Volumetric and T1 deviations from the established reference norms were assessed in each region by z-score and projected on the UNI images with corresponding color gradient.
Results
Representative DGN masks obtained in three subjects are shown in Figure 1.Reference ranges for relative volumes and T1 in some example regions are shown in Figure 2 and 3, respectively. Volumes were found to decrease with age, and T1 to follow the typical U-shape trend17,18. The effect of gender was found not to be statistically significant for both relative volumes and T1.
In one RRMS patient, a significant T1 alteration (zT1$$$\,$$$=$$$\,$$$2.2) due to a visible lesion was assessed in the right mediodorsal thalamus, along with a reduced volume (zV$$$\,$$$=$$$\,$$$-2.8) of the left pulvinar nuclei (Figure 4 – patient #1). The other RRMS patient exhibited bilateral T1 alterations (zT1$$$\,$$$>$$$\,$$$2) in thalamic regions close to ventricles that were normal-appearing in the UNI contrast (Figure 4 – patient #2).
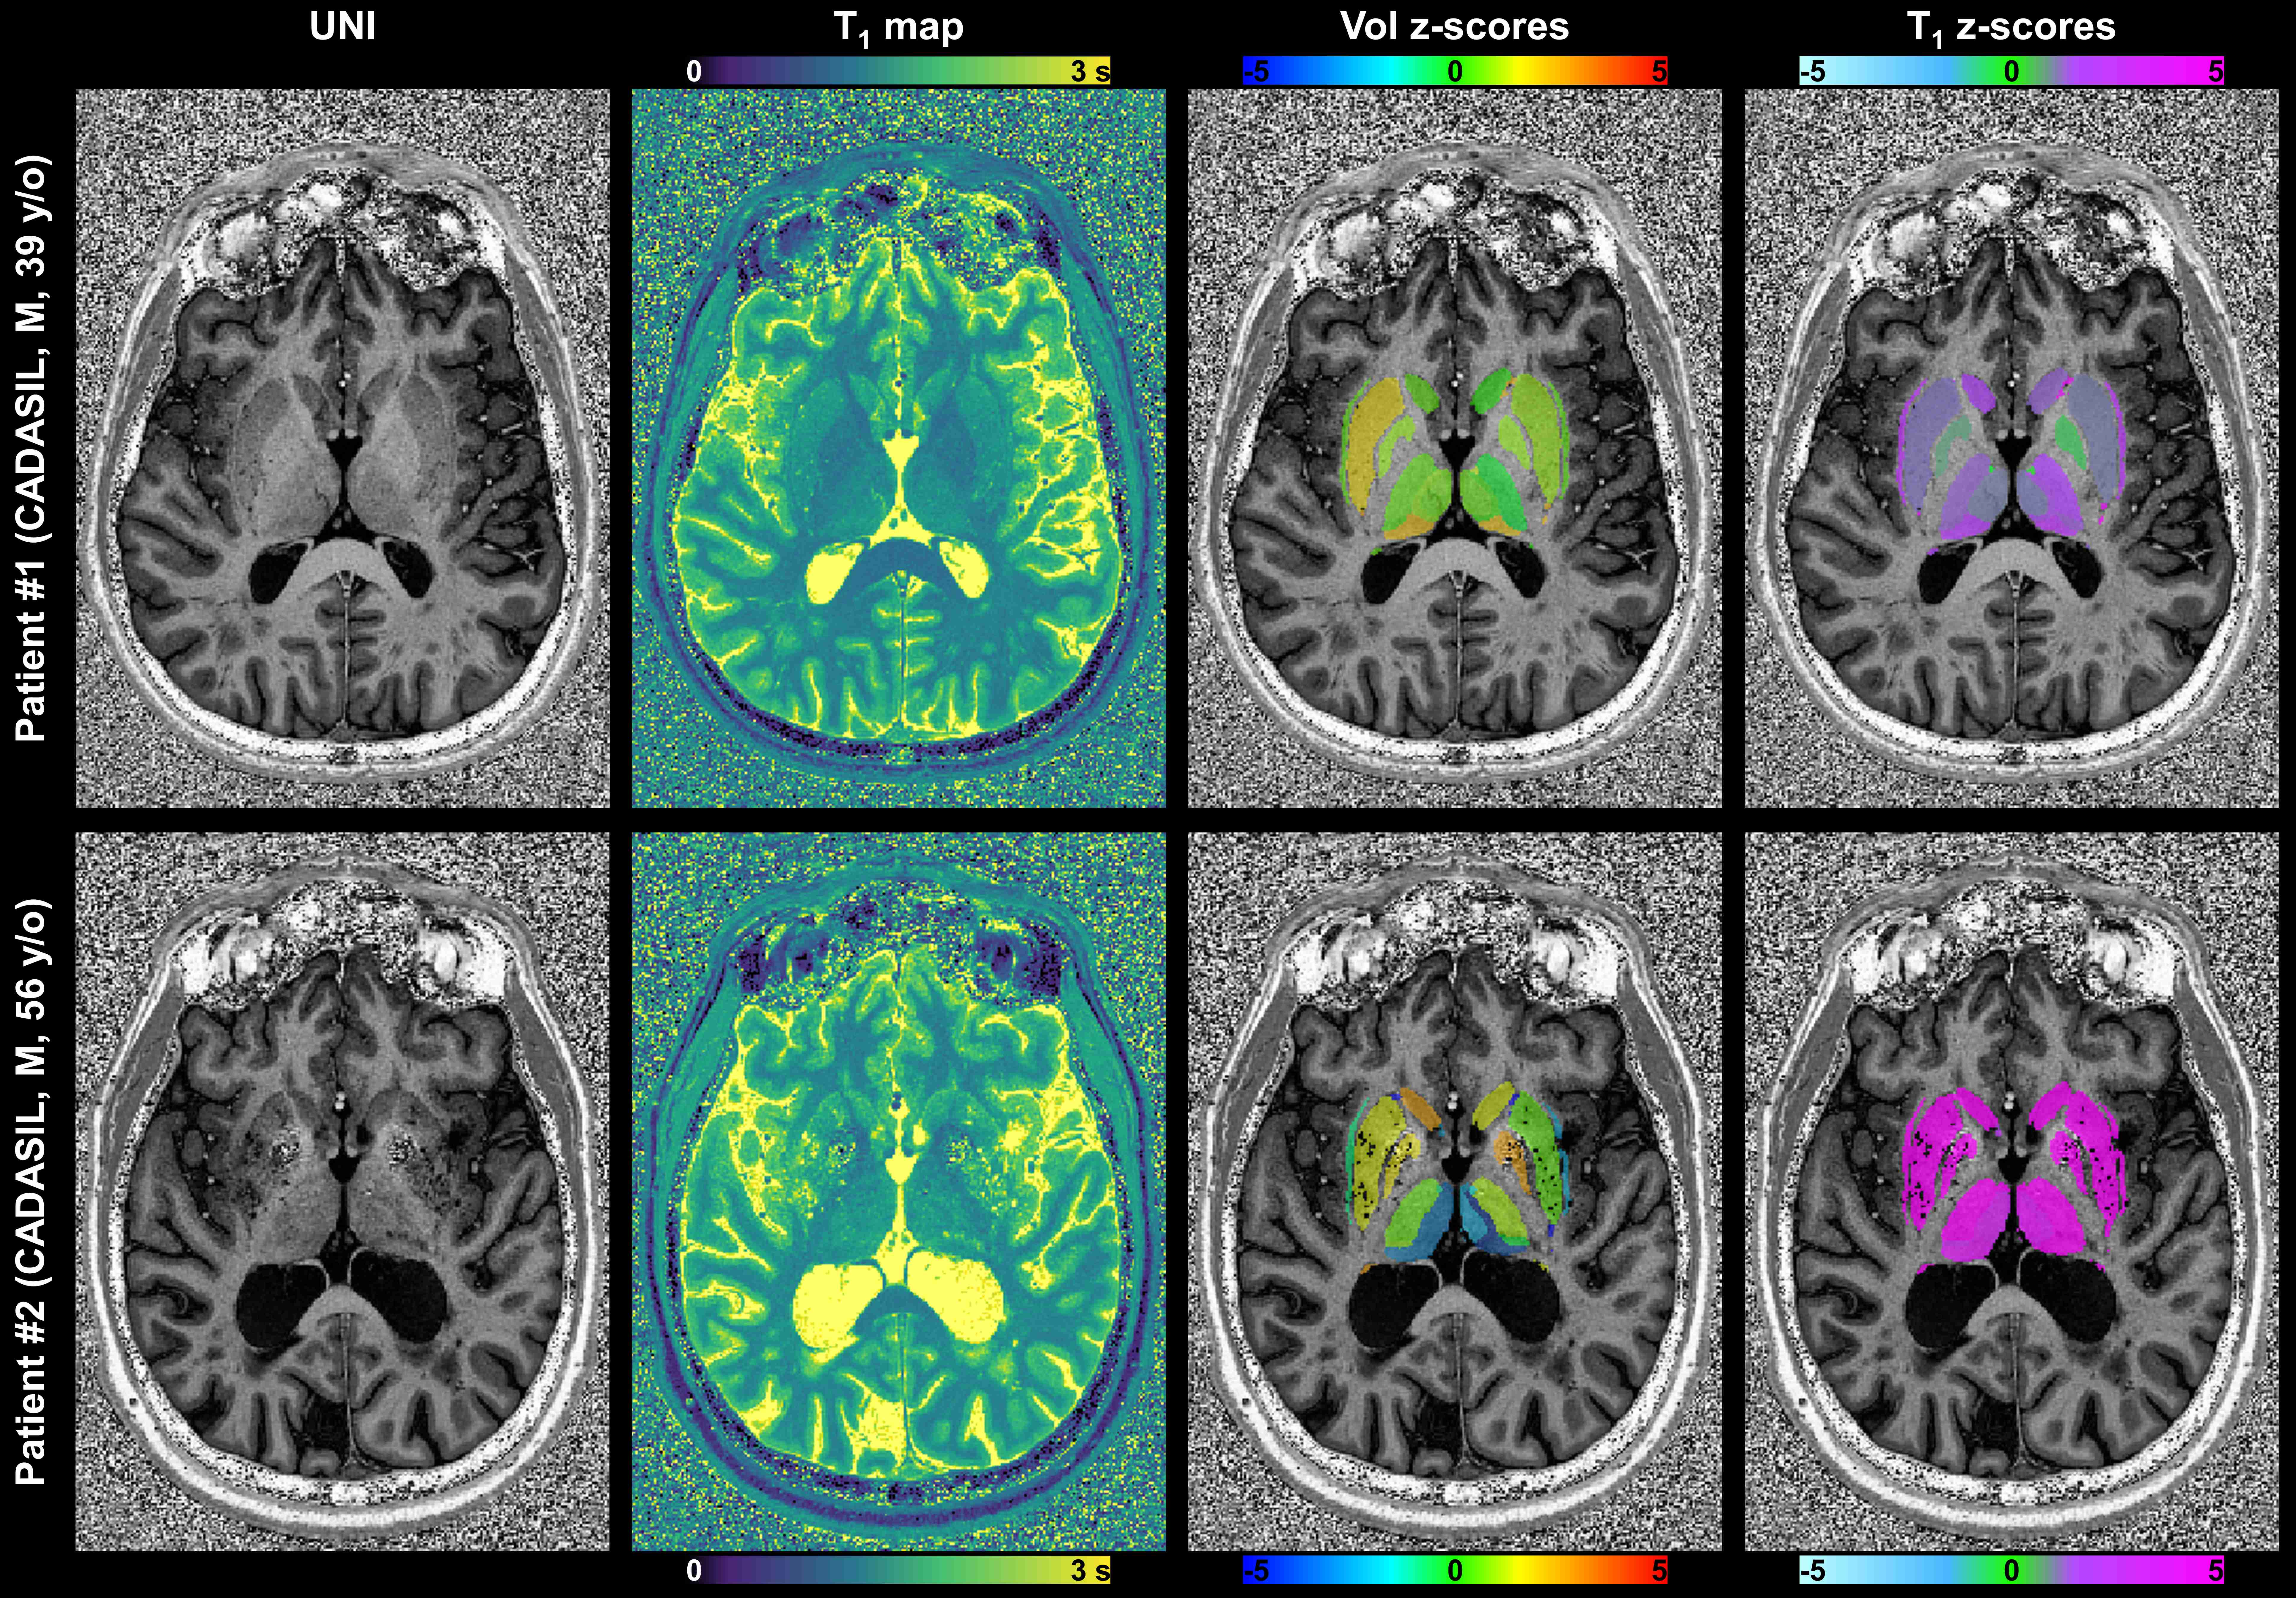
In the younger CADASIL patient, although volumes were found to be normal, abnormal T1 values (zT1 between 2 and 5) were found in several DGN (Figure 5 – patient #1). The older CADASIL patient showed significant bilateral atrophy (-2$$$\,$$$<$$$\,$$$zV$$$\,$$$<$$$\,$$$-8) in thalamic regions close to ventricles, and increased T1 values (zT1 up to 10) in most of the DGN (Figure 5 – patient #2).
Discussion and Conclusion
In this work, reference ranges for volumetric and T1 evolution of DGN with age were established, which proved valuable in revealing both macro- and micro-structural tissue alterations in single‐subject comparisons. In the RRMS patients, abnormalities were assessed in the presence of obvious lesions, but also in normal-appearing thalamic substructures close to ventricles that were previously indicated as possible area of degeneration in MS7. In CADASIL patients, alterations were found in most of the DGN, and they were more prominent in the older patient with longer disease duration. These findings suggest a potential for the proposed method to improve diagnostic and prognostic confidence. Future work should focus on validating the established norms as clinically meaningful in larger patient cohorts.Acknowledgements
No acknowledgement found.References
1. Tardif CL, Schäfer A, Waehnert M, Dinse J, Turner R, Bazin P-L. Multi-contrast multi-scale surface registration for improved alignment of cortical areas. Neuroimage. 2015;111:107-122. doi:10.1016/j.neuroimage.2015.02.005
2. Zaretskaya N, Fischl B, Reuter M, Renvall V, Polimeni JR. Advantages of cortical surface reconstruction using submillimeter 7 T MEMPRAGE. Neuroimage. 2018;165:11-26. doi:10.1016/j.neuroimage.2017.09.060
3. Su JH, Thomas FT, Kasoff WS, et al. Thalamus Optimized Multi Atlas Segmentation (THOMAS): fast, fully automated segmentation of thalamic nuclei from structural MRI. Neuroimage. 2019;194:272-282. doi:10.1016/j.neuroimage.2019.03.021
4. Ide S, Kakeda S, Korogi Y. Anatomy of the Thalamus. Brain Nerve. 2015;67(12):1459-1469. doi:10.11477/mf.1416200323
5. Hwang K, Bertolero MA, Liu WB, D’Esposito M. The Human Thalamus Is an Integrative Hub for Functional Brain Networks. J Neurosci. 2017;37(23):5594-5607. doi:10.1523/JNEUROSCI.0067-17.2017
6. Brun G, Testud B, Girard OM, et al. Automatic segmentation of deep grey nuclei using a high-resolution 7T magnetic resonance imaging atlas—Quantification of T1 values in healthy volunteers. Eur J Neurosci. 2022;55(2):438-460. doi:10.1111/ejn.15575
7. Ontaneda D, Raza PC, Mahajan KR, et al. Deep grey matter injury in multiple sclerosis: a NAIMS consensus statement. Brain. 2021;144(7):1974-1984. doi:10.1093/brain/awab132
8. Kalimo H, Miao Q, Tikka S, et al. CADASIL: the most common hereditary subcortical vascular dementia. Future Neurol. 2008;3(6):683-704. doi:10.2217/14796708.3.6.683
9. Haast RAM, Testud B, Makhalova J, et al. Multi-scale structural alterations of basal ganglia in focal epilepsy as demonstrated by 7T MRI. bioRxiv. January 2022. doi:10.1101/2022.11.01.514655
10. Mussard E, Hilbert T, Forman C, Meuli R, Thiran JP, Kober T. Accelerated MP2RAGE imaging using Cartesian phyllotaxis readout and compressed sensing reconstruction. Magn Reson Med. 2020;84(4):1881-1894. doi:10.1002/mrm.28244
11. Schmitter D, Roche A, Maréchal B, et al. An evaluation of volume-based morphometry for prediction of mild cognitive impairment and Alzheimer’s disease. NeuroImage Clin. 2015;7:7-17. doi:10.1016/j.nicl.2014.11.001
12. Piredda GF, Venkategowda PB, Radojewski P, et al. Automated brain morphometry for sub-millimeter 7T MRI using transfer learning. In: Proceedings of the International Society of Magnetic Resonance in Medicine, London, UK. 2022. Abstract: 2155.
13. Girard O, de Rochefort L, Guye M, Ranjeva J-P, Troter A Le. 7TAMIbrain. OpenNeuro. 2021. doi:10.18112/openneuro.ds003967.v1.0.0
14. Avants BB, Tustison N, Song G. Advanced normalization tools (ANTS). Insight j. 2009;2:1-35.
15. Avants B, Epstein C, Grossman M, Gee J. Symmetric diffeomorphic image registration with cross-correlation: Evaluating automated labeling of elderly and neurodegenerative brain. Med Image Anal. 2008;12(1):26-41. doi:10.1016/j.media.2007.06.004
16. Wang H, Yushkevich PA. Multi-atlas segmentation with joint label fusion and corrective learning—an open source implementation. Front Neuroinform. 2013;7(November):1-12. doi:10.3389/fninf.2013.00027
17. Okubo G, Okada T, Yamamoto A, et al. Relationship between aging and T1 relaxation time in deep gray matter: A voxel-based analysis. J Magn Reson Imaging. 2017;46(3):724-731. doi:https://doi.org/10.1002/jmri.25590
18. Slater DA, Melie‐Garcia L, Preisig M, Kherif F, Lutti A, Draganski B. Evolution of white matter tract microstructure across the life span. Hum Brain Mapp. 2019;40(7):2252-2268. doi:10.1002/hbm.24522
Figures